monitor tools

Project description
monitors


Logo

仓库地址:
背景介绍
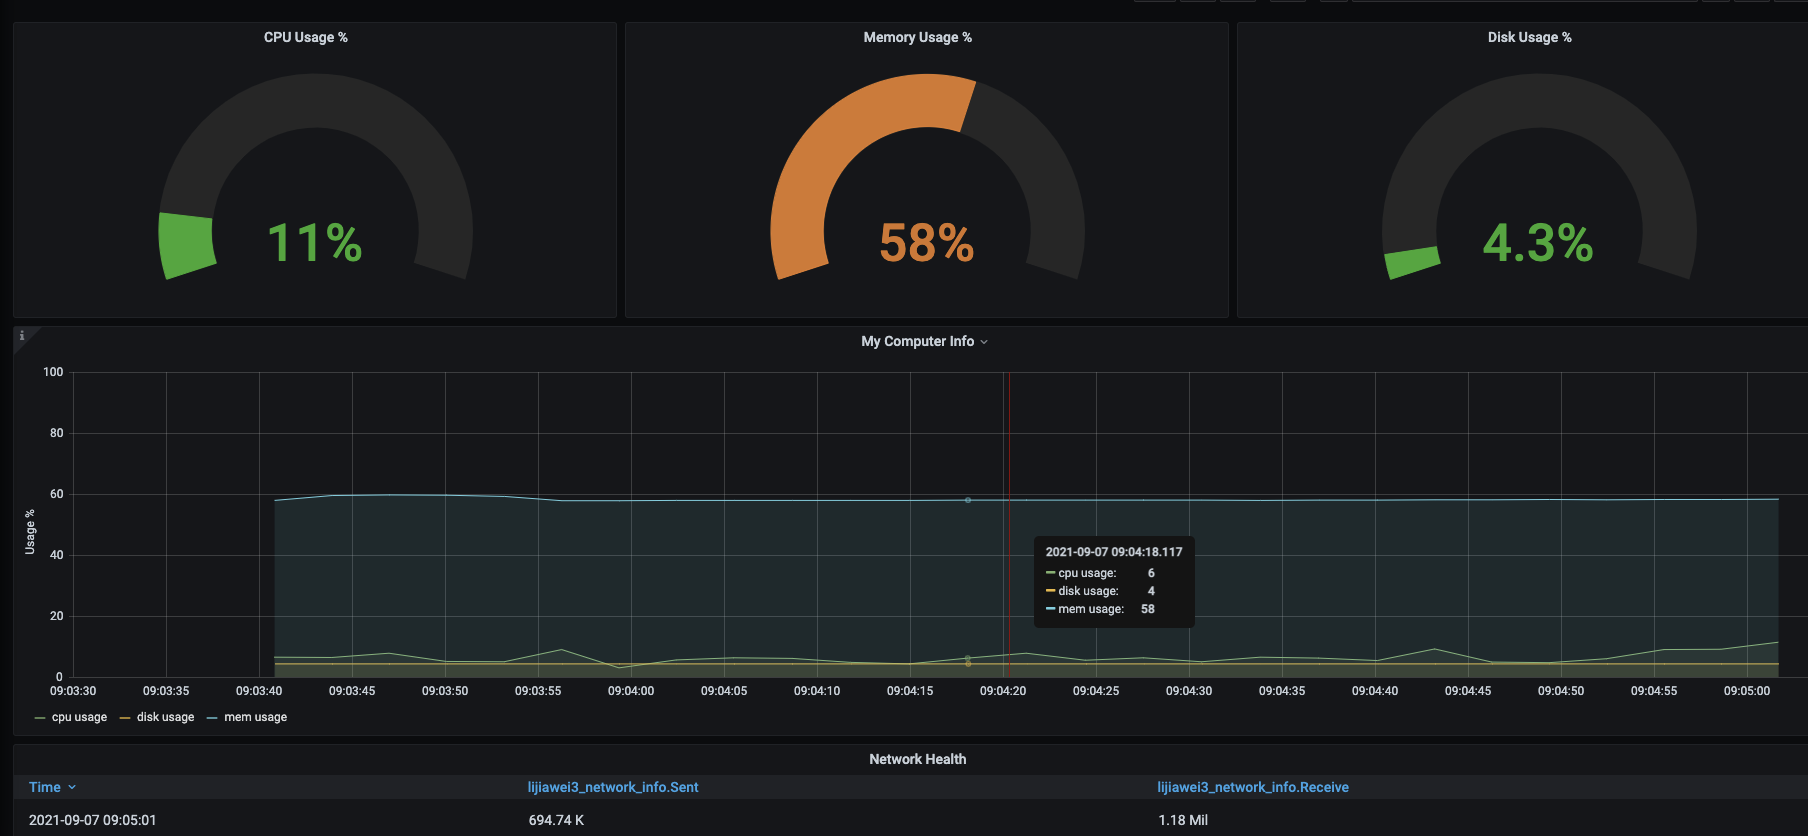
专项测试,桌面端应用程序使用过程中,对CPU,内存,磁盘使用率,网络流量进行监控并展现.
解决方案
需求梳理
- 简单方便 傻瓜式操作
- 数据持久化,数据可保存
- 数据可视化,清晰明了
解决方案来了,如下
minitor作为监控服务,influxdb做为数据收集,Grafana图表可视化展示,干就完了!
前提准备
- 你需要安装好 influxdb
- 你还需要安装好 grafana
看到这,你是不是又慌乱了,怎么还需要这么多准备工作。莫慌,教程都给你准备好了,乖,张开嘴,吃~
安装服务
pip install -U monitors
启动服务
# -*- coding: utf-8 -*-
"""
@Project :monitors
@File    :monitor.py
@Author  :lijiawei
@Date    :2021/9/6 4:13 下午
"""

from monitors.monitor_set import Settings as ST
import argparse


parser = argparse.ArgumentParser(description='manual to this script')
parser.add_argument("-name", type=str)

args = parser.parse_args()
name = args.name

# 服务端ip
ST.host = '127.0.0.1'
# influxdb 端口
ST.port = 8086
# influxdb 账号
ST.password = '*********'
# influxdb 数据库
ST.database = 'test_database'
# Grafana apikey
ST.apikey = '********'
# influxdb 表
ST.table = name

from monitors.monitor_util import monitor_on

monitor_on()
注意:脚本内容禁止任何修改!
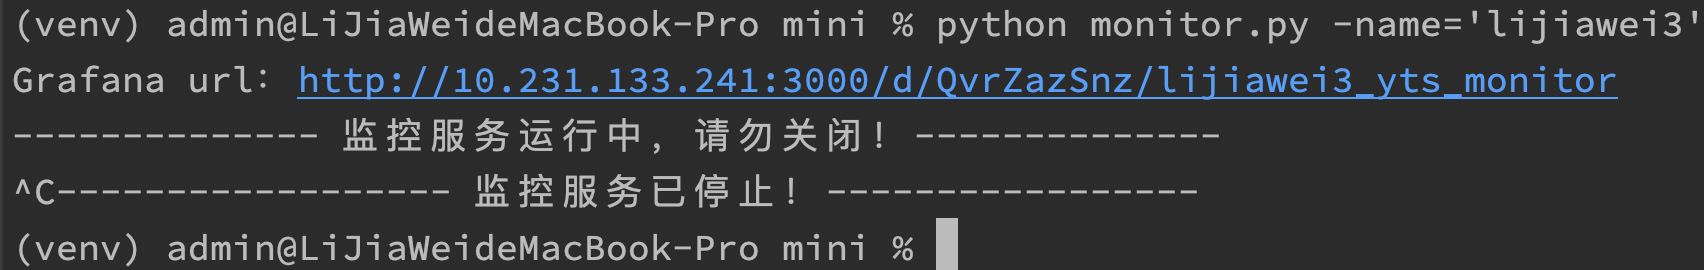
运行命令
python monitor.py -name=test_monitor

参数说明:name 必须为唯一值
查看结果
打开 Grafana url 登录后 查看监控图表
Grafana账号密码:test/test
停止监控
按下 CTRL + C,监控服务已停止!
后续方案
在推广使用过程中,发现尽管已经做的如此简单,还是有同学不会使用,一步三个坑,后续我计划把【minitors】监控服务,打包成可执行文件,有完整的页面交互,防止大家掉坑!
视频分析
          点击应用图标              弹窗1   关闭弹窗1     欢迎页     滑动欢迎页    弹窗2    关闭弹窗2   首页
              ^                     ^                   ^                     ^                  ^
              |                     |                   |                     |                  |
              |---------logo1-------|-------logo2-------|--------.......------|------......------|

稳定阶段(个): 2         1          1         1          1                     1                  2

              |                     |                   |                     |                  |
              v                     v                   v                     v                  v
              A                     B                   C                     D                  E
以上便是 monitors 的基本用法介绍。
如果您有发现错误,或者您对 monitors 有任何建议,欢迎到 monitors Issues 发表,非常感谢您的支持。您的反馈和建议非常宝贵,希望您的参与能帮助 monitors 做得更好。
Release history Release notifications | RSS feed


Download files
Download the file for your platform. If you're not sure which to choose, learn more about installing packages.
Source Distribution
Built Distribution
Filter files by name, interpreter, ABI, and platform.
If you're not sure about the file name format, learn more about wheel file names.
Copy a direct link to the current filters
File details
Details for the file monitors-1.1.2.tar.gz.
File metadata
- Download URL: monitors-1.1.2.tar.gz
- Upload date:
- Size: 50.4 kB
- Tags: Source
- Uploaded using Trusted Publishing? No
- Uploaded via: twine/4.0.2 CPython/3.9.16
File hashes
| Algorithm | Hash digest | |
|---|---|---|
| SHA256 |
510571e985acd172344e864b8495e46b7a494ea629a21146d94fcceeca87fc8c
|
|
| MD5 |
4ce745238b8d911f8c60c344f594a0dc
|
|
| BLAKE2b-256 |
8b5dbdcb16ba6681a10184a14f789de23110dab940c876d12d3dd4d4a2dc6f2e
|
File details
Details for the file monitors-1.1.2-py3-none-any.whl.
File metadata
- Download URL: monitors-1.1.2-py3-none-any.whl
- Upload date:
- Size: 59.1 kB
- Tags: Python 3
- Uploaded using Trusted Publishing? No
- Uploaded via: twine/4.0.2 CPython/3.9.16
File hashes
| Algorithm | Hash digest | |
|---|---|---|
| SHA256 |
e3547363632ded3481101623c76c60b999d07a2425943e181649183457dfabd7
|
|
| MD5 |
d7d7bfe1244a67d499940d069f3f66d3
|
|
| BLAKE2b-256 |
78db7e69dc7df509553ecd040c15c50550d970c1c58d7b6db3ee2034ff5a015d
|


