Matplotlib wave plotting and animation made easy

Project description
Moonlight
Matplotlib wave plotting and animation made easy
Installation
- For pip release -
pip install moonlight - For source build -
git clone https://github.com/CharlesAverill/moonlight.git moonlight
cd moonlight
python setup.py install
Usage
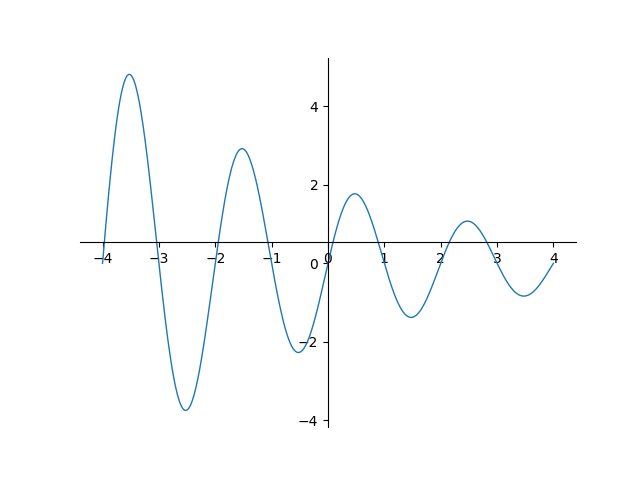
from moonlight import waves, utils

# Create a damped Sine wave with amplitude, period 2
sine = waves.Sine(amplitude=2, period=2,
                    decay_constant=.25)

# Set range of plot
utils.x_range(-3, 3)
utils.y_range(-4, 4)

# Move axes to center
utils.center_axes()

# Plot 2 periods of the wave (static)
sine.plot(2)
Animation
Waves can also be animated! Just replace <wave_object>.plot() with <wave_object>.animate()!
animate parameters
speed- The speed at which the animation will play. Some waves have their default speed adjusted so that animation can be seen easily.- When combining a
SquareorSawtoothwave with aSineorCosinewave, the sum of the functions naturally grows at an incredibly slow rate, sospeedshould be set to a multiple of10**14to be able to view animations properly.
- When combining a
line_width- Sets line widthframerate- Measured in ms, this is the time gap between two frames being displayed. Default is 17ms or ~60fps.
Supported Waves
SineCosineSquareSawtoothWave- This is a parent class for the previous waves. Custom waves can be implemented by inheriting this class.
Wave parameters
amplitude: float = 1- Initial wave amplitudeperiod: float = <varies by wave>- Period of waveoffsets: Tuple(float [x], float [y]) = (0, 0)- X- and Y- offsets of the wavedecay_constant: float = 0- If nonzero, function will decay according toe^(-<decay>x)wavefunc(x). Trig functions only.resolution: int = 500- Number of x-values that will be generated upon graphing.
Wave operators
Waves can be operated on by each other and by scalar values.
from moonlight.waves import Sine

s1 = Sine()
s2 = Sine(amplitude=2)

add_waves = s1 + s2 # sin(x) + 2sin(x) = 3sin(x)
add_scalar = s1 + 3 # sin(x) + 3

sub_waves = s1 - s2 # sin(x) - 2sin(x) = -sin(x)
sub_scalar = s1 - 3 # sin(x) - 3

mul_waves = s1 * s2 # sin(x) * 2sin(x) = 2sin(x)^2
mul_scalar = s1 * 3 # sin(x) * 3 = 3sin(x)

div_waves = s1 / s2 # sin(x) / 2sin(x) = 1/2
div_scalar = s1 / 3 # sin(x) / 3 = (1/3)sin(x)

call_waves = s1(s2) # sin(2sin(x))
call_scalar = s1(3) # sin(3) ≈ .14112
Release history Release notifications | RSS feed


Download files
Download the file for your platform. If you're not sure which to choose, learn more about installing packages.
Source Distribution
moonlightplt-0.2.2.tar.gz
(5.6 kB
view details)
Built Distribution
Filter files by name, interpreter, ABI, and platform.
If you're not sure about the file name format, learn more about wheel file names.
Copy a direct link to the current filters
File details
Details for the file moonlightplt-0.2.2.tar.gz.
File metadata
- Download URL: moonlightplt-0.2.2.tar.gz
- Upload date:
- Size: 5.6 kB
- Tags: Source
- Uploaded using Trusted Publishing? No
- Uploaded via: twine/3.2.0 pkginfo/1.5.0.1 requests/2.24.0 setuptools/50.3.0 requests-toolbelt/0.9.1 tqdm/4.54.1 CPython/3.7.4
File hashes
| Algorithm | Hash digest | |
|---|---|---|
| SHA256 |
adbb2154460f5574a49f2e6b3f53e189e27788f1c0c34eb6ca71eaca70297a52
|
|
| MD5 |
7e213abd0058095b95e25d9be9e05f3e
|
|
| BLAKE2b-256 |
935c4bb0c61b0f19f4a9d27387c57e7d92dc9cc6c1245c46f4db8b443cbd901a
|
File details
Details for the file moonlightplt-0.2.2-py3-none-any.whl.
File metadata
- Download URL: moonlightplt-0.2.2-py3-none-any.whl
- Upload date:
- Size: 7.5 kB
- Tags: Python 3
- Uploaded using Trusted Publishing? No
- Uploaded via: twine/3.2.0 pkginfo/1.5.0.1 requests/2.24.0 setuptools/50.3.0 requests-toolbelt/0.9.1 tqdm/4.54.1 CPython/3.7.4
File hashes
| Algorithm | Hash digest | |
|---|---|---|
| SHA256 |
6ec8d9b5c47fe5e8561c6b1395442cf772d11b644d717a622b826ad4cb738a2b
|
|
| MD5 |
d42f0b589e4168afc03d2cd148a53860
|
|
| BLAKE2b-256 |
0d0e2f91a39ce071a8fd0292dc42710c2c337c41f99bd6ba710aa6f3d8a5d97e
|


