
Residual-based shading for mosaic plots in Python
Verified details
These details have been verified by PyPIProject links
GitHub Statistics
Maintainers

Project description
MosaicShade 





Overview
Implements residual-based shading for mosaic displays in Python.
Shading based on residuals offers a way of visualizing how your data departs from a given statistical model. Currently, MosaicShade only uses the model of independence (see Limitations).
Colour and shading intensity respectively indicate the direction and magnitude of residuals, making patterns of association between categorical variables easier to identify.
MosaicShade extends
statsmodels.graphics.mosaicplot.mosaic.
The shading scheme used was inspired by shading_Friendly from the
vcd package in the
programming language R.
Installation
Install MosaicShade from PyPI:
python -m pip install mosaicshade
Usage
Currently, data needs to be a pd.DataFrame to be accepted by the
mosaic function (see Limitations). The below is a
made-up pd.DataFrame that will be used for subsequent examples:
import pandas as pd

df = pd.DataFrame({
    "Treatment": ["A", "A", "A", "A", "B", "B", "B", "B"],
    "Outcome": ["Good", "Good", "Bad", "Bad"] * 2,
    "Sex": ["Female", "Male"] * 4,
    "Freq": [20, 23, 3, 4, 2, 2, 10, 72]
})

df
| Treatment | Outcome | Sex | Freq | |
|---|---|---|---|---|
| 0 | A | Good | Female | 20 |
| 1 | A | Good | Male | 23 |
| 2 | A | Bad | Female | 3 |
| 3 | A | Bad | Male | 4 |
| 4 | B | Good | Female | 2 |
| 5 | B | Good | Male | 2 |
| 6 | B | Bad | Female | 10 |
| 7 | B | Bad | Male | 72 |
To make a mosaic from this data, we can call the mosaicshade.mosaic
function, specifying the frequency column with the freq argument:
import mosaicshade
import matplotlib.pyplot as plt

mosaicshade.mosaic(df, freq='Freq')
plt.show() # Show the plot
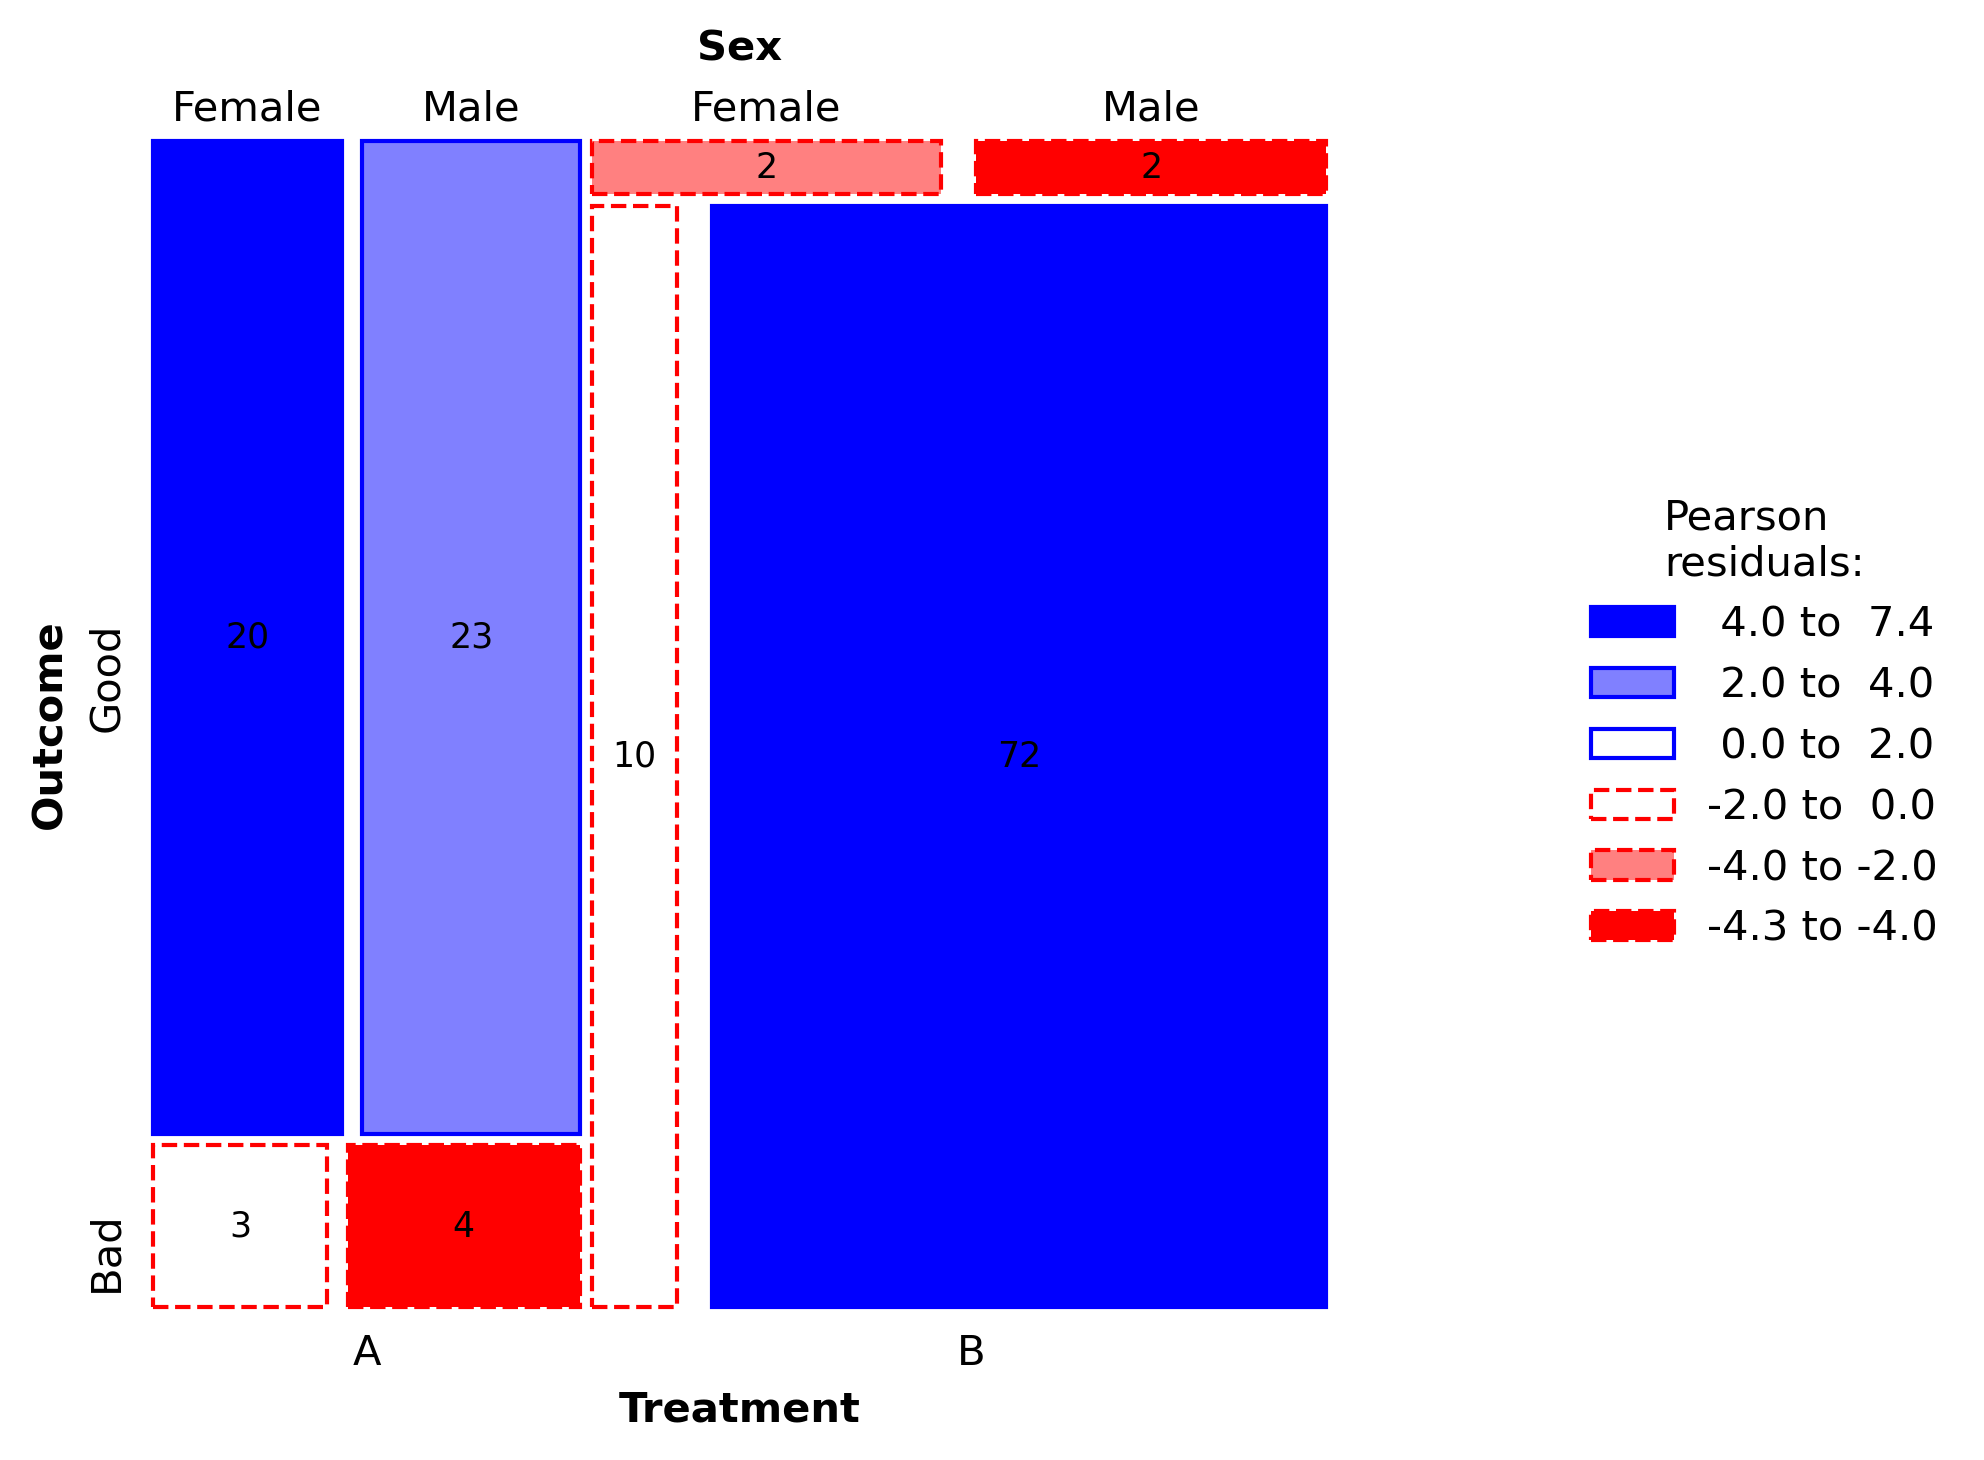
We can optionally select specific dimensions (columns) to use in this plot, summing over those that are excluded:
mosaicshade.mosaic(
    df,
    freq='Freq',
    dims=['Treatment', 'Outcome']
)
plt.show()
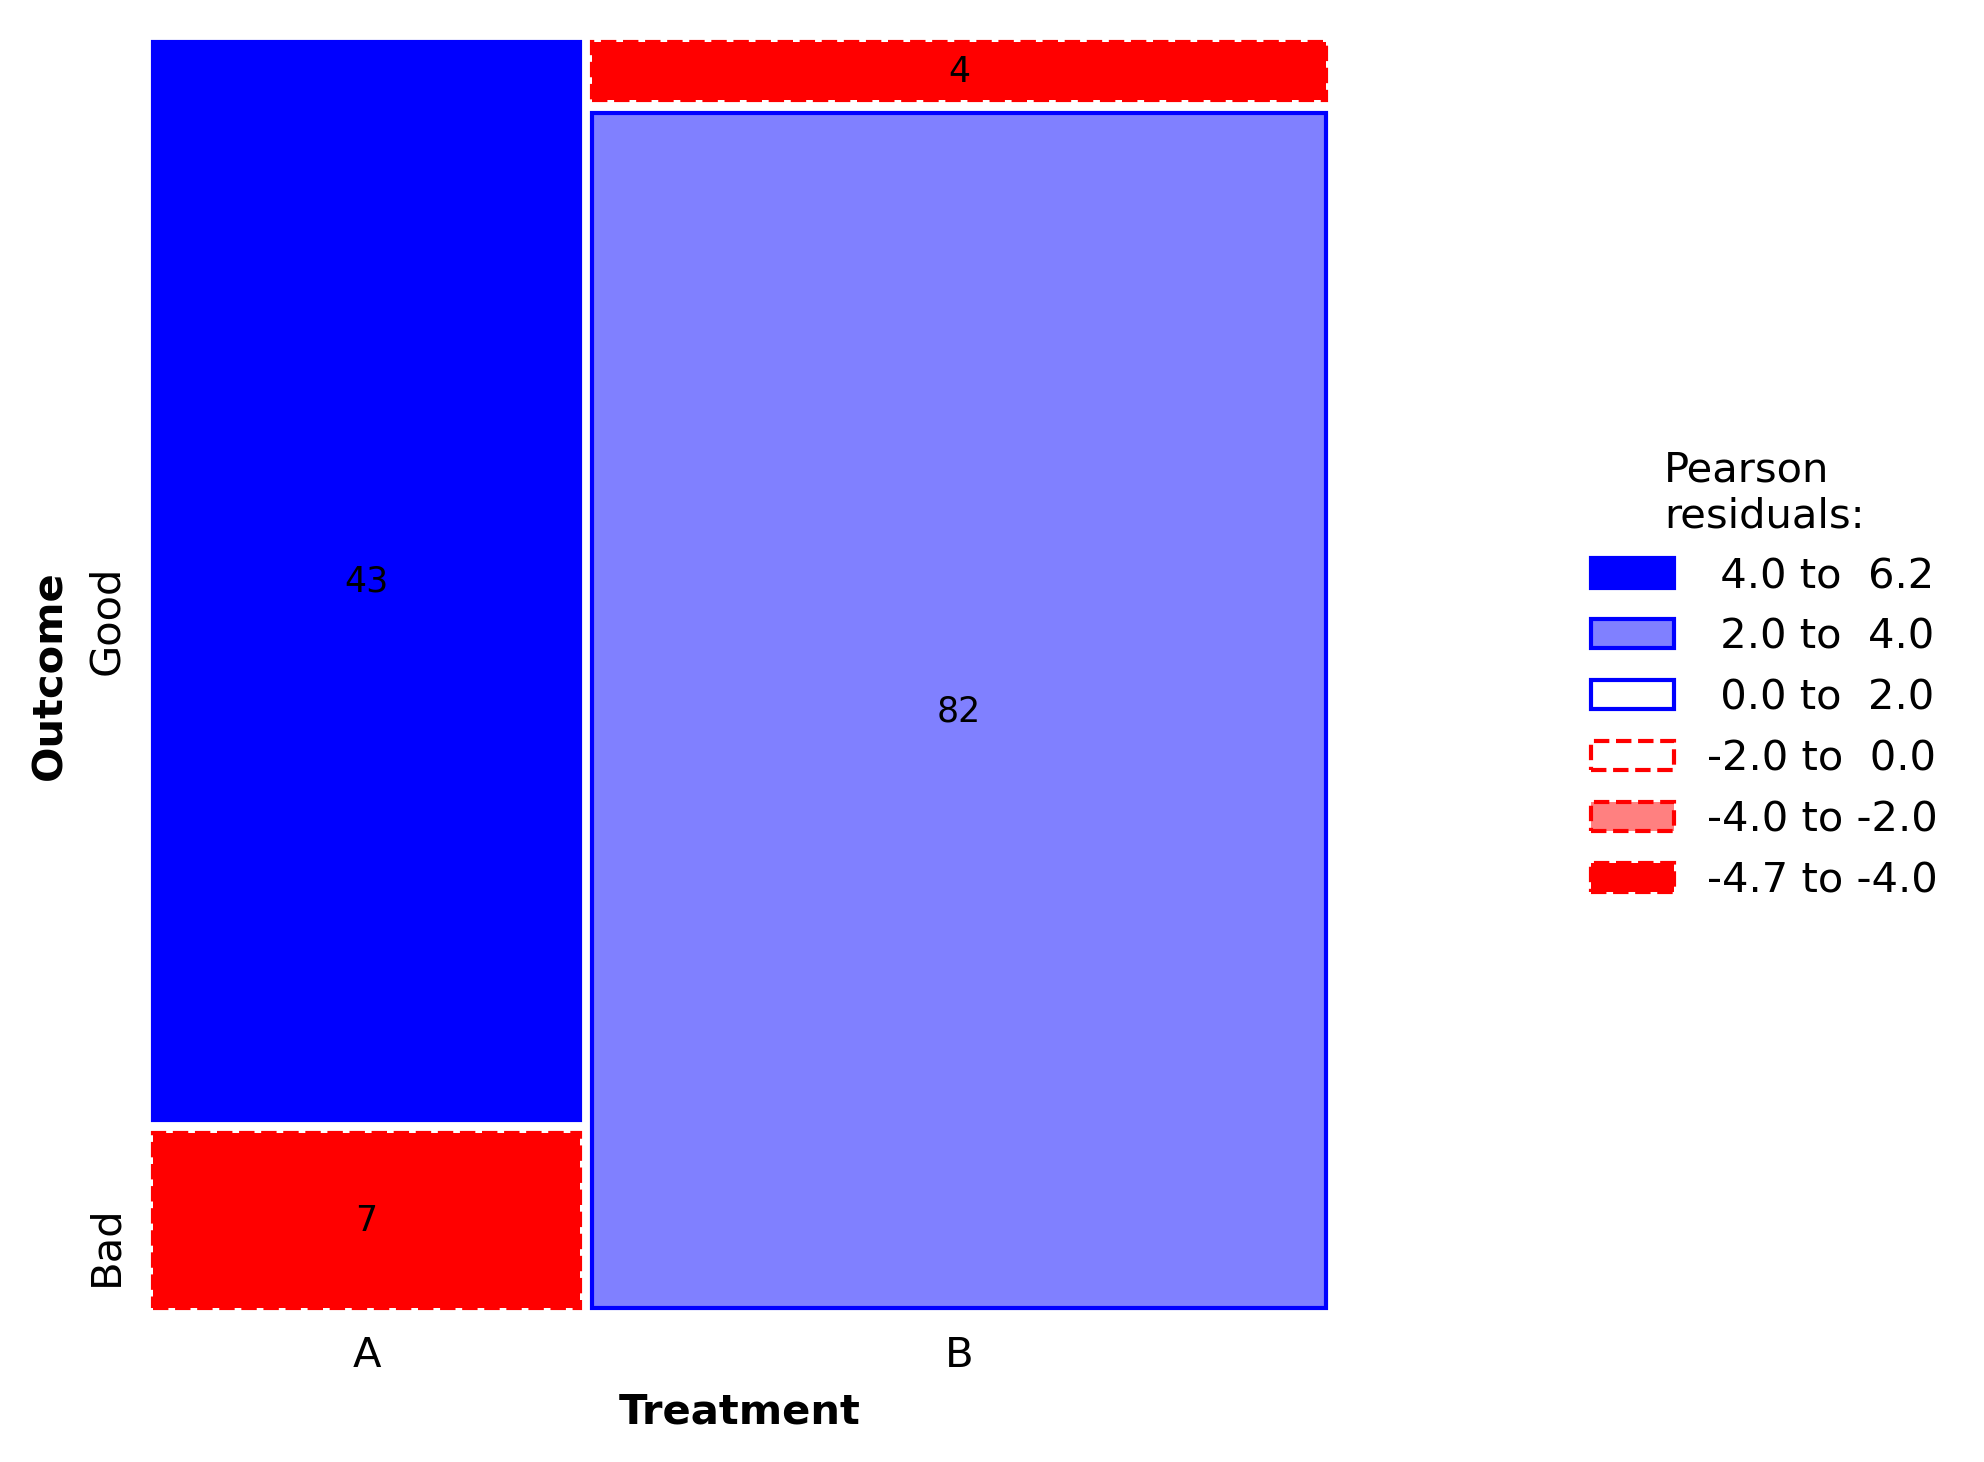
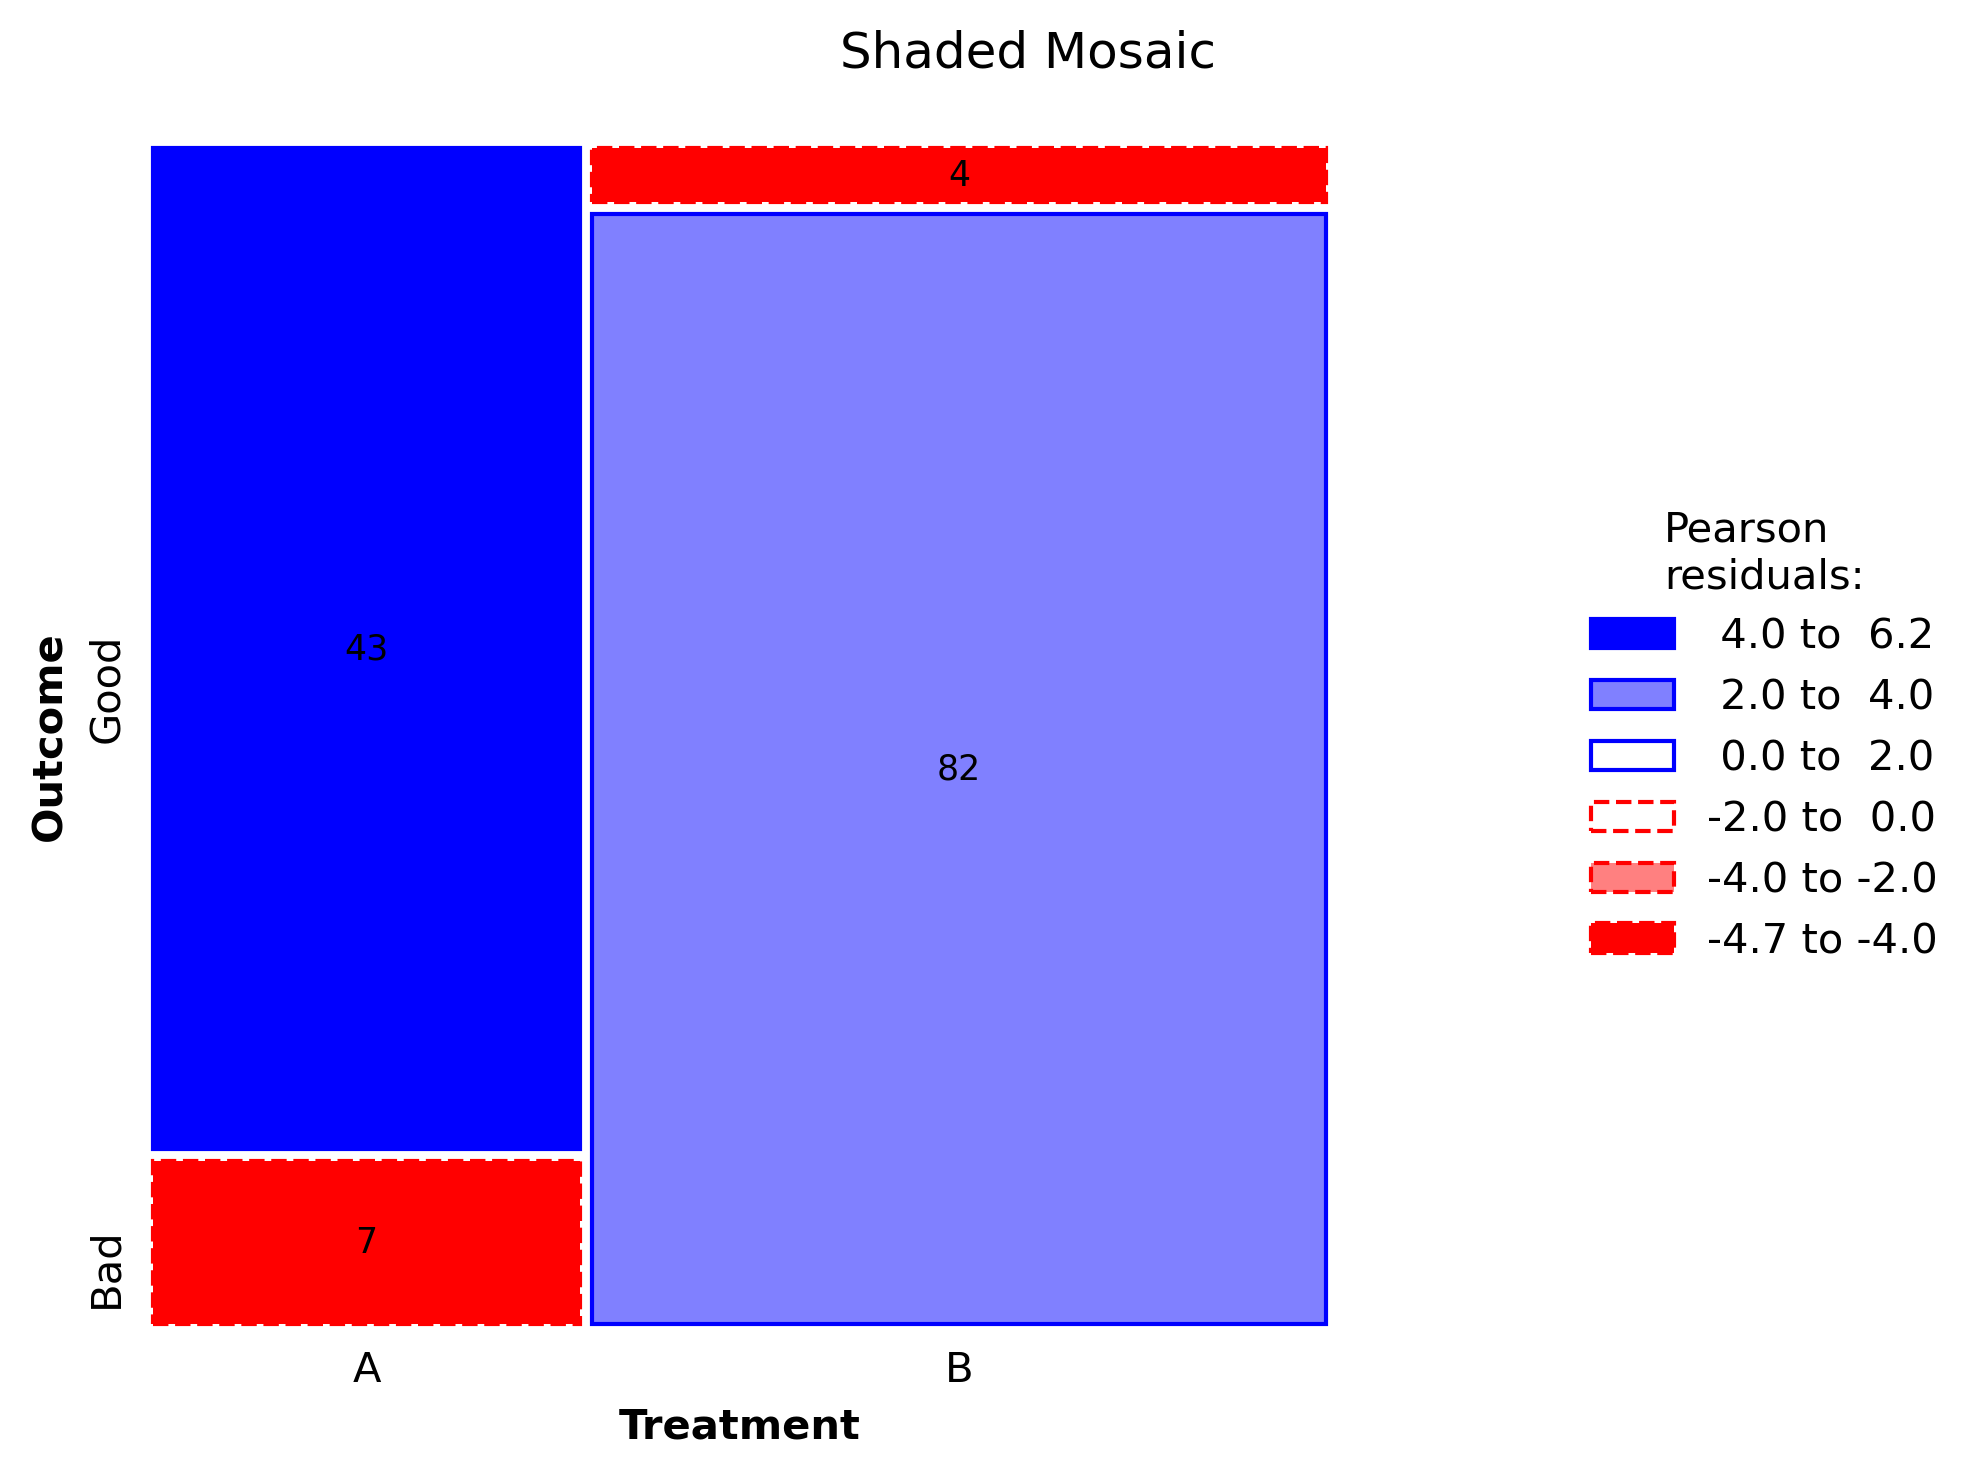
Remaining keyword arguments from
statsmodels.graphics.mosaicplot.mosaic
also work (with the exception of the properties argument, as this is
used to perform the shading). For example, here is how you may add a
title to the above plot:
mosaicshade.mosaic(
    df,
    freq='Freq',
    dims=['Treatment', 'Outcome'],
    title='Shaded Mosaic'
)
plt.show()
API
mosaicshade.mosaic(df, freq, dims=None, **kwargs)
Used to construct mosaic displays. An extension of
statsmodels.graphics.mosaicplot.mosaic
that implements residual-based shading.
Parameters:
df : pd.Dataframe
The data to plot.
freq : str
The frequency column of your DataFrame.
dims : list[str] or tuple[str, …], optional
Two to four dimensions (column names) to use for the mosaic. Defaults to all dimensions except the frequency column.
**kwargs
Any remaining keyword arguments passed to
statsmodels.graphics.mosaicplot.mosaic. Note that the properties argument is managed by mosaicshade and cannot be changed.
Returns:
fig : (matplotlib.figure.Figure)
The figure containing the mosaic plot.
ax : (matplotlib.axes.Axes)
The axes containing the mosaic plot.
Limitations
I am working to address these limitations in future versions. You are also welcome to contribute to help in this regard (see the Contributing section below).
- Data input to the
mosaicshade.mosaic()function must be of typepd.DataFrame - Residuals are currently calculated assuming a model of mutual independence
- No way to adjust shading limits (e.g., changing from magnitude 2-4 for light and 4+ for dark)
- Only labelling scheme added so far is
labeling_values - Limited to 2-4 dimensions (i.e., 5+ dimensions are untested and
currently blocked by the
mosaicfunction)
Contributing
Contributions, bug reports, and feature requests are welcome. Please open an issue or submit a pull request. Contributions addressing the above limitations are especially appreciated.
Citation
If you use MosaicShade, please cite the software using information found
in CITATION.cff or GitHub’s “Cite this repository”
menu.
References
Friendly, M. (1994). Mosaic Displays for Multi-Way Contingency Tables. Journal of the American Statistical Association, 89(425), 190–200. https://doi.org/10.1080/01621459.1994.10476460
Meyer, D., Zeileis, A., Hornik, K., & Friendly, M. (2024). vcd: Visualizing Categorical Data. R package version 1.4-13. https://doi.org/10.32614/CRAN.package.vcd
Zeileis, A., Meyer, D., & Hornik, K. (2007). Residual-based Shadings for Visualizing (Conditional) Independence. Journal of Computational and Graphical Statistics, 16(3), 507-525. https://doi.org/10.1198/106186007X237856
License
MosaicShade is licensed under the GNU General Public License version 3 (GPL-3.0-only). See LICENSE for details.
Project details
Verified details
These details have been verified by PyPIProject links
GitHub Statistics
Maintainers
Release history Release notifications | RSS feed


Download files
Download the file for your platform. If you're not sure which to choose, learn more about installing packages.
Source Distribution
Built Distribution
Filter files by name, interpreter, ABI, and platform.
If you're not sure about the file name format, learn more about wheel file names.
Copy a direct link to the current filters
File details
Details for the file mosaicshade-0.1.1.tar.gz.
File metadata
- Download URL: mosaicshade-0.1.1.tar.gz
- Upload date:
- Size: 21.4 kB
- Tags: Source
- Uploaded using Trusted Publishing? Yes
- Uploaded via: twine/6.1.0 CPython/3.13.12
File hashes
| Algorithm | Hash digest | |
|---|---|---|
| SHA256 |
4f2ed37a4547ef61509641ce6c2870ec11d6ef7005250abbe59d039fbb9a7e3d
|
|
| MD5 |
987b9dad6a1ff914046378641b69bbc8
|
|
| BLAKE2b-256 |
d613155a7d63859c98a2ec5b9ab05aed3f33cc386e75568f3f25430eca37bb76
|
Provenance
The following attestation bundles were made for mosaicshade-0.1.1.tar.gz:
Publisher:
publish.yml on gklorfine/mosaicshade
-
Statement:
-
Statement type:
https://in-toto.io/Statement/v1 -
Predicate type:
https://docs.pypi.org/attestations/publish/v1 -
Subject name:
mosaicshade-0.1.1.tar.gz -
Subject digest:
4f2ed37a4547ef61509641ce6c2870ec11d6ef7005250abbe59d039fbb9a7e3d - Sigstore transparency entry: 1821368818
- Sigstore integration time:
-
Permalink:
gklorfine/mosaicshade@bd61ee648b64657ea1045dbe2afb228e09b65055 -
Branch / Tag:
refs/tags/v0.1.1 - Owner: https://github.com/gklorfine
-
Access:
public
-
Token Issuer:
https://token.actions.githubusercontent.com -
Runner Environment:
github-hosted -
Publication workflow:
publish.yml@bd61ee648b64657ea1045dbe2afb228e09b65055 -
Trigger Event:
push
-
Statement type:
File details
Details for the file mosaicshade-0.1.1-py3-none-any.whl.
File metadata
- Download URL: mosaicshade-0.1.1-py3-none-any.whl
- Upload date:
- Size: 20.7 kB
- Tags: Python 3
- Uploaded using Trusted Publishing? Yes
- Uploaded via: twine/6.1.0 CPython/3.13.12
File hashes
| Algorithm | Hash digest | |
|---|---|---|
| SHA256 |
39c17d1ec4914cbfd62d2d45dbe25631bc2098aaf34f81e83c34145f78718d20
|
|
| MD5 |
392f8b7fe74256e444a5ab3db0d91f19
|
|
| BLAKE2b-256 |
6fdc9e526186758f63cec01fe911f26bfd634352b13655624c515d893f2cfc70
|
Provenance
The following attestation bundles were made for mosaicshade-0.1.1-py3-none-any.whl:
Publisher:
publish.yml on gklorfine/mosaicshade
-
Statement:
-
Statement type:
https://in-toto.io/Statement/v1 -
Predicate type:
https://docs.pypi.org/attestations/publish/v1 -
Subject name:
mosaicshade-0.1.1-py3-none-any.whl -
Subject digest:
39c17d1ec4914cbfd62d2d45dbe25631bc2098aaf34f81e83c34145f78718d20 - Sigstore transparency entry: 1821368904
- Sigstore integration time:
-
Permalink:
gklorfine/mosaicshade@bd61ee648b64657ea1045dbe2afb228e09b65055 -
Branch / Tag:
refs/tags/v0.1.1 - Owner: https://github.com/gklorfine
-
Access:
public
-
Token Issuer:
https://token.actions.githubusercontent.com -
Runner Environment:
github-hosted -
Publication workflow:
publish.yml@bd61ee648b64657ea1045dbe2afb228e09b65055 -
Trigger Event:
push
-
Statement type:






