A short description of your package

Project description
mpl fold axis
This module provides a function fold_axis to fold axis in matplotlib, which is also
called broken axis.
Unlike the example named Broken axis in matplotlib gallery and the brokenaxes package, this module use single axes to realize the broken axis, which is easier to use.
Installation
pip install mpl_fold_axis
Example
Now this module only support linear and log mode, user could use different mode to fold xaxis and yaxis in one axes.
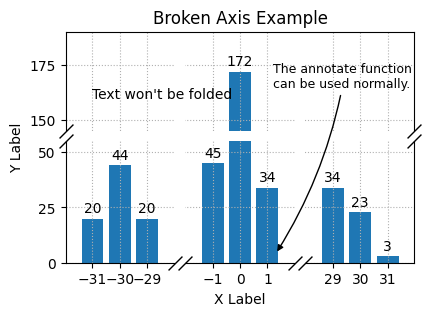
Linear broken axis
import numpy as np
import matplotlib.pyplot as plt

# What user need to do is only import the `fold_axis` function.
from mpl_fold_axis import fold_axis

# Generate data
np.random.seed(19680801)
x = [-31, -30, -29, -1, 0, 1, 29, 30, 31]
y = np.random.randint(0, 50, 9)
y[4] = 172

# Create the figure and the axis
fig, ax = plt.subplots(figsize=(4.5, 3.0))

# Call `Axes.bar` to plot the data
rects = ax.bar(x, y)
ax.bar_label(rects, fmt="%d", padding=2)

# Fold the lower xaxis
# scale (-28, -2) by factor 0.015
# scale (2, 28) by factor 0.015
fold_axis(ax, [(-28, -2, 0.015), (2, 28, 0.015)], axis="x", which="lower")

# Fold both yaxis (lower and upper)
# scale (55, 145) by factor 0.05
fold_axis(ax, [(55, 145, 0.05)], axis="y", which="both")

# Set the ticks and limits
ax.set_xticks(x)
ax.set_yticks([0, 25, 50, 150, 175])
ax.set_ylim(0, 190)

# Enable the grid
ax.grid(True, ls=":")

# Set the labels and title
ax.set_xlabel("X Label")
ax.set_ylabel("Y Label")
ax.set_title("Broken Axis Example")

# Add some text and annotations
ax.text(-31, 160, "Text won't be folded")
ax.annotate(
    "The annotate function \ncan be used normally.",
    fontsize=9,
    xy=(1.3, 4),
    xytext=(1.2, 165),
    arrowprops=dict(
        facecolor="black", connectionstyle="arc3,rad=-0.1", arrowstyle="-|>"
    ),
)

plt.show()
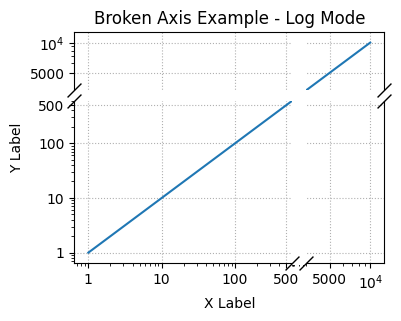
Log broken axis
import numpy as np
import matplotlib.pyplot as plt

# What user need to do is only import the `fold_axis` function.
from mpl_fold_axis import fold_axis

x = np.logspace(0, 4, 100)
y = x

fig, ax = plt.subplots(figsize=(4,3))

ax.plot(x, y)

fold_axis(ax, [(600, 4000, 0.1)], mode="log")
# return the lines and rectangles objects.
lines, rectangles = fold_axis(ax, [(600, 4000, 0.1)], axis='y', which='both', mode="log")

ax.set_xticks([1, 10, 100, 500, 5000, 10000],
              [1, 10, 100, 500, 5000, r'$10^4$'])
ax.set_yticks([1, 10, 100, 500, 5000, 10000],
              [1, 10, 100, 500, 5000, r'$10^4$'])


ax.grid(ls=':')
ax.set_xlabel("X Label")
ax.set_ylabel("Y Label")
ax.set_title("Broken Axis Example - Log Mode")

plt.show()
Dependencies
matplotlib>=3.6.0, <4.0.0
Changelog
-
2025-03-29: v0.1.1, increase height of the rectangle to mask minor ticks.
-
2025-03-29: v0.1.0, first release.
Release history Release notifications | RSS feed


Download files
Download the file for your platform. If you're not sure which to choose, learn more about installing packages.
Source Distribution
Built Distribution
Filter files by name, interpreter, ABI, and platform.
If you're not sure about the file name format, learn more about wheel file names.
Copy a direct link to the current filters
File details
Details for the file mpl_fold_axis-0.1.1.tar.gz.
File metadata
- Download URL: mpl_fold_axis-0.1.1.tar.gz
- Upload date:
- Size: 5.5 kB
- Tags: Source
- Uploaded using Trusted Publishing? No
- Uploaded via: twine/6.1.0 CPython/3.13.2
File hashes
| Algorithm | Hash digest | |
|---|---|---|
| SHA256 |
740c3f174263a03dd2e559748e919d11c278ffc7c3684dae680109247ad079da
|
|
| MD5 |
455e4047bcb3ab398714ff9de288f2b2
|
|
| BLAKE2b-256 |
8a119b9ca81992729b5b06bab5998ac3b50aaf9a61fa8f28edaece2bede02b29
|
File details
Details for the file mpl_fold_axis-0.1.1-py3-none-any.whl.
File metadata
- Download URL: mpl_fold_axis-0.1.1-py3-none-any.whl
- Upload date:
- Size: 6.5 kB
- Tags: Python 3
- Uploaded using Trusted Publishing? No
- Uploaded via: twine/6.1.0 CPython/3.13.2
File hashes
| Algorithm | Hash digest | |
|---|---|---|
| SHA256 |
1b9e5c95d57487053c22999c683b1251cb11238dfd7aca1c93e44064e8bc3eef
|
|
| MD5 |
fa0baebfe7c6c3d47a3d8ede350f2973
|
|
| BLAKE2b-256 |
b07a9f4c00d98489f6a5ed6592d1cb9f81a9e4f368915c07eccd19f9bf747ab1
|


