
mpl-smithchart

This project is forked from pySmithPlot.
It adds/fixes the following:
- CI/CD to facillitate package maintenance
- addresses matplotlib deprecation warnings
- updates numpy to newer version
- fixes legend plotting
- adds some automated testing of features
- adds version lock file to show known-good build
Below this line is the old README.
New Release of Version 0.2
After 2 years of getting dusty pySmithPlot now got some new features and bug fixes. Here is a short changelog:
- Support for Python 3
- improved grid generation algorithm
- plot() now also handles also single numbers and purely real data
- plot() can now interpolate lines between points or generate an equidistant spacing
- changed handling of input data and renormalization; now the actual datatype (S,Z,Y-Parameter) can be specified when calling plot()
- changed behaviour for normalization and placement of the label
- added some parameter checks
- removed default
matplotlibsettings - renamed some parameters to improve consistency
- fixed issues with Unicode symbols
- fixed issues with grid generation
- fixed issues with axis label display and placement
There are still some plans for the future and they hopefully don't take another two years:
- support for Admittance Charts
- support for
contour()plots - zoom and 'cut out' function
- special handling of other
matplotlib.patchobjects like arrows - ...
Features
pySmithPlot is a matplotlib extension providing a projection class for creating high quality Smith Charts with Python. The generated plots blend seamless into matplotlib's style and support almost the full range of customization options.
This Library allows the fully automatic generation of Smith Charts with various customizable parameters and well selected default values. It also provides the following modifications and extensions:
- circle shaped drawing area with labels placed around
- plot() accepts real and complex numbers as well as numpy.ndarray's
- lines can be automatically interpolated to improve the optical appearance
- data ranges can be interpolated to an equidistant spacing
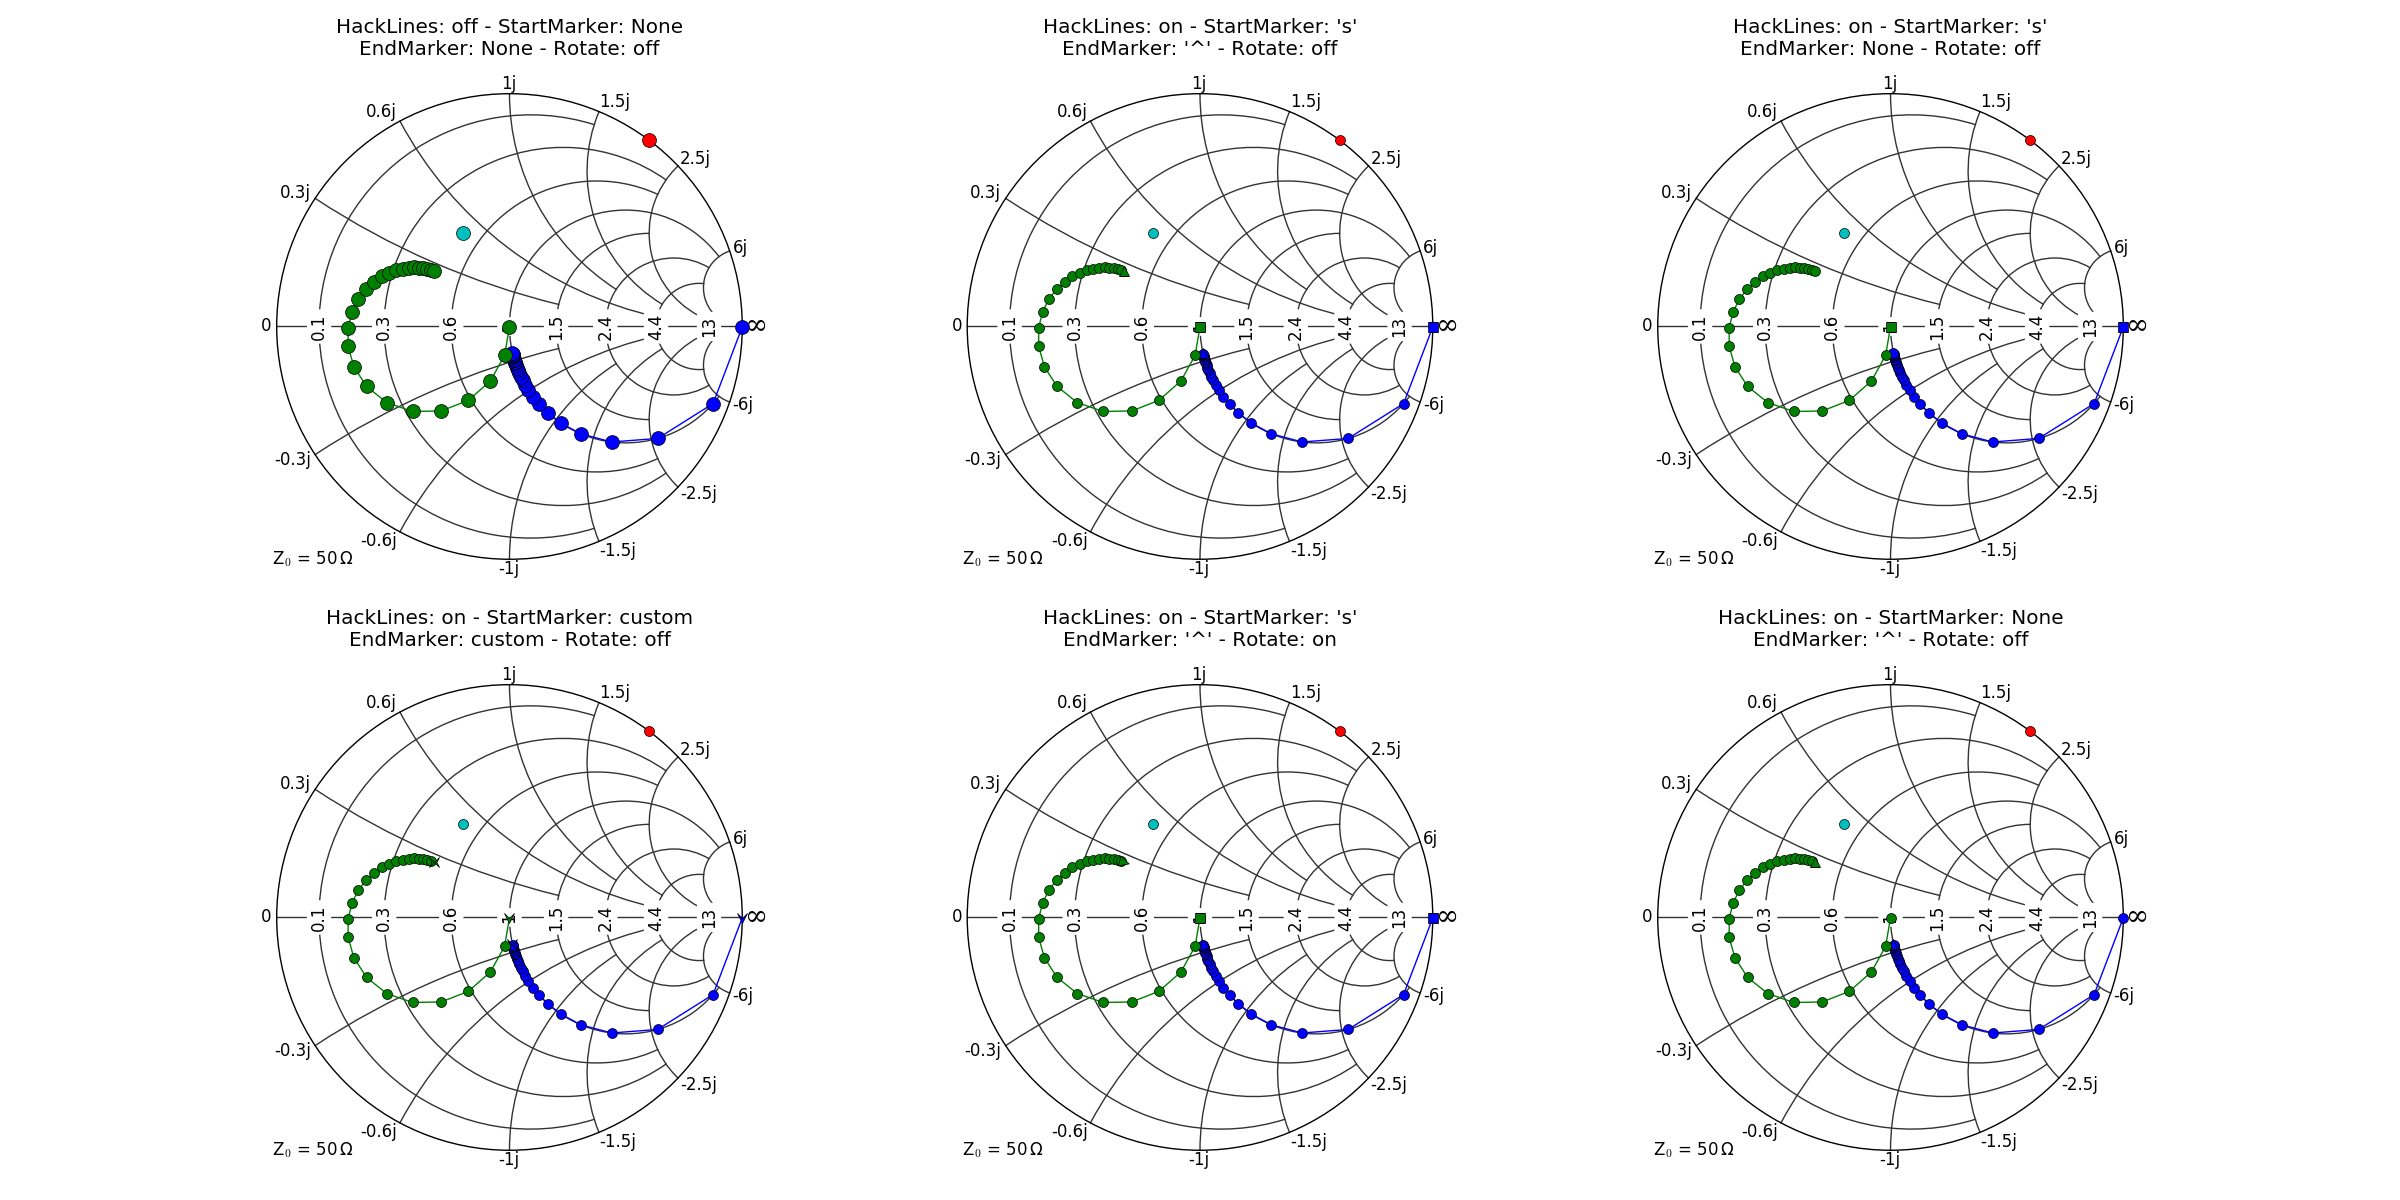
- start/end markers of lines can be modified and rotate tangential
- gridlines are 3-point arcs to improve space efficiency of exported plots
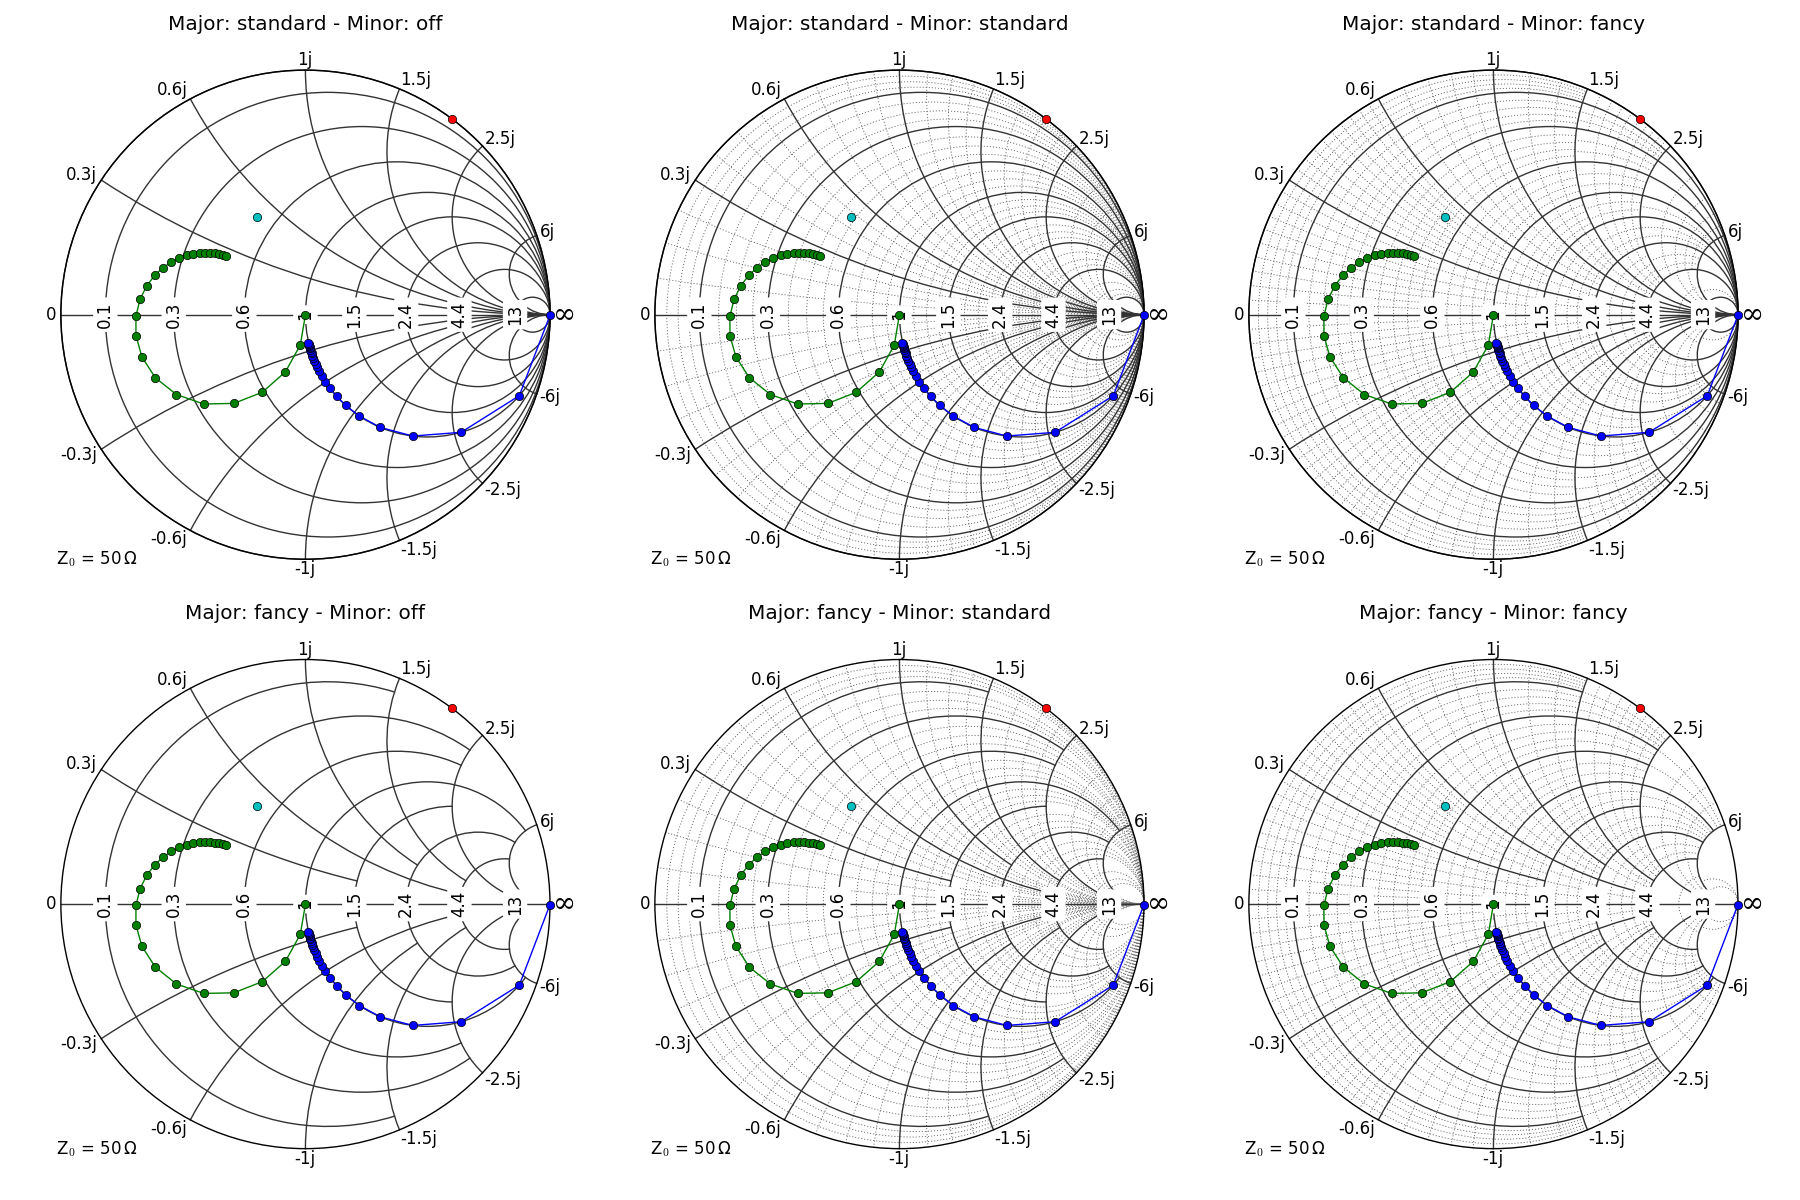
- 'fancy' option for adaptive grid generation
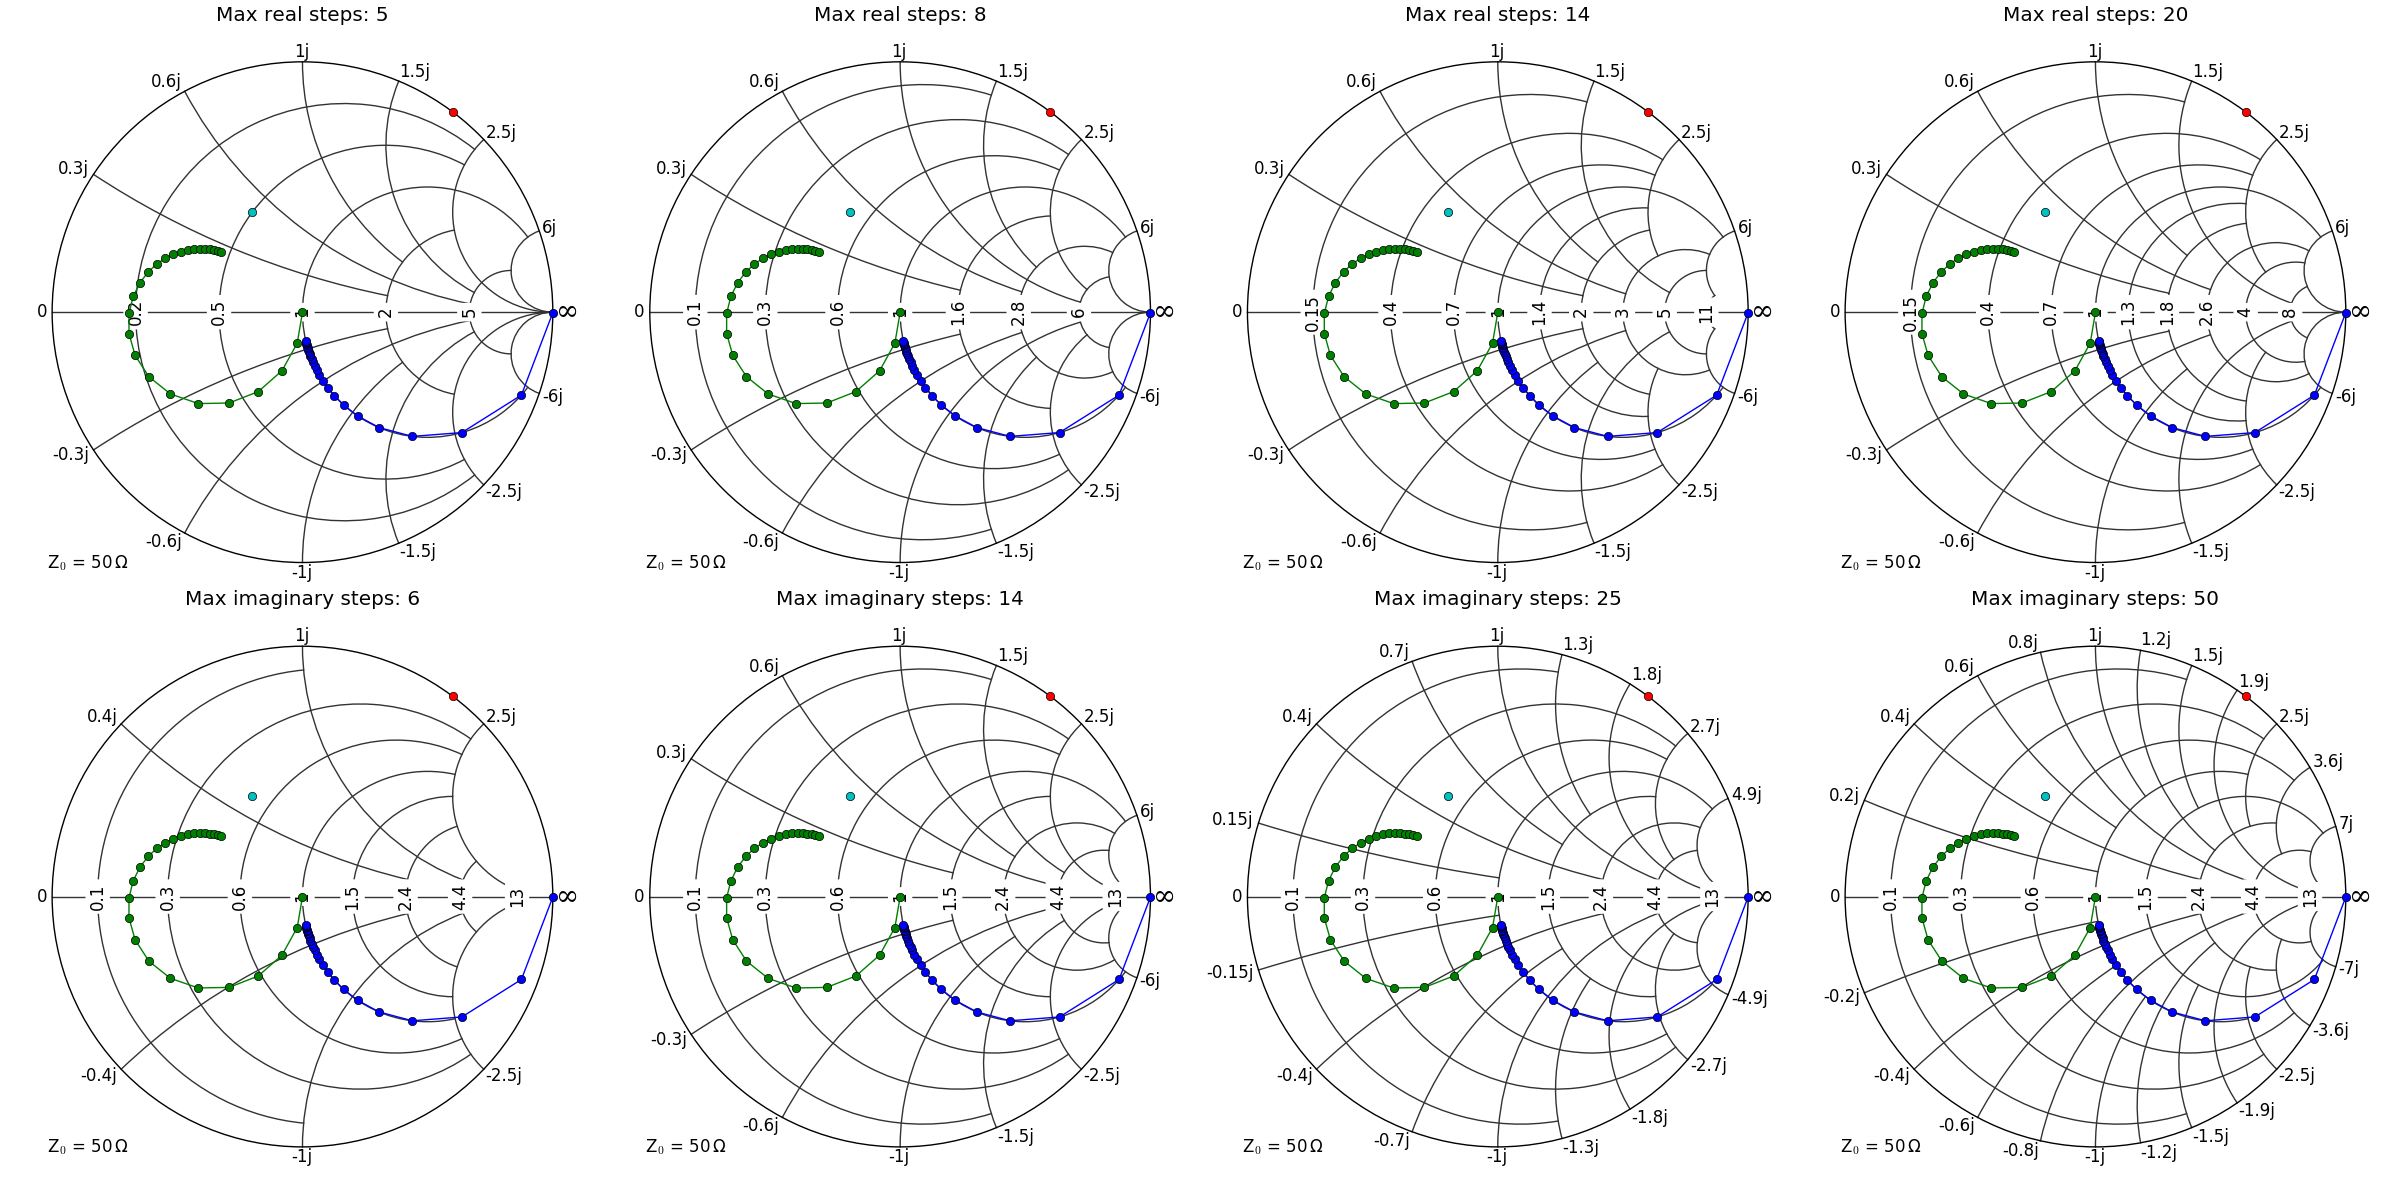
- own tick locators for nice axis labels
For making a Smith Chart plot, it is sufficient to import smithplot and create a new subplot with projection set to 'smith'. (Requires matplotlib version 1.2)
A short example can be found in the testbenches directory and started with:
python3 smith_short_test.py
For more details and documentation, take a look into smithplot/smithaxes.py.
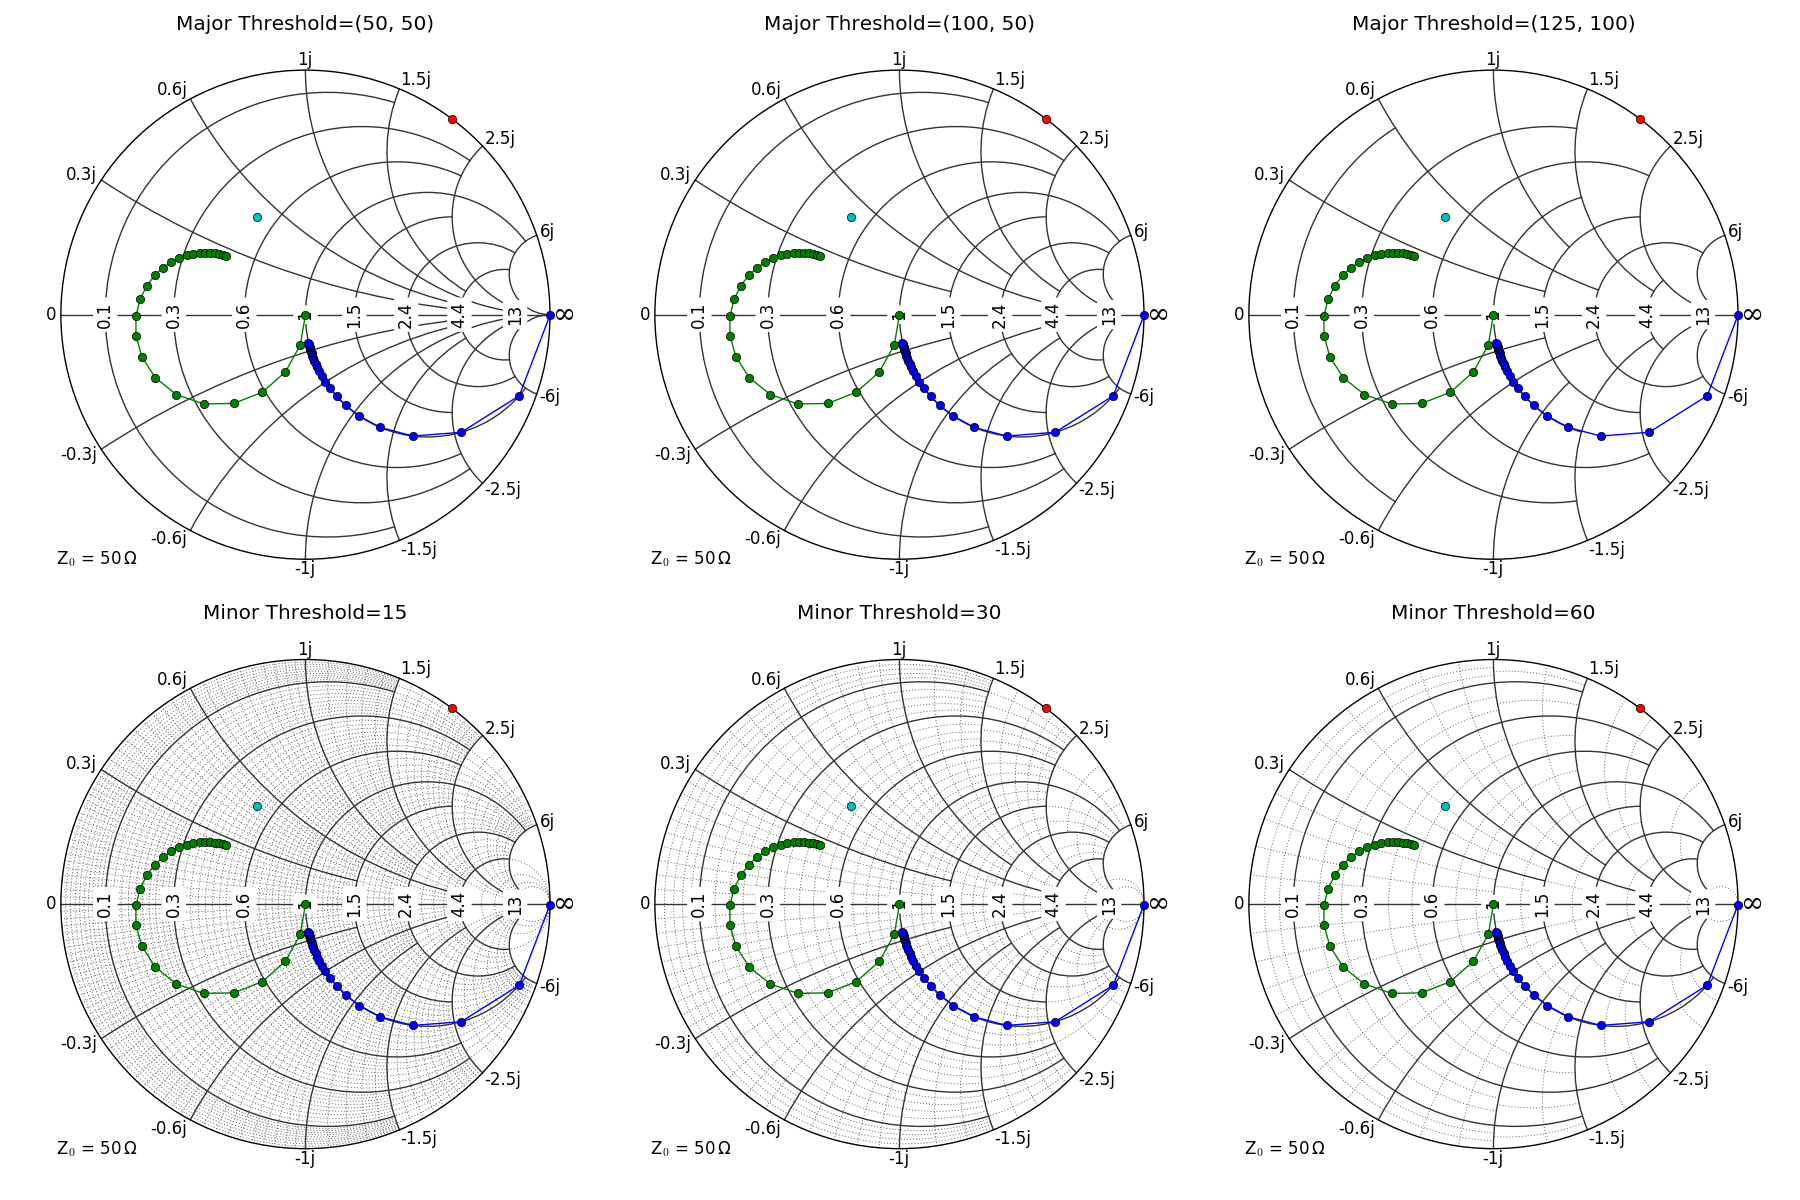
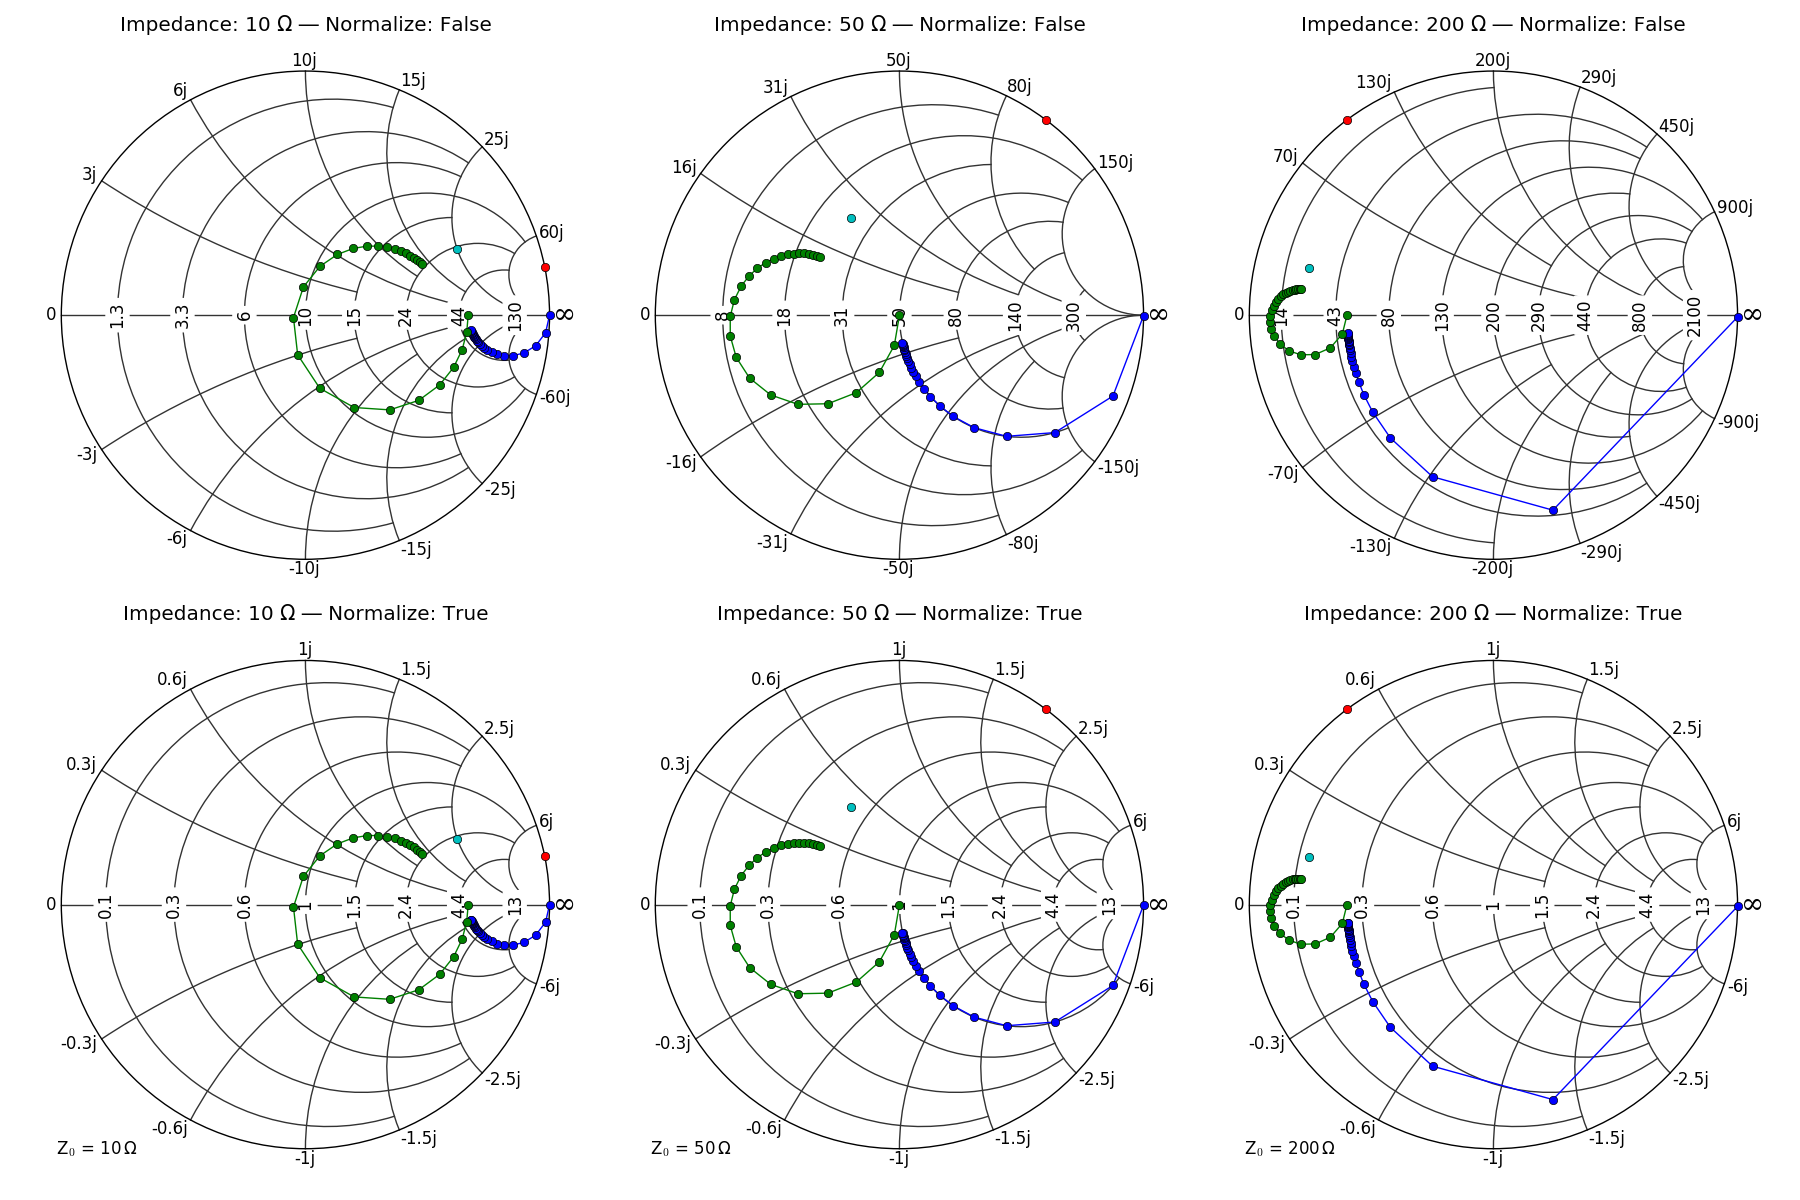
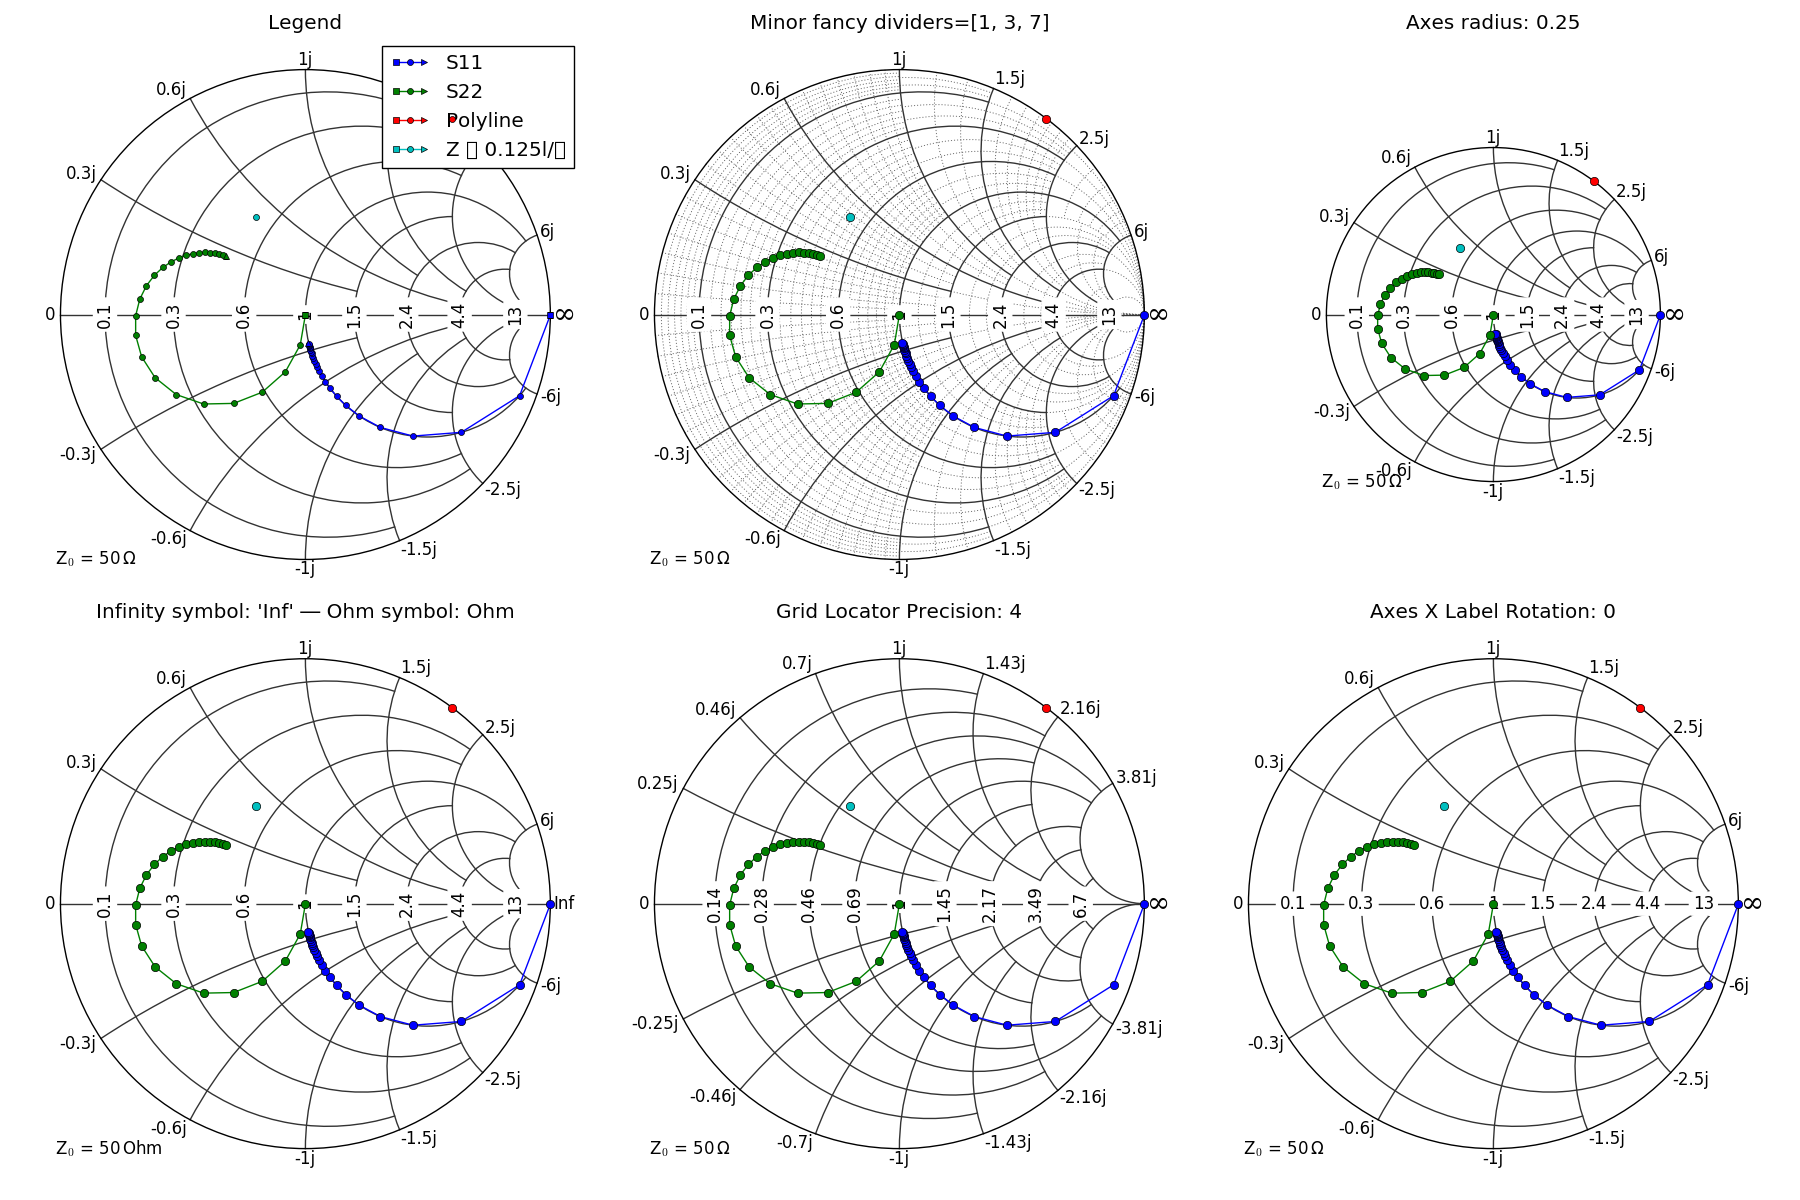
testbenches/smith_full_test.py runs various testbenches and gives a comparison for almost all parameters. These are the generated sample plots:

1 maintainer

Metadata
1 maintainer
Release files for mpl-smithchart 0.1.2
For a detailed explanation of source distributions (sdists) and built distributions (wheels), please see the package formats documentation.
Source distribution (sdist)
| File | Size | Uploaded | |
|---|---|---|---|
| mpl-smithchart-0.1.2.tar.gz | 54.0 kB | Details |
Built distribution (wheel)
| File | Interpreter | ABI | Platform | Reset |
|---|---|---|---|---|
| mpl_smithchart-0.1.2-py3-none-any.whl | Python 3 | none | any | Details |
Total release size: 73.6 kB
Release files / mpl-smithchart-0.1.2.tar.gz
| Download URL | mpl-smithchart-0.1.2.tar.gz |
|---|---|
| Size | 54.0 kB |
| Tags | Source |
|
SHA-256 checksum How to use checksums |
a2c6786c7552cb83dda437947d36f085675f8b75d546f2727ef27e9e9f28e3c2
|
|
BLAKE2b-256 checksum How to use checksums |
169cec153fbe1500f724ad28a6bb7ece1698358bcc811934fb62a627fd2e9aec
|
| Upload date | |
|
Uploaded using Trusted Publishing? What is trusted publishing? |
No |
| Uploaded via |
pdm/2.5.5 CPython/3.10.11
|
Release files / mpl_smithchart-0.1.2-py3-none-any.whl
| Download URL | mpl_smithchart-0.1.2-py3-none-any.whl |
|---|---|
| Size | 19.6 kB |
| Tags | Python 3 |
|
SHA-256 checksum How to use checksums |
227c3af144e729cc51cbf7aa4659cab2e4c1302ed808b197b80fbafa43020f73
|
|
BLAKE2b-256 checksum How to use checksums |
1cad96b959bf7786708dbd1e9aa6c3993f8c684d5d8f5356aec6120597fa1fbe
|
| Upload date | |
|
Uploaded using Trusted Publishing? What is trusted publishing? |
No |
| Uploaded via |
pdm/2.5.5 CPython/3.10.11
|














