Interactive tools for Matplotlib
Verified details
These details have been verified by PyPIProject links
GitHub Statistics
Maintainers


Project description


Mpltoolbox
About
Mpltoolbox aims to provide some basic tools (that other libraries such as bokeh or plotly support) for drawing points, lines, rectangles, polygons on Matplotlib figures.
There are many interactive examples in the Matplotlib documentation pages, but the code snippets are often long and potentially not straightforward to maintain.
With mpltoolbox, activating these tools should (hopefully) just be a one-liner.
Installation
python -m pip install mpltoolbox
Examples
import matplotlib.pyplot as plt
import mpltoolbox as tbx
%matplotlib widget
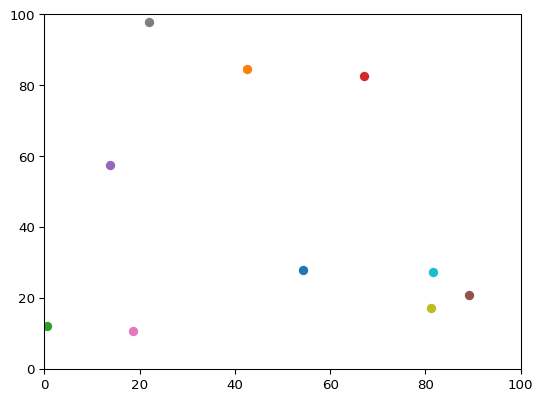
Points
fig, ax = plt.subplots()
ax.set_xlim(0, 100)
ax.set_ylim(0, 100)

points = tbx.Points(ax=ax)
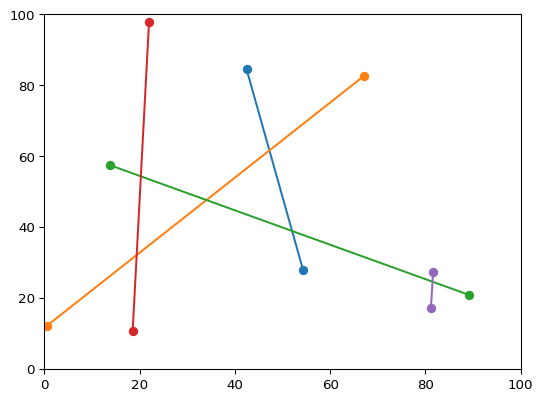
Lines
fig, ax = plt.subplots()
ax.set_xlim(0, 100)
ax.set_ylim(0, 100)

lines = tbx.Lines(ax=ax, n=2)
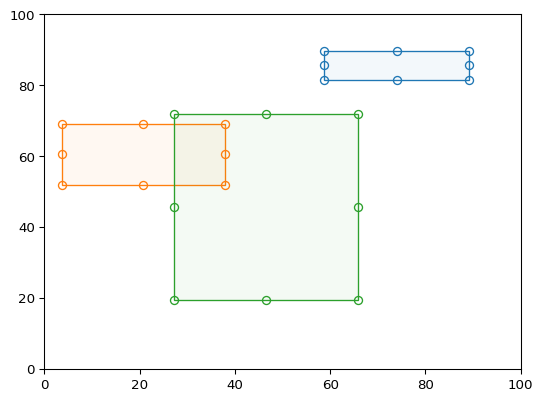
Rectangles
fig, ax = plt.subplots()
ax.set_xlim(0, 100)
ax.set_ylim(0, 100)

rectangles = tbx.Rectangles(ax=ax)
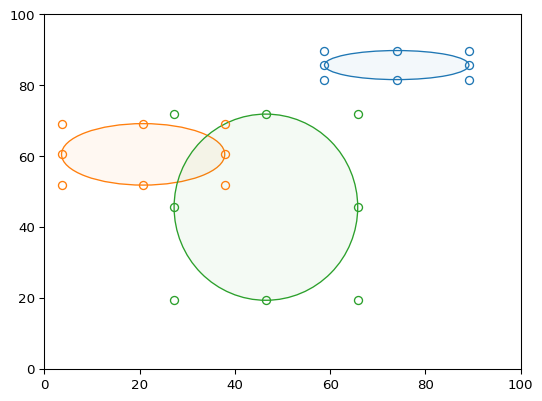
Ellipses
fig, ax = plt.subplots()
ax.set_xlim(0, 100)
ax.set_ylim(0, 100)

ellipses = tbx.Ellipses(ax=ax)
Project details
Verified details
These details have been verified by PyPIProject links
GitHub Statistics
Maintainers
Release history Release notifications | RSS feed


Download files
Download the file for your platform. If you're not sure which to choose, learn more about installing packages.
Source Distribution
Built Distribution
Filter files by name, interpreter, ABI, and platform.
If you're not sure about the file name format, learn more about wheel file names.
Copy a direct link to the current filters
File details
Details for the file mpltoolbox-26.2.0.tar.gz.
File metadata
- Download URL: mpltoolbox-26.2.0.tar.gz
- Upload date:
- Size: 317.7 kB
- Tags: Source
- Uploaded using Trusted Publishing? Yes
- Uploaded via: twine/6.1.0 CPython/3.12.8
File hashes
| Algorithm | Hash digest | |
|---|---|---|
| SHA256 |
b8a600b35f1efe67a9ae4004cf75e15a33a2c281b12dbb55d155191f834aac1f
|
|
| MD5 |
7f2ac8692dc60fadad1c24295cb6f20d
|
|
| BLAKE2b-256 |
517066304fa8bb9df07e1c5083f9ec96bfb56160fa7f420a4660b548575f1cc6
|
Provenance
The following attestation bundles were made for mpltoolbox-26.2.0.tar.gz:
Publisher:
release.yml on scipp/mpltoolbox
-
Statement:
-
Statement type:
https://in-toto.io/Statement/v1 -
Predicate type:
https://docs.pypi.org/attestations/publish/v1 -
Subject name:
mpltoolbox-26.2.0.tar.gz -
Subject digest:
b8a600b35f1efe67a9ae4004cf75e15a33a2c281b12dbb55d155191f834aac1f - Sigstore transparency entry: 956990287
- Sigstore integration time:
-
Permalink:
scipp/mpltoolbox@d764bc6c2595d5ebe241e77adf7d57233bdab76c -
Branch / Tag:
refs/tags/26.2.0 - Owner: https://github.com/scipp
-
Access:
public
-
Token Issuer:
https://token.actions.githubusercontent.com -
Runner Environment:
github-hosted -
Publication workflow:
release.yml@d764bc6c2595d5ebe241e77adf7d57233bdab76c -
Trigger Event:
release
-
Statement type:
File details
Details for the file mpltoolbox-26.2.0-py3-none-any.whl.
File metadata
- Download URL: mpltoolbox-26.2.0-py3-none-any.whl
- Upload date:
- Size: 21.0 kB
- Tags: Python 3
- Uploaded using Trusted Publishing? Yes
- Uploaded via: twine/6.1.0 CPython/3.12.8
File hashes
| Algorithm | Hash digest | |
|---|---|---|
| SHA256 |
cd2668db4216fc4d7c2ba37974961aa61445f1517527b645b6082930e35ba7f0
|
|
| MD5 |
4541b2eeb9e32804e8b8ec9f9149adcc
|
|
| BLAKE2b-256 |
12aafb2a0649fdeef5ab7072d221e8f4df164098792c813af6c87e2581cfa860
|
Provenance
The following attestation bundles were made for mpltoolbox-26.2.0-py3-none-any.whl:
Publisher:
release.yml on scipp/mpltoolbox
-
Statement:
-
Statement type:
https://in-toto.io/Statement/v1 -
Predicate type:
https://docs.pypi.org/attestations/publish/v1 -
Subject name:
mpltoolbox-26.2.0-py3-none-any.whl -
Subject digest:
cd2668db4216fc4d7c2ba37974961aa61445f1517527b645b6082930e35ba7f0 - Sigstore transparency entry: 956990319
- Sigstore integration time:
-
Permalink:
scipp/mpltoolbox@d764bc6c2595d5ebe241e77adf7d57233bdab76c -
Branch / Tag:
refs/tags/26.2.0 - Owner: https://github.com/scipp
-
Access:
public
-
Token Issuer:
https://token.actions.githubusercontent.com -
Runner Environment:
github-hosted -
Publication workflow:
release.yml@d764bc6c2595d5ebe241e77adf7d57233bdab76c -
Trigger Event:
release
-
Statement type:


