Analyze XPS report files generated by Mastersizer 2000

Project description
msanalyzer
Analyze XPS report files generated by Mastersizer 2000.
Aplicativo web (PT-BR)
O msanalyzer possui uma versão mais simples em formato de aplicativo web. Deste modo, é extremamente fácil usar o programa.
Basta acessar o site msanalyzer.netlify.app e utilizar! Não é necessário nenhum tipo de instalação.
Qualquer dúvida sobre a utilização do site, por favor, entre em contato.
Interface gráfica (PT-BR)
Para usar a interface gráfica, baixe o arquivo msanalyzer_gui_win64.zip disponível na página de releases e descompacte-o.
Dentro da pasta descompactada, haverá um arquivo chamado msanalyzer_gui.exe. Execute-o para iniciar o programa.
Obs: Ao abrir o executável pela primeira vez, pode ser que o programa demore para iniciar. Isto é normal: o interpretador do Python precisa ser descompactado; este procedimento não deve demorar mais que 20 segundos. Apenas espere e não se preocupe :)
Qualquer dúvida sobre a utilização do programa, sugestões de melhoria ou desejo de colaborar com o código, sinta-se a vontade para entrar em contato!
Seleção e visualização de modelos
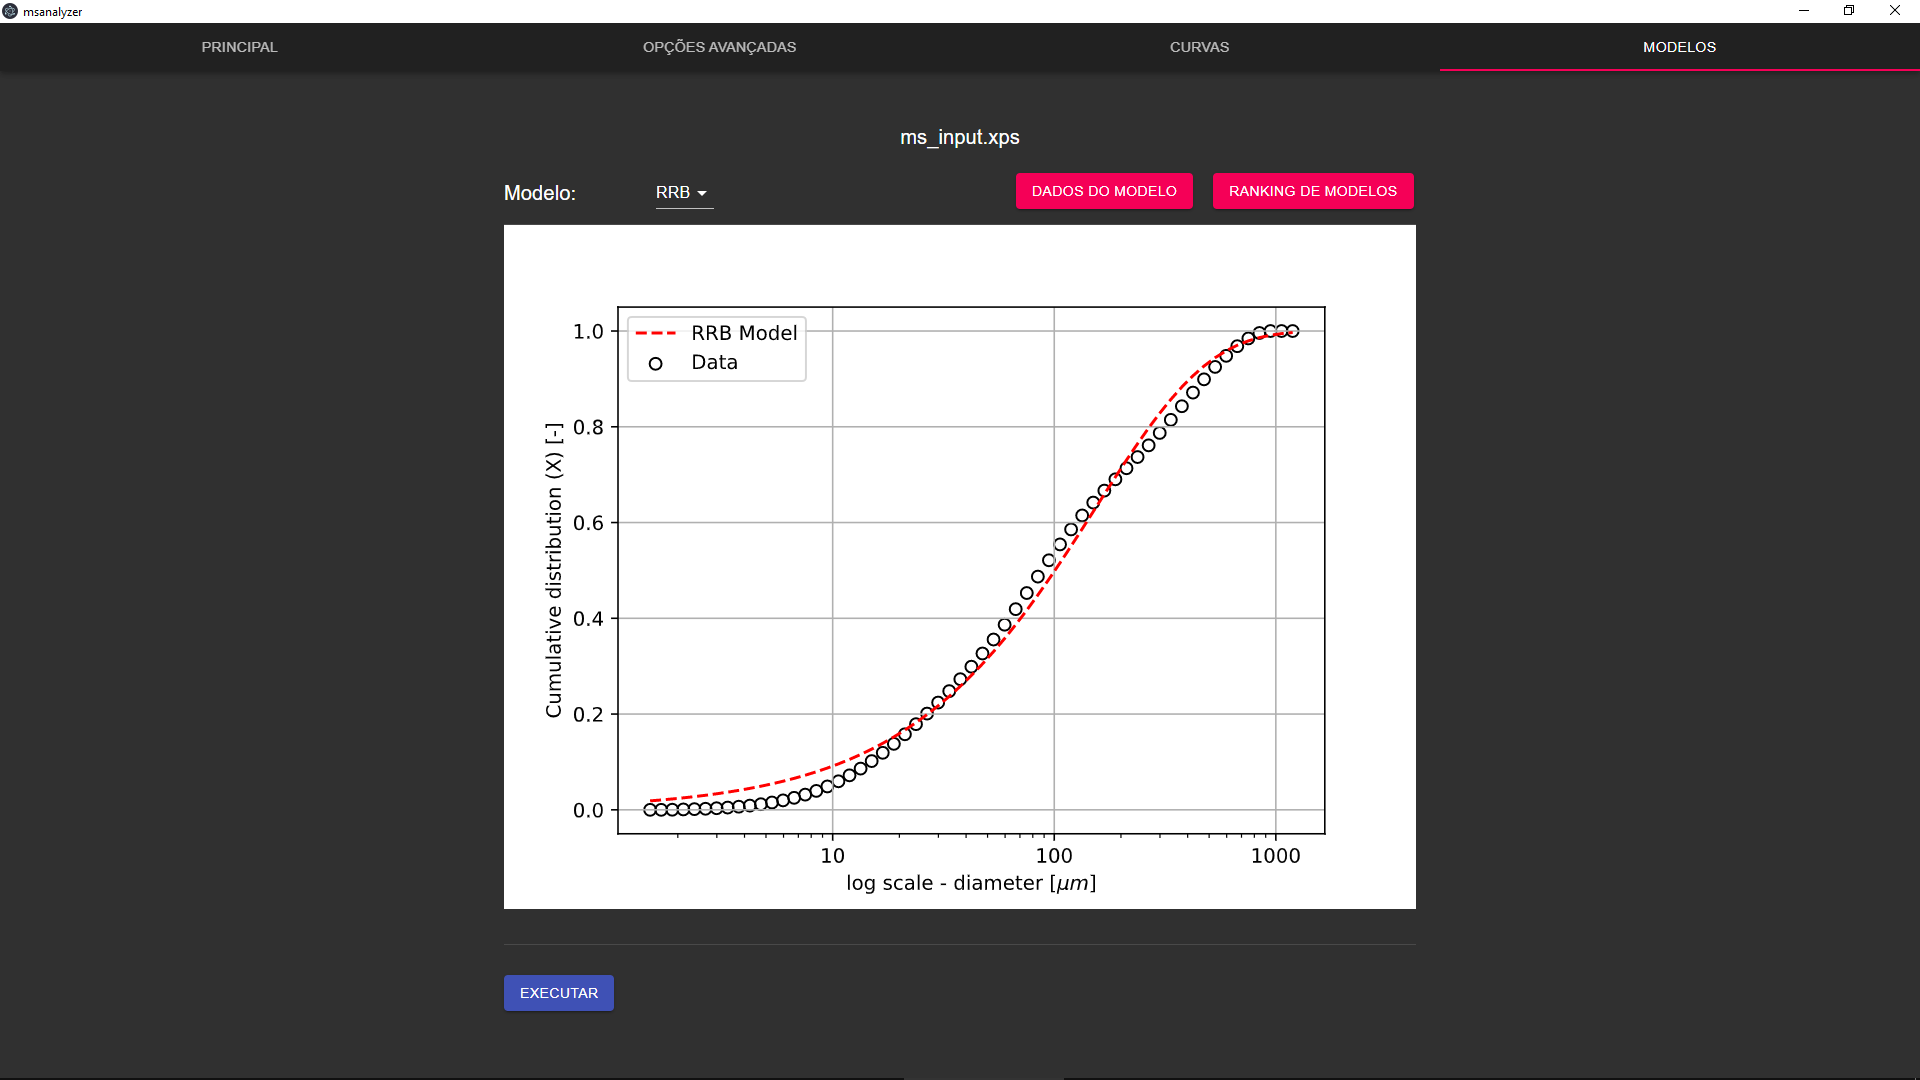
Gráfico de um único arquivo
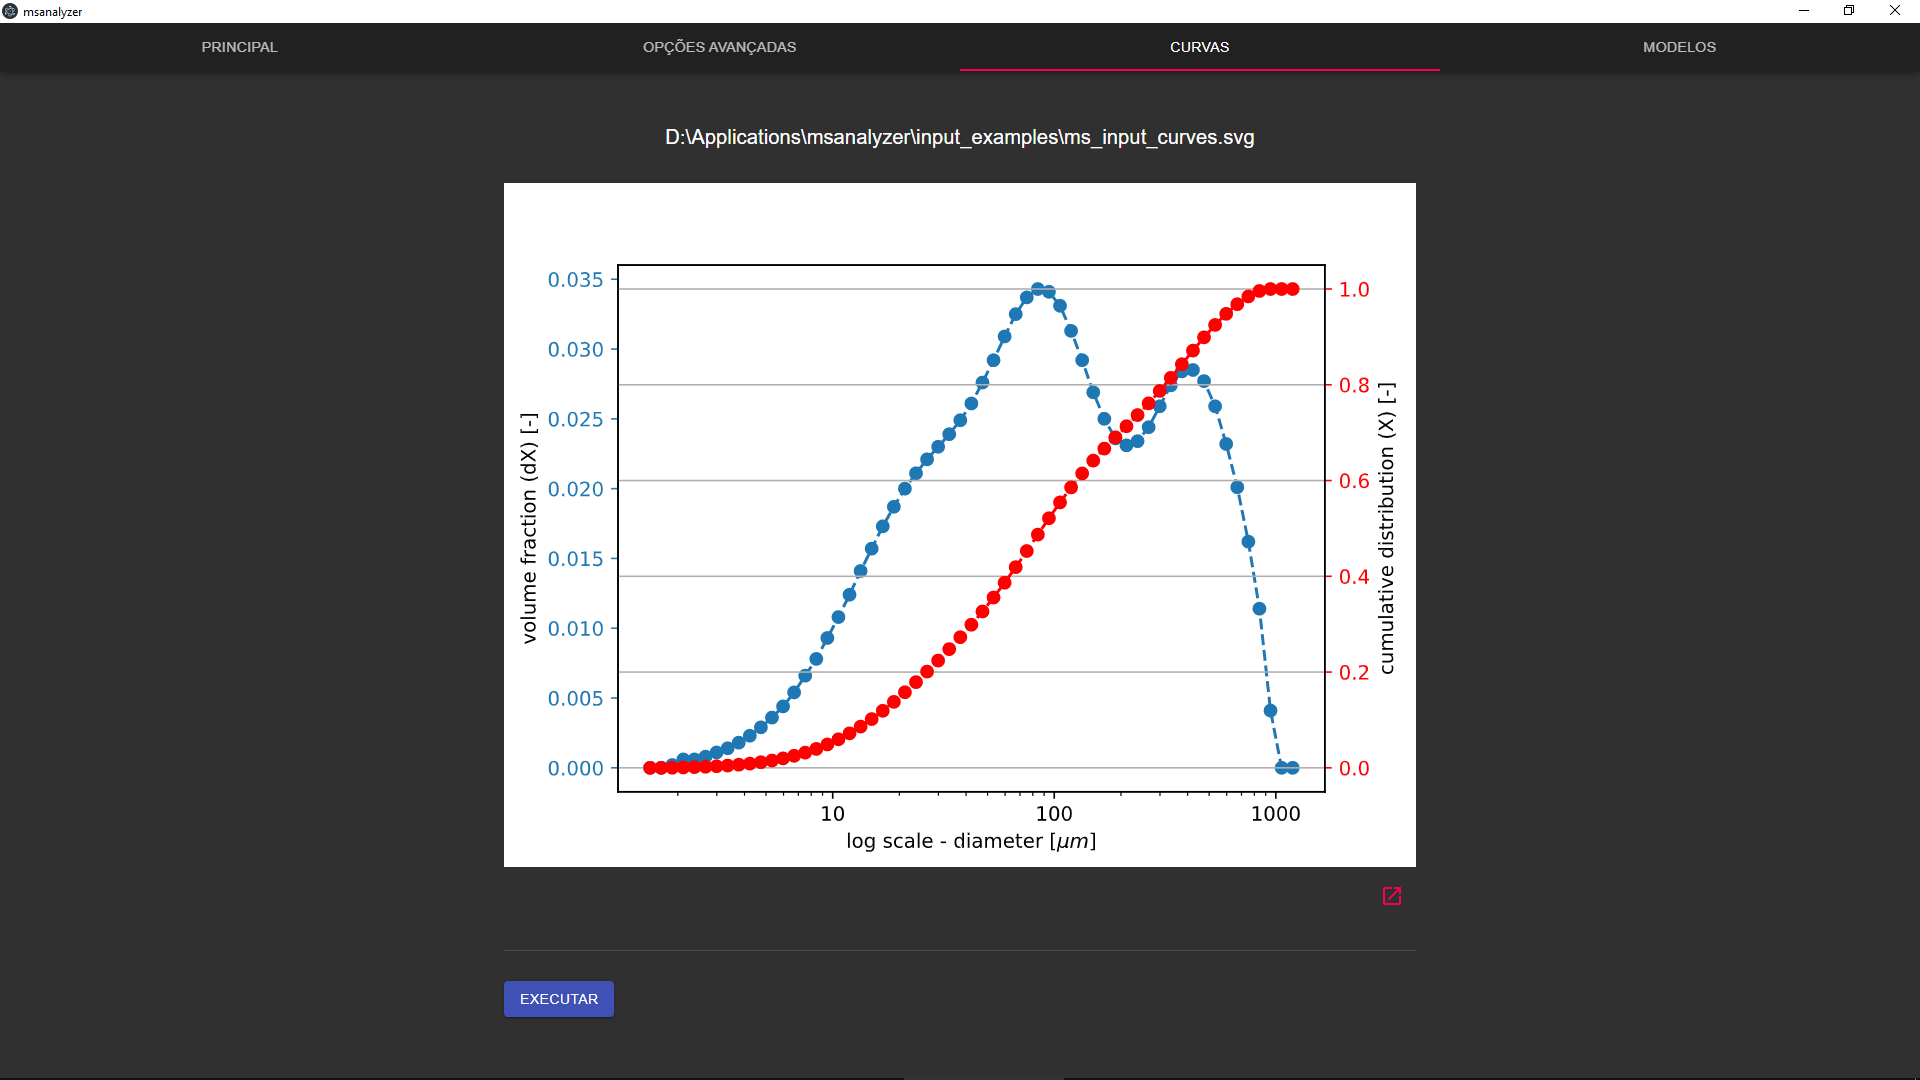
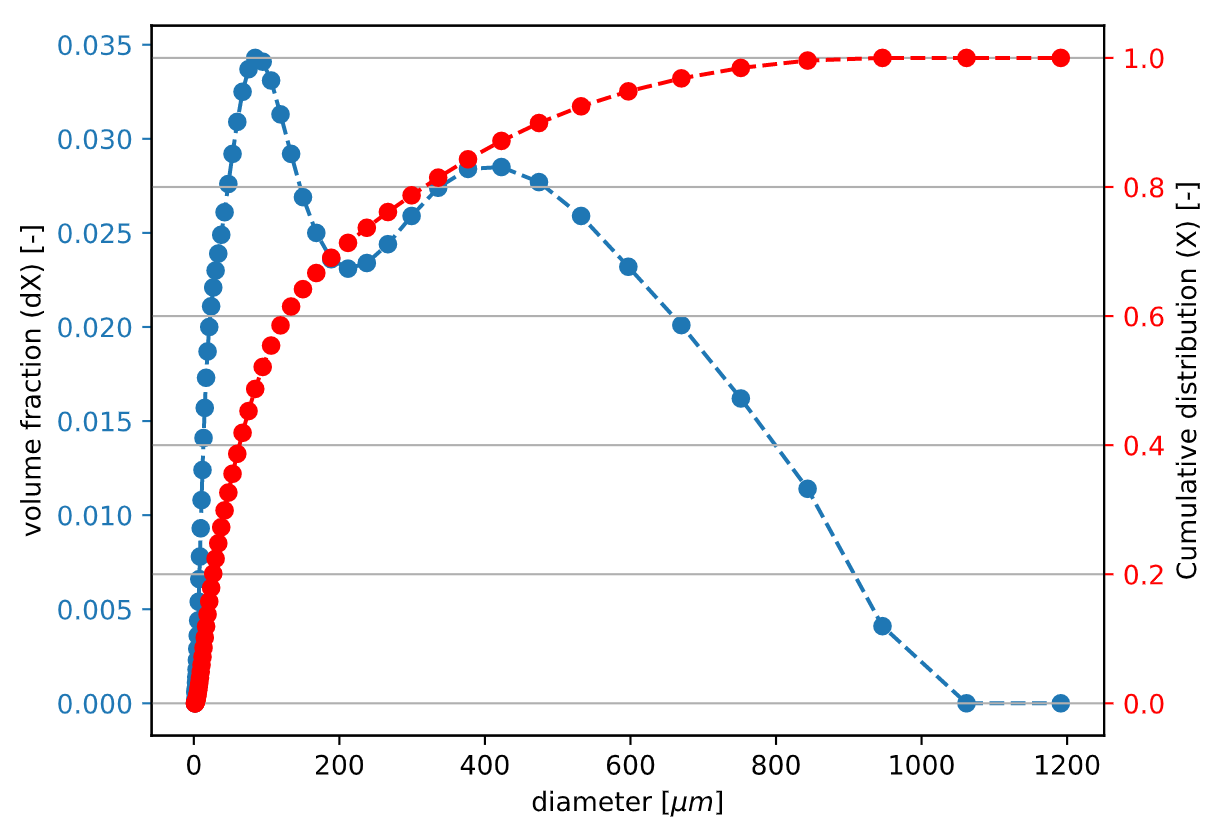
Gráfico de vários arquivos

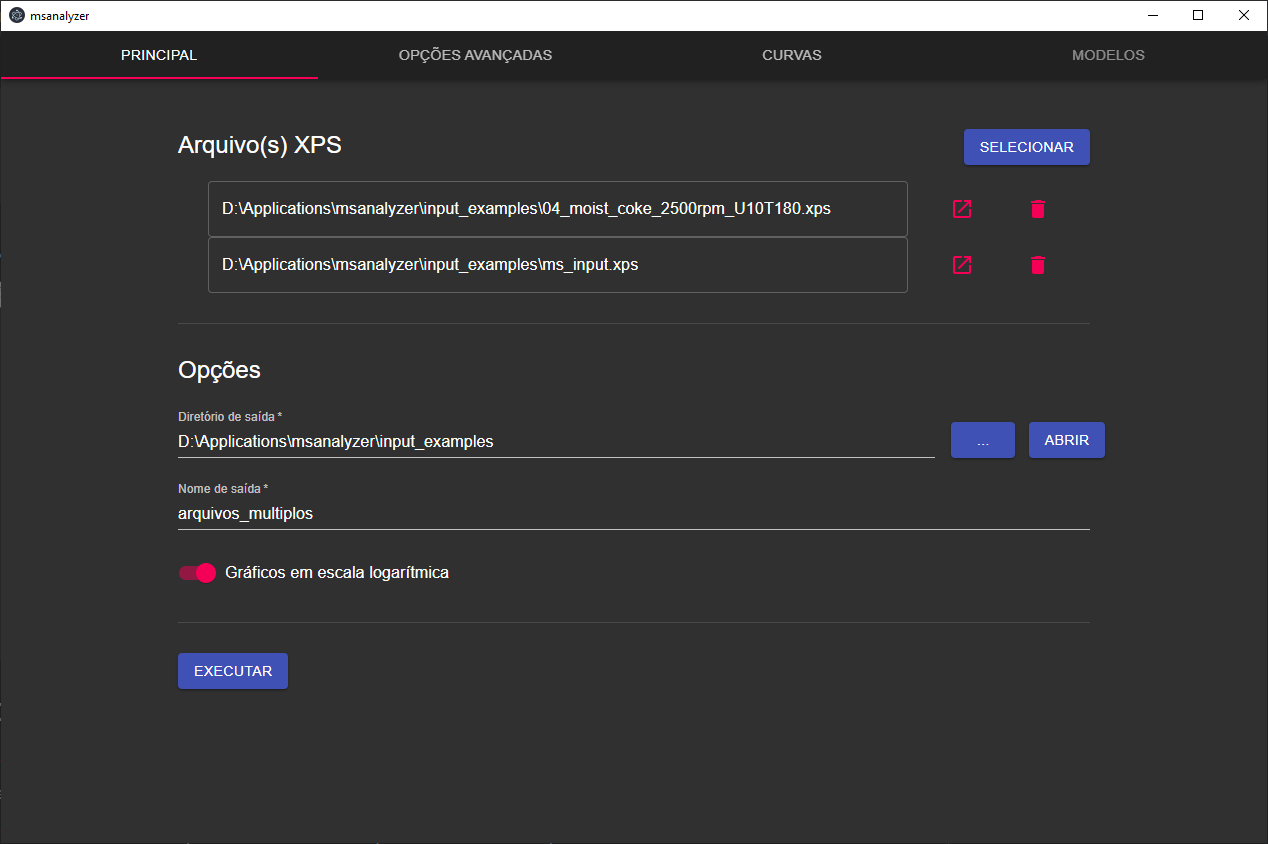
Janela principal
Command line interface
The easiest way to use msanalyzer is to download the .exe file on release pages. After downloading it, put the XPS report in the same folder as the EXE. Rename the XPS to "ms_input.xps" and double-click "msanalyzer.exe".
This will create a directory called "mastersizer_output" with the following files:
- output_curve_data.xlsx: diameter, volume fraction and cumulative volume fraction data in a Excel file;
- output_curves.svg: Plot of volume fraction and cumulative volume fraction data (example below);
- output_curve_data.txt: diameter, volume fraction and cumulative volume fraction data in a TXT file;
- output_RRB_model_parameters.txt: RRB model parameters fitted to input data;
- output_RRB_model.svg: Cumulative volume fraction plot of data and RRB fitted model (example below).

This program can also be used from command line with several options. Inside CMD or PowerShell, enter
./msanalyzer.exe --help
to see the available options.
dev install
To get a development enviroment running, do the following:
1 - Clone the repo
git clone https://github.com/marcusbfs/msanalyzer.git
2 - Create a virtual environment and activate it
python -m venv msanalyzer_venv
.\msanalyzer_venv\Script\activate.bat
3 - Download requirements files
pip install -r requirements.txt
4 - Run a test
python msanalyzer.py ms_input.xps
Contributing
Feel free to contribute anyway you want to :)
Authors
- Marcus Bruno Fernandes Silva - marcusbfs@gmail.com
License
This project is licensed under the MIT License - see the LICENSE.rst file for details
Release history Release notifications | RSS feed


Download files
Download the file for your platform. If you're not sure which to choose, learn more about installing packages.
Source Distribution
Built Distribution
Filter files by name, interpreter, ABI, and platform.
If you're not sure about the file name format, learn more about wheel file names.
Copy a direct link to the current filters
File details
Details for the file msanalyzer-3.8.0.tar.gz.
File metadata
- Download URL: msanalyzer-3.8.0.tar.gz
- Upload date:
- Size: 97.6 kB
- Tags: Source
- Uploaded using Trusted Publishing? No
- Uploaded via: poetry/1.1.8 CPython/3.9.6 Windows/10
File hashes
| Algorithm | Hash digest | |
|---|---|---|
| SHA256 |
a7929520431c068f14f6d06ad20dbf9980795db7135c4d7a10dab1c0f8f4e2e0
|
|
| MD5 |
9c9d0ae7277f9ae0435bdb5d71c1cd7b
|
|
| BLAKE2b-256 |
e5753f263c59a2549ffd614854b1bea75fcc028cc527fa0789407b2183729843
|
File details
Details for the file msanalyzer-3.8.0-py3-none-any.whl.
File metadata
- Download URL: msanalyzer-3.8.0-py3-none-any.whl
- Upload date:
- Size: 100.2 kB
- Tags: Python 3
- Uploaded using Trusted Publishing? No
- Uploaded via: poetry/1.1.8 CPython/3.9.6 Windows/10
File hashes
| Algorithm | Hash digest | |
|---|---|---|
| SHA256 |
7b87dcf5cd540335c0c420c4742880686bb748cb10989d885ec4f2698f5ad792
|
|
| MD5 |
dd9d207b4b6ca96014784d8d373edefb
|
|
| BLAKE2b-256 |
bcd9673c0c7141619f57295e30644bcad61ccecb4ded3596cb0e84dba97a6293
|


