
MSSI Pipeline
A Computational Framework for Multi-HSP Stress Signature Indexing in Spodoptera frugiperda
Role Name Affiliation
Lead Developer Ahmed Yassin, MSc Computational Biologist -- Peking University
Supervisor Dr. Etr H. K. Khashaba, Plant Protection PhD Research Institute (PPRI), Agricultural Research Center (ARC)
Supervisor Dr. Amany M. Abd El Plant Protection Azim, PhD Research Institute (PPRI), Agricultural Research Center (ARC)
Overview
The Multi-HSP Stress Signature Index (MSSI) Pipeline is a Python-based computational bioinformatics framework for integrating multiple small heat shock protein (sHsp) expression biomarkers into a unified quantitative stress signature in the Fall Armyworm, Spodoptera frugiperda.
The framework combines qRT-PCR expression processing, weighted multi-gene integration, stress classification, exploratory molecular risk assessment, geographic visualization, and automated reporting in a reproducible analytical workflow.
The package provides a graphical interface and can be launched directly after installation from PyPI.
Scientific Background
The Fall Armyworm (Spodoptera frugiperda) is a globally important invasive agricultural pest. Environmental stress, insecticide exposure, temperature variation, and other agricultural pressures can induce coordinated molecular responses involving multiple stress-regulated genes.
Conventional gene-expression analyses often examine biomarkers individually. The MSSI framework instead integrates the collective behavior of multiple stress-responsive genes to provide a systems-level representation of the molecular stress signature.
The framework is intended to support molecular stress characterization, population comparisons, resistance-related research, and Integrated Pest Management (IPM) research.
Conceptual Framework
The MSSI framework is based on the principle that a physiological stress response may be better represented by the coordinated expression of multiple biomarkers than by a single gene considered independently.
The pipeline integrates:
- qRT-PCR-derived gene-expression measurements
- Biological replicates
- Gene-specific weighting
- Population-level expression signatures
- Automated normalization and transformation
- Multi-gene stress indexing
- Stress-category assignment
- Exploratory molecular risk assessment
- Geographic visualization
- Publication-oriented figures and reports
Mathematical Framework
Multi-HSP Stress Signature Index (MSSI)
Mathematical Framework
Multi-HSP Stress Signature Index (MSSI)
The core analytical metric is the Multi-HSP Stress Signature Index:
[ MSSI = \frac{\sum_{i=1}^{n}(w_i \times FC_i)}{n}{=tex} ]
where:
- (FC_i) = relative fold-change expression of biomarker gene (i)
- (w_i) = biological weight assigned to biomarker gene (i)
- (n) = total number of biomarkers included in the panel
Higher MSSI values represent stronger collective activation of the selected stress-response biomarkers under the configured weighting scheme.
Exploratory Molecular Risk Assessment
The pipeline also provides an exploratory molecular risk assessment derived from the integrated molecular stress signature and associated expression patterns.
This molecular risk output should not be interpreted by itself as direct phenotypic evidence of insecticide resistance. Confirmation of insecticide resistance requires independent phenotypic or toxicological validation, such as appropriate susceptibility bioassays.
Core Features
Molecular Analysis
- Multi-gene expression integration
- Biological-replicate processing
- Gene-specific weighting
- Fold-change calculation
- Automated qRT-PCR transformation
- Population-level molecular stress signatures
Stress Classification
The pipeline assigns stress categories based on the calculated MSSI values, enabling comparison among analyzed populations.
Exploratory Risk Assessment
- Integrated molecular risk scoring
- Population-level risk stratification
- Decision-support summaries
Visual Analytics
- Comparative gene-expression figures
- Expression heatmaps
- MSSI comparison plots
- Risk-index visualizations
- Geographic MSSI distribution maps
- Publication-oriented graphical outputs
Automated Reporting
- PDF reports
- JSON summaries
- Exportable analytical results
- Publication-ready figures
Installation
Install from PyPI
MSSI Pipeline requires Python 3.9 or later.
Install the package directly from PyPI:
pip install mssi-pipeline
To upgrade to the latest available release:
pip install --upgrade mssi-pipeline
Verify the installation:
mssi --version
For version 1.0.0, the expected output is:
MSSI Pipeline v1.0.0
Display the command-line help:
mssi --help
Install from Source
Alternatively, clone the source repository:
git clone https://github.com/AHMEDY3DGENOME/MSSI-Pipeline.git
cd MSSI-Pipeline
Install the package:
pip install .
For development, use an editable installation:
pip install -e .
Verify the installation:
mssi --version
Launching the Pipeline
Launch the graphical interface with:
mssi
or:
mssi run
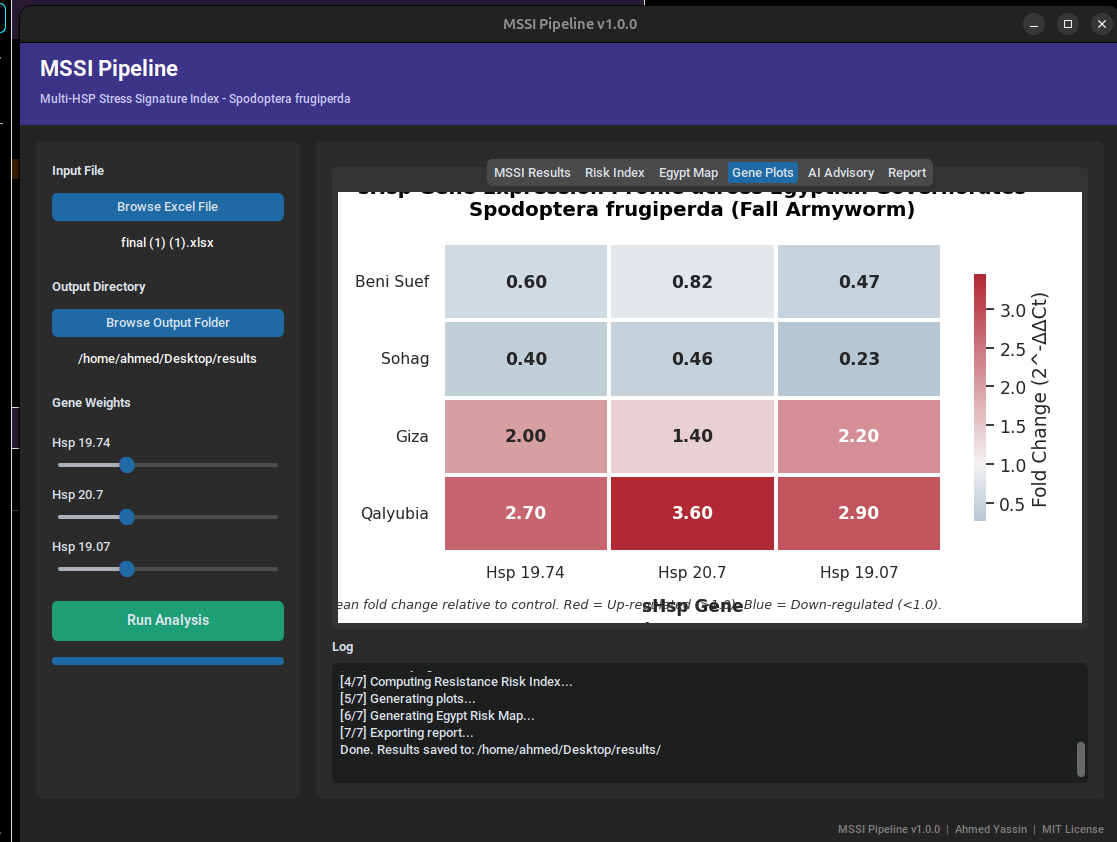
The MSSI graphical interface will open and guide the user through dataset selection, configuration, analysis, visualization, and reporting.
Quick Start
A typical analysis consists of the following steps:
- Prepare the qRT-PCR expression dataset.
- Launch the MSSI Pipeline.
- Select the input file.
- Select or confirm the output directory.
- Configure biomarker weights when required.
- Run the analysis.
- Review MSSI scores and stress classifications.
- Generate figures and geographic visualization.
- Export analytical summaries and reports.
Start the software with:
mssi run
Input Data
Recommended qRT-PCR CSV Format
For the current qRT-PCR workflow, the recommended input is a CSV file containing biological-replicate ΔCt measurements.
The required columns are:
Gene
Population
DeltaCt
Example:
Gene,Population,DeltaCt
Hsp 19.74,Control,5.24
Hsp 19.74,Control,5.31
Hsp 19.74,Beni Suef,3.82
Hsp 19.74,Beni Suef,3.91
Hsp 20.7,Control,6.15
Hsp 20.7,Control,6.08
Hsp 20.7,Beni Suef,4.73
Hsp 20.7,Beni Suef,4.81
Each row represents an individual biological replicate.
The pipeline processes the qRT-PCR measurements and derives the expression quantities required for downstream MSSI analysis.
Supported File Types
The workflow supports:
.csv.xlsx.xls
CSV input containing Gene, Population, and DeltaCt is recommended
for the corrected qRT-PCR workflow.
Excel support is retained for compatible datasets and legacy workflows.
Typical Analysis Workflow
The computational workflow can be summarized as:
qRT-PCR Data
      |
      v
Input Validation
      |
      v
DeltaCt Processing
      |
      v
DeltaDeltaCt Calculation
      |
      v
Relative Expression
2^(-DeltaDeltaCt)
      |
      v
Population Fold Change
      |
      v
Weighted Multi-Gene Integration
      |
      v
MSSI Score
      |
      +--> Stress Classification
      |
      +--> Exploratory Molecular Risk Assessment
      |
      +--> Comparative Figures
      |
      +--> Geographic Visualization
      |
      +--> Automated Reports
Using the Graphical Interface
1. Select the Input Dataset
Launch the program:
mssi run
Use the file-selection control in the graphical interface to select the qRT-PCR or compatible Excel dataset.
The input data are validated before downstream calculations are performed.
2. Select the Output Directory
The pipeline can create an analysis output directory for generated results. A custom output location can also be selected through the interface when available.
3. Configure Biomarker Weights
Detected biomarkers can be assigned gene-specific weights representing their configured contribution to the integrated MSSI calculation.
Weights should be selected according to the analytical design and biological rationale of the study.
4. Run the Analysis
Start the analysis from the graphical interface.
The workflow performs the required expression processing, MSSI computation, classification, visualization, and reporting steps.
5. Review and Export Results
After completion, review the generated:
- Gene-expression summaries
- Population MSSI scores
- Stress classifications
- Exploratory molecular risk results
- Comparative figures
- Geographic maps
- PDF/JSON reports, where generated
Visual Output
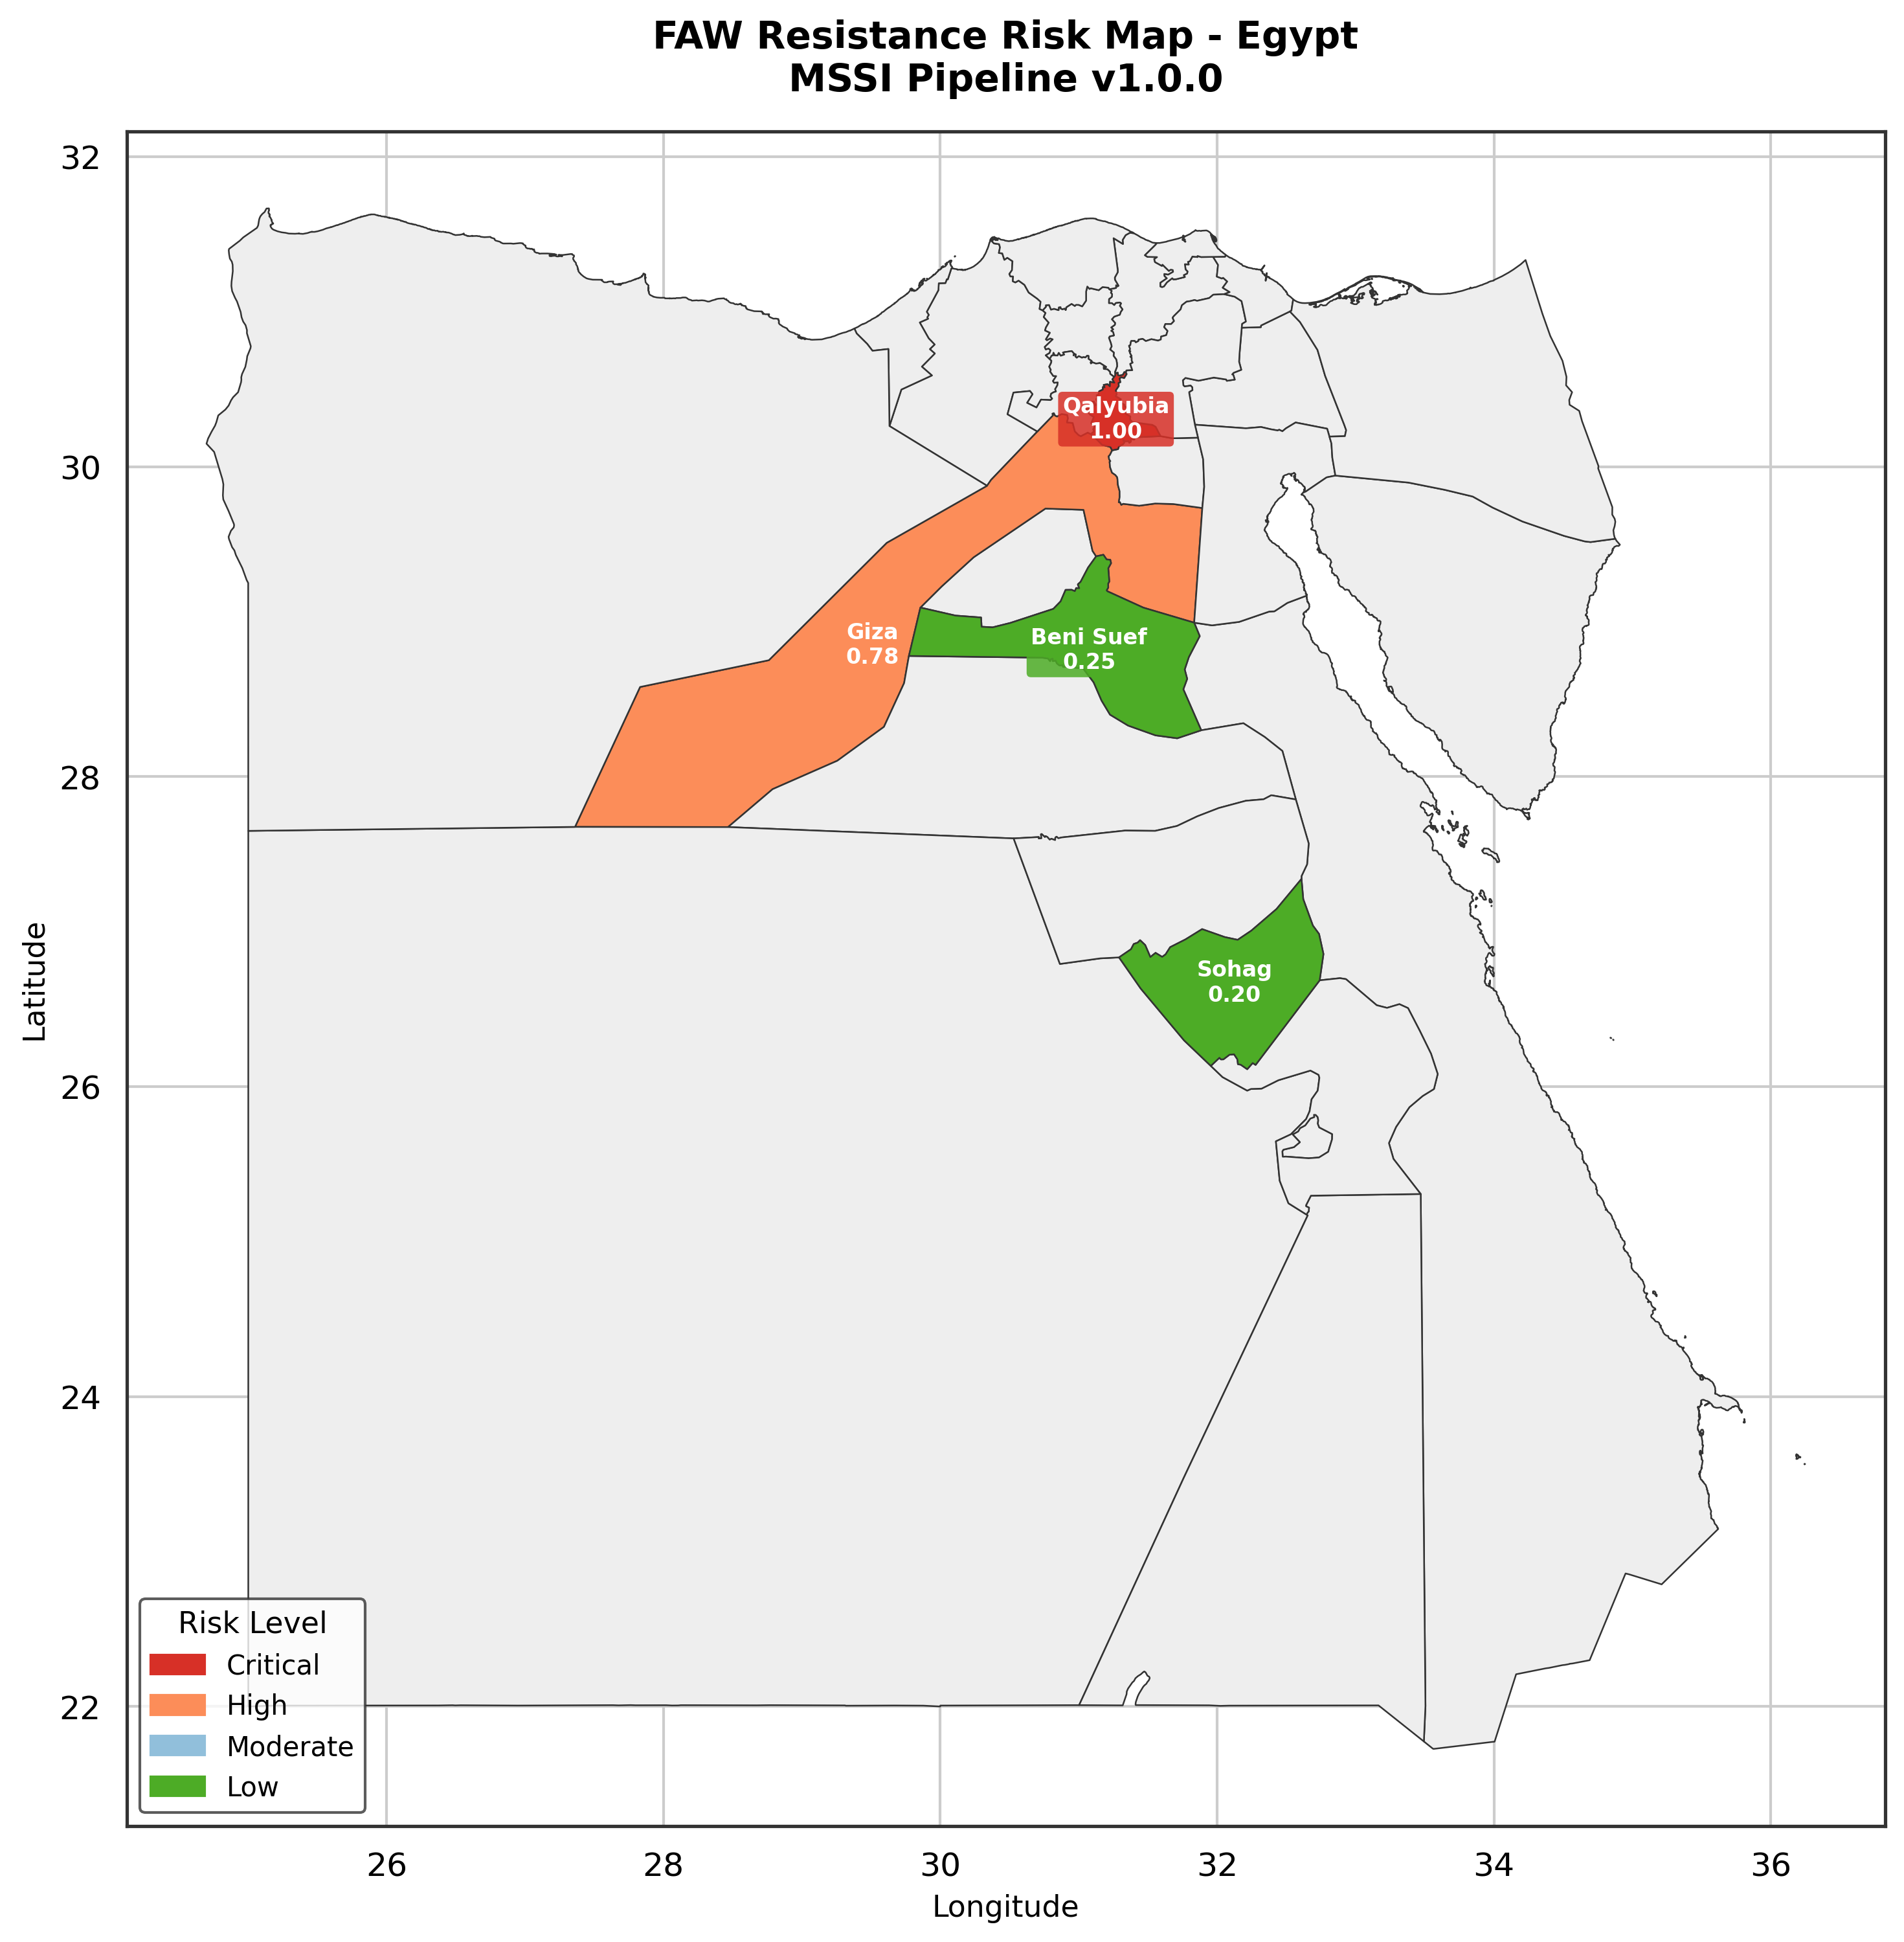
Geographic Resistance Risk Mapping
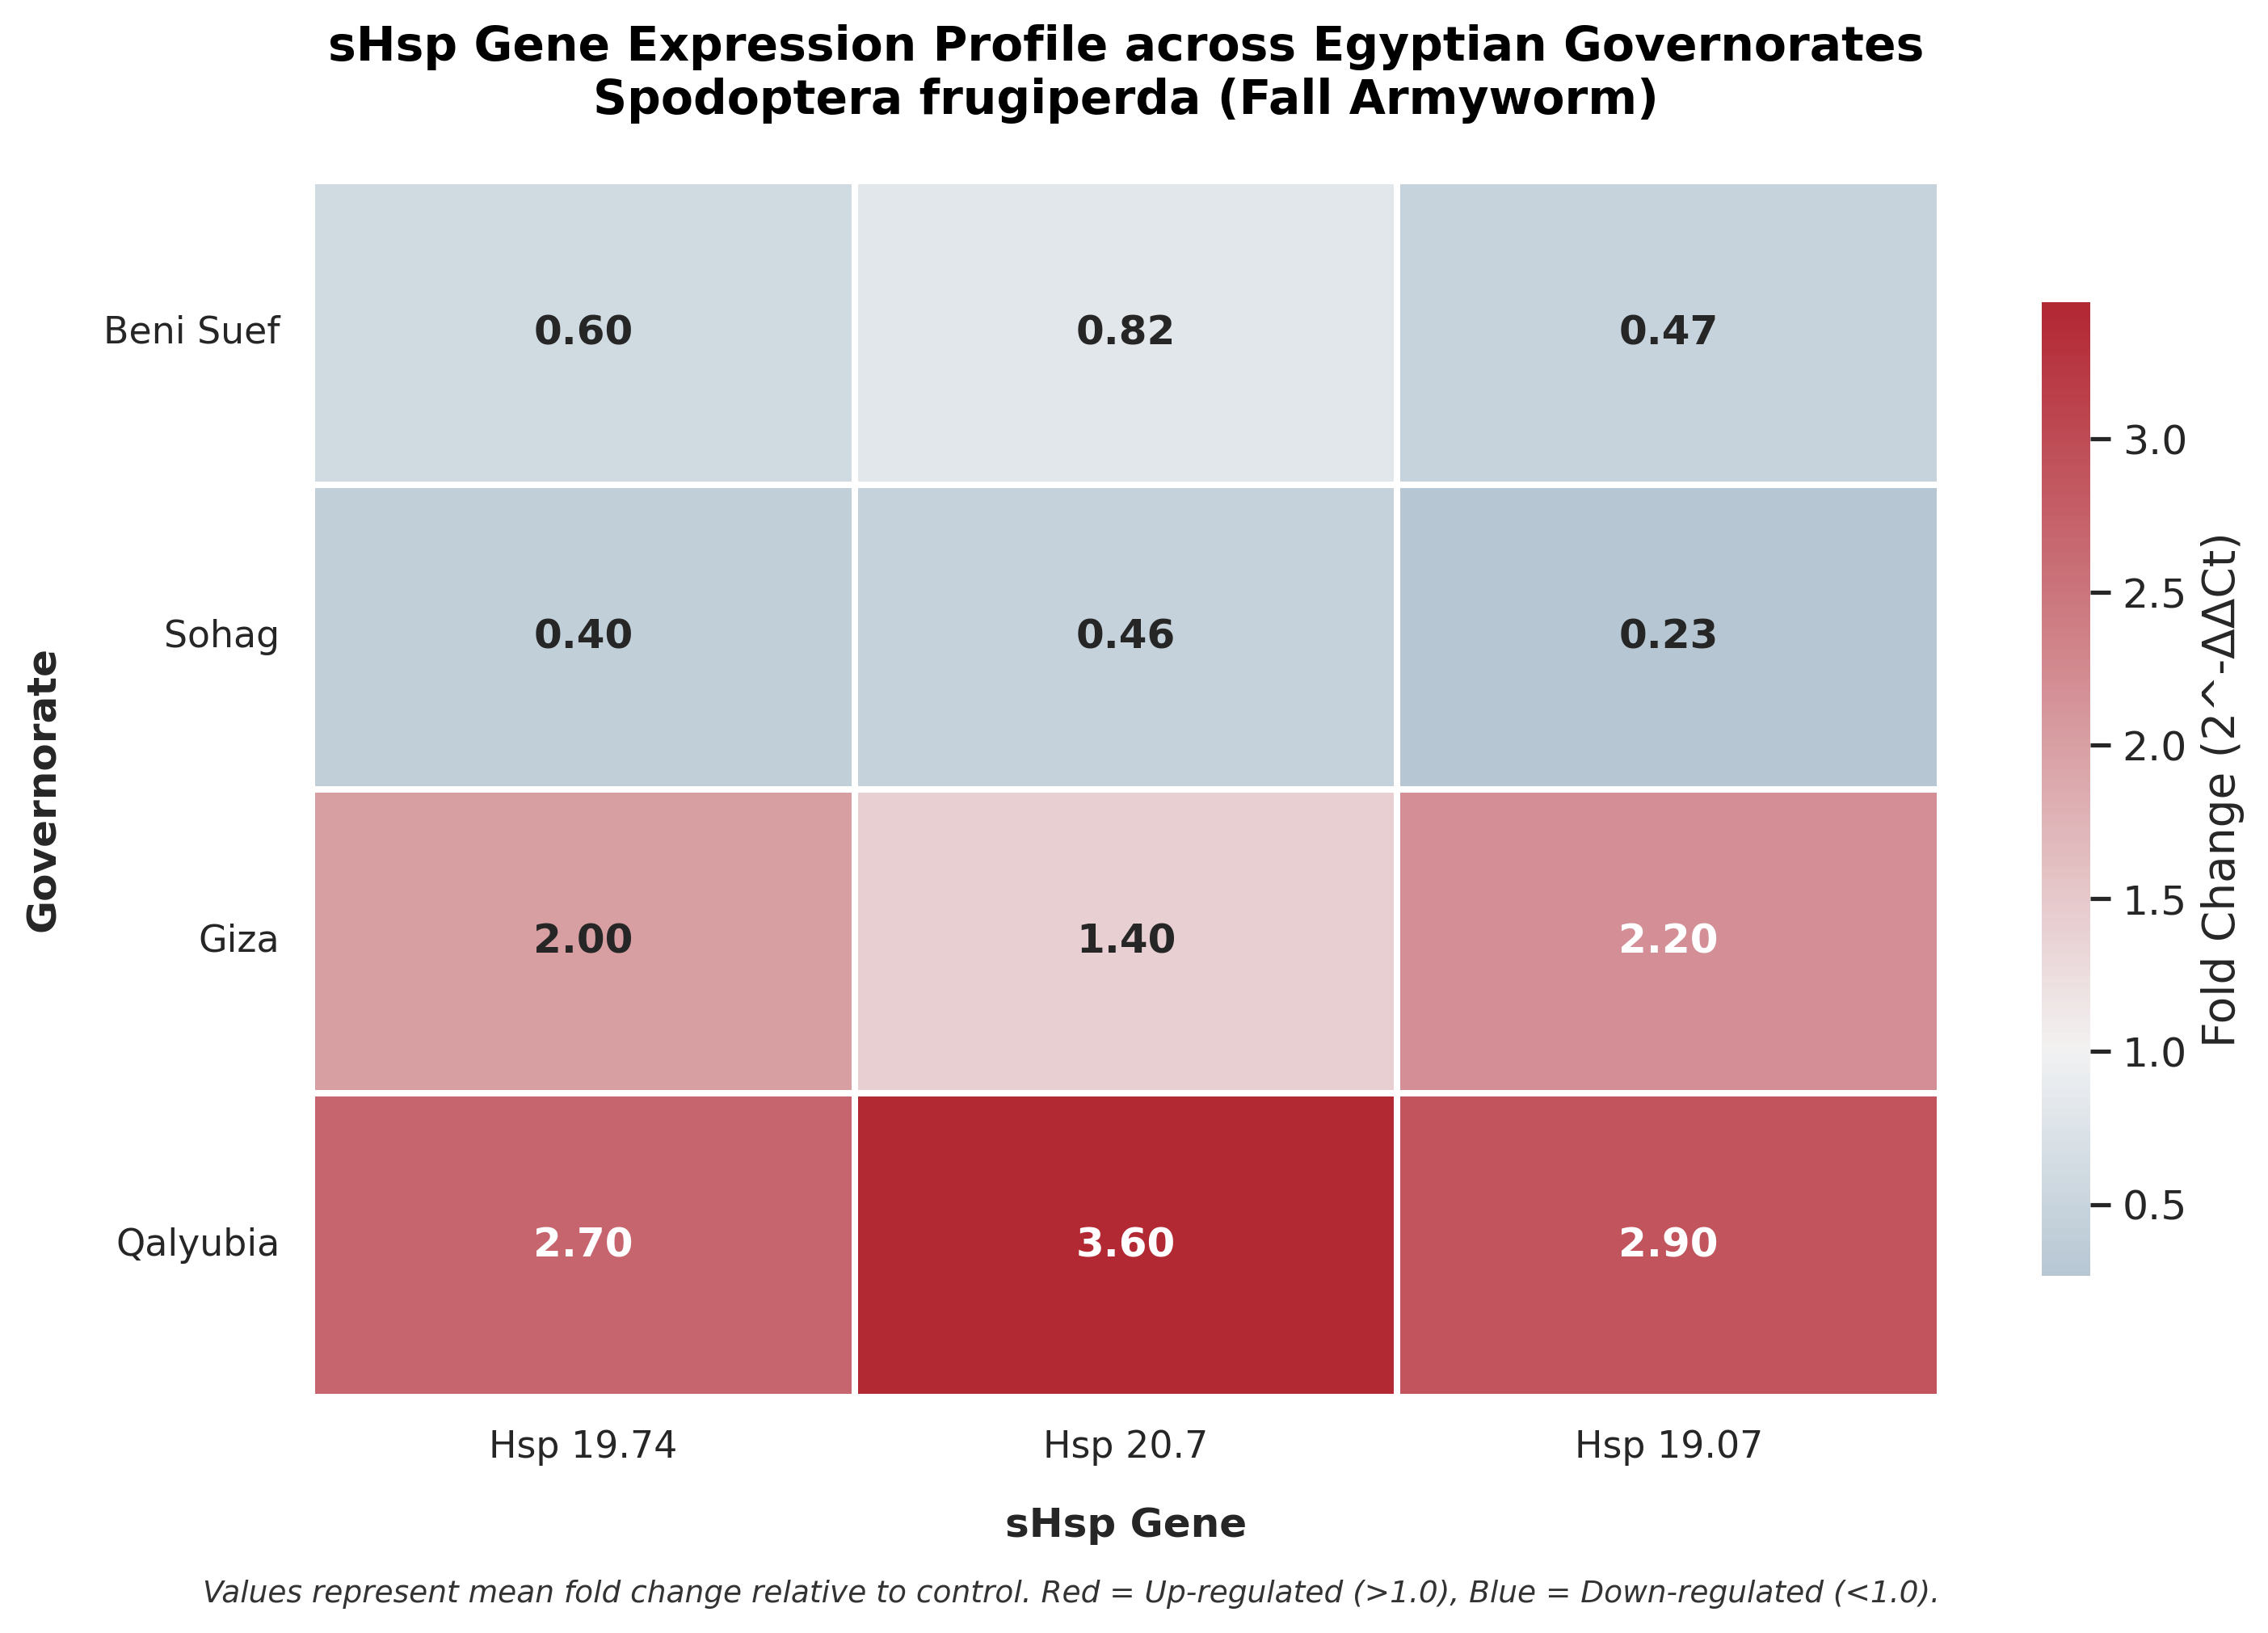
Comparative Gene Expression Heatmap
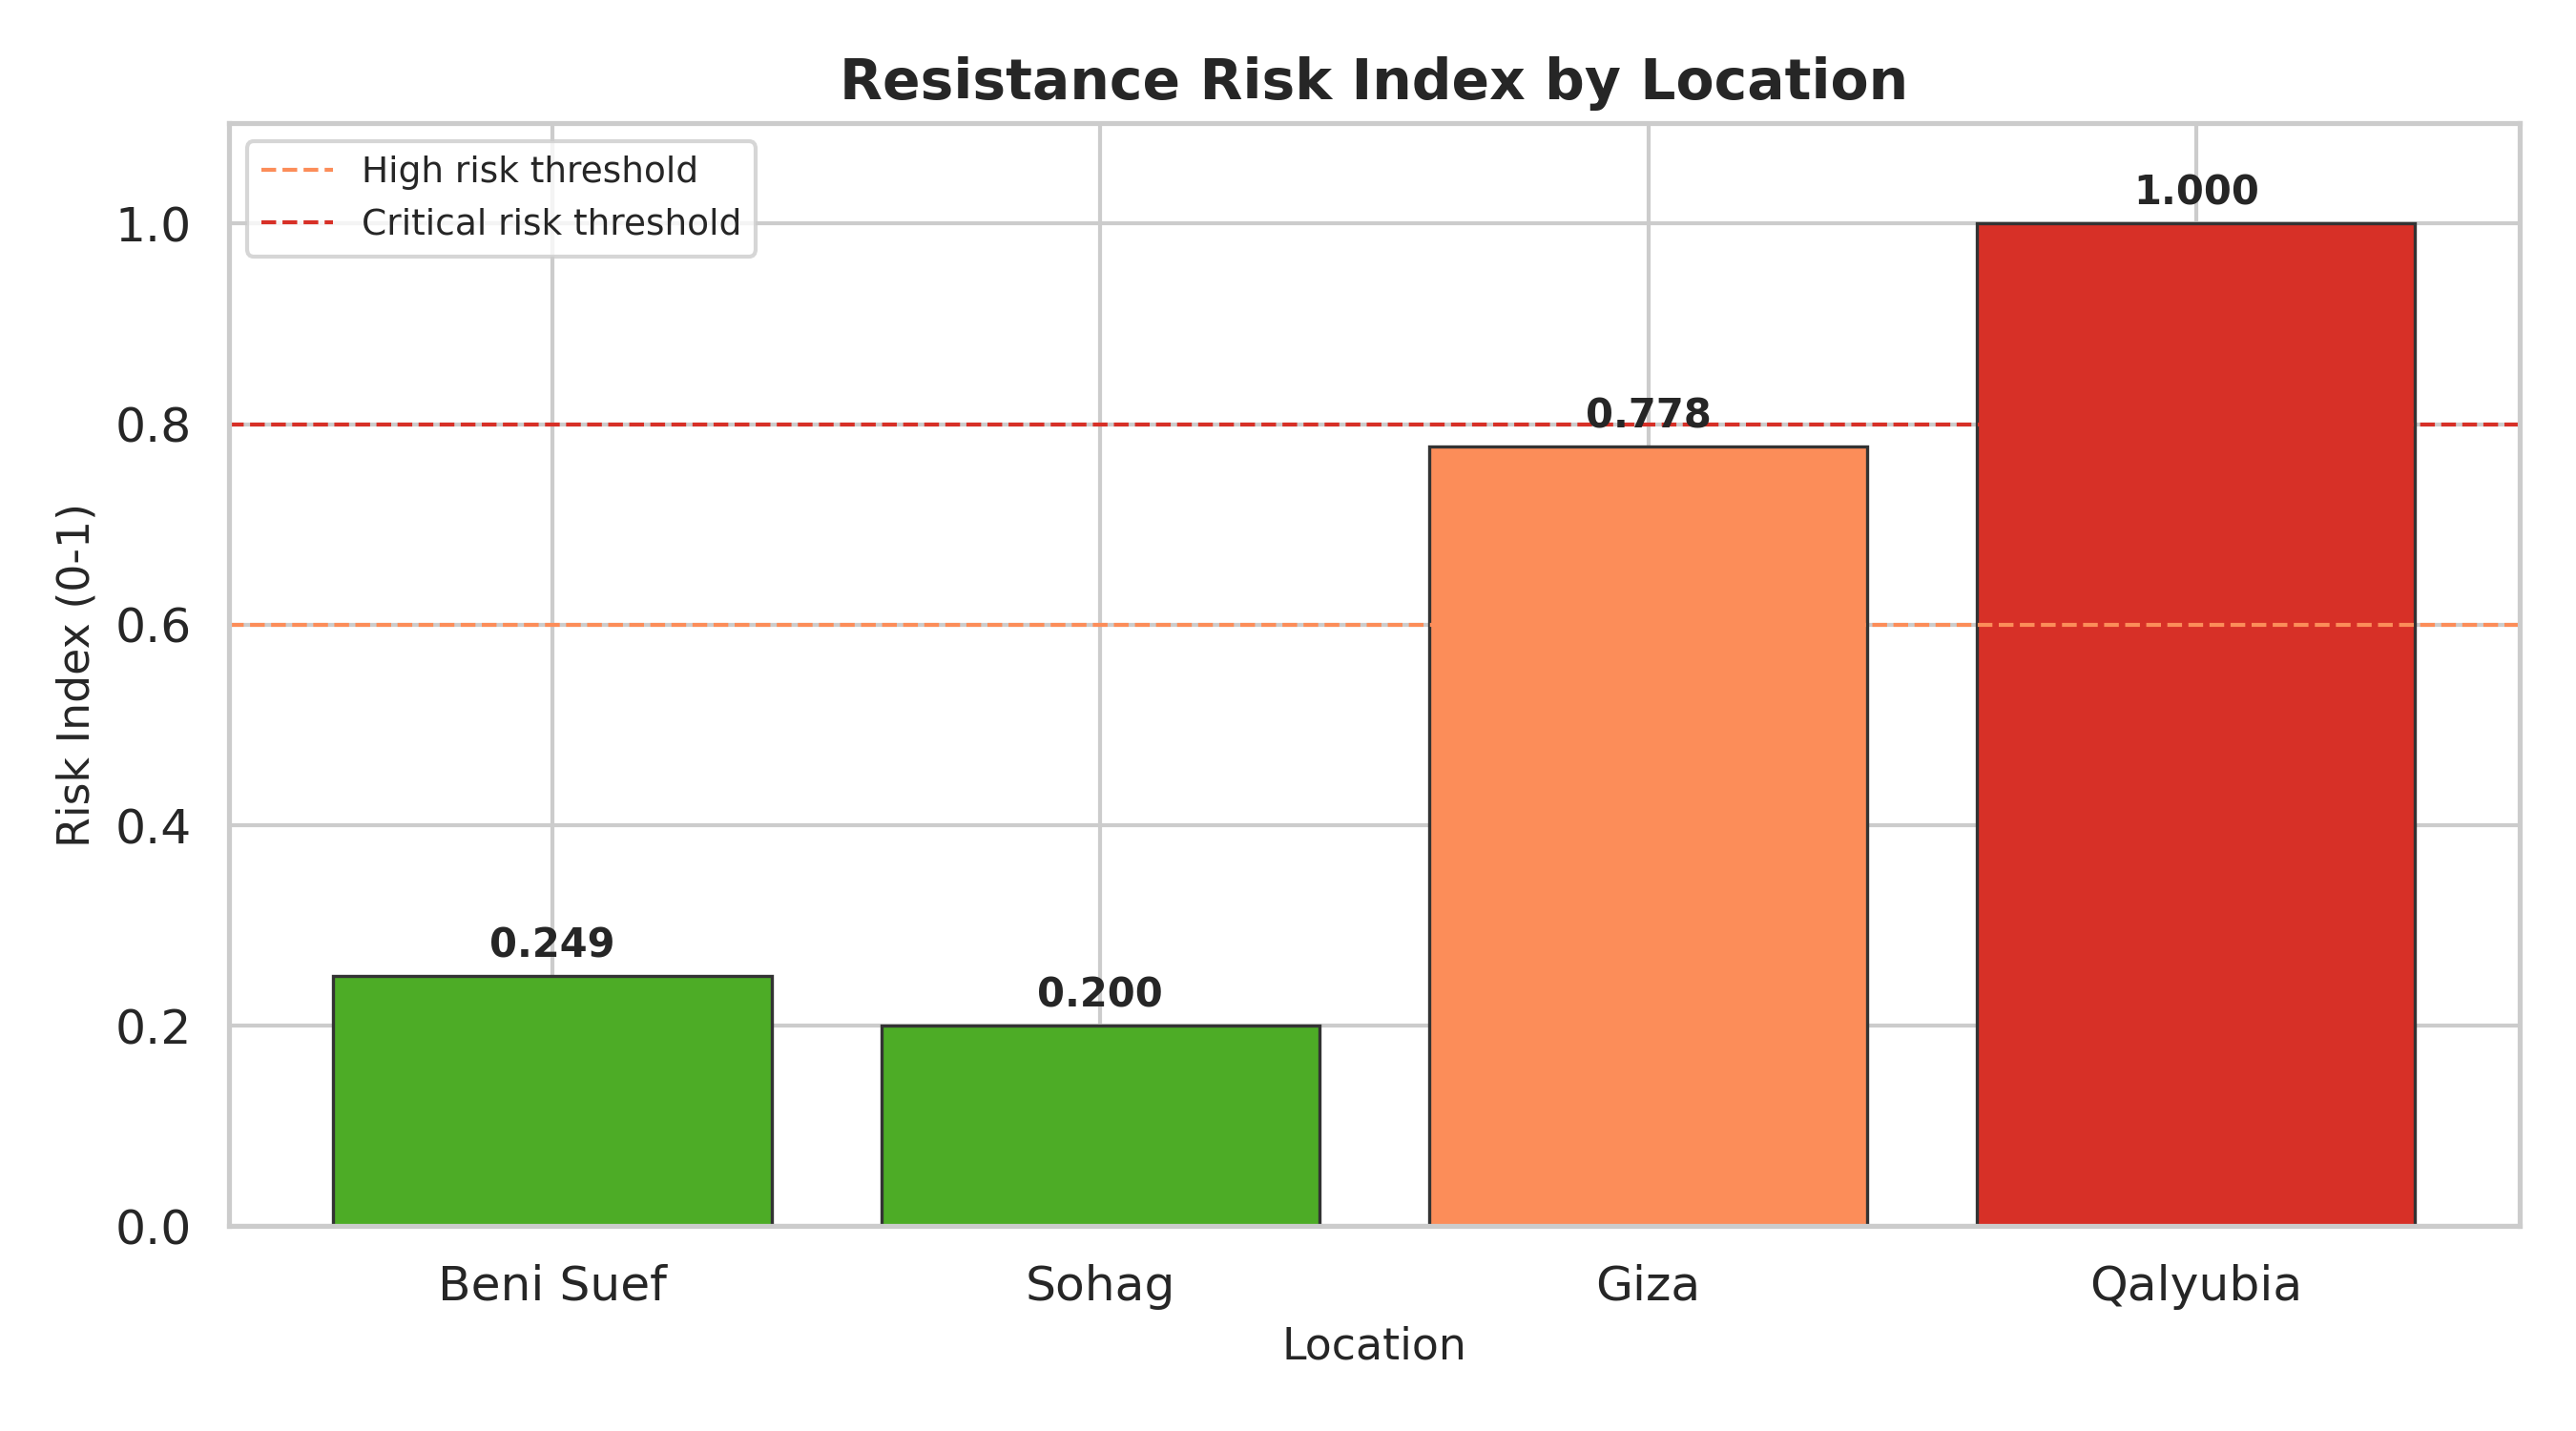
Resistance Risk Stratification
Interactive Decision-Support Interface
Output
Depending on the selected analysis and available data, the pipeline can generate:
Analytical Results
- Relative gene-expression summaries
- Population-level fold changes
- MSSI scores
- Stress classifications
- Exploratory molecular risk indices
- Population comparisons
Figures
- Gene-expression plots
- Heatmaps
- MSSI comparison figures
- Risk visualizations
- Geographic distribution maps
Reports
- PDF analytical reports
- JSON result summaries
- Exportable publication-oriented figures
Geographic Mapping
The MSSI Pipeline includes a programmatic geographic visualization module for displaying population-specific MSSI values across sampled locations.
Map rendering is performed using Python geospatial and visualization libraries, including:
- GeoPandas
- Matplotlib
- Shapely
- PyProj
Administrative boundary data used by the mapping module originate from an external geographic data source. Users should comply with the attribution and licensing requirements of the geographic boundary dataset when publishing maps produced from those data.
For scientific publications, the geographic boundary data source and the software used to generate the map should be cited in accordance with the requirements of the relevant journal and data provider.
Command-Line Reference
Launch the graphical interface
mssi
or:
mssi run
Display version information
mssi --version
or:
mssi version
Display help
mssi --help
Example
After installation:
pip install mssi-pipeline
verify the installed version:
mssi --version
and launch the software:
mssi run
Then use the graphical interface to:
Select Dataset
      |
      v
Validate Input
      |
      v
Configure Biomarker Weights
      |
      v
Run Analysis
      |
      v
Calculate MSSI
      |
      v
Review Stress/Risk Results
      |
      v
Generate Figures and Maps
      |
      v
Export Results
Applications
Potential research applications include:
- Molecular stress-response studies
- Insecticide resistance research
- Population stress surveillance
- Molecular ecology
- Comparative biomarker analysis
- Agricultural decision-support research
- Integrated Pest Management (IPM)
- Bioinformatics-based molecular diagnostics
Important Scientific Interpretation
The MSSI Pipeline provides a computational framework for integrating selected molecular biomarkers into a quantitative molecular stress signature.
The biological interpretation of MSSI values depends on the experimental design, selected biomarkers, gene weights, controls, and biological context.
The exploratory molecular risk assessment produced by the software does not replace phenotypic insecticide-resistance testing. Claims of resistance should be supported by independent experimental evidence, such as standardized bioassays or other appropriate validation methods.
System Requirements
- Python 3.9 or later
- Linux, Windows, or macOS
Major Python dependencies include:
- pandas
- NumPy
- Matplotlib
- seaborn
- GeoPandas
- Shapely
- PyProj
- fpdf2
- openpyxl
- CustomTkinter
- Pillow
Dependencies are installed automatically when the package is installed from PyPI:
pip install mssi-pipeline
Development
Clone the repository:
git clone https://github.com/AHMEDY3DGENOME/MSSI-Pipeline.git
cd MSSI-Pipeline
Install the package with development dependencies:
pip install -e ".[dev]"
Run tests:
pytest
Version
Current release:
MSSI Pipeline v1.0.0
Citation
If you use the MSSI Pipeline in scientific research, please cite the associated publication and software release when available.
Software:
Yassin, A.E. MSSI Pipeline: A Computational Framework for Multi-HSP Stress Signature Indexing in Spodoptera frugiperda. Version 1.0.0.
The final publication citation and persistent software identifier (e.g., DOI) can be added after publication/archiving.
Authors and Contributors
Ahmed Elsayed Yassin, MSc
Lead Developer
Computational Biologist | Bioinformatics Researcher | Python Developer
Dr. Etr H. K. Khashaba, PhD
Supervisor
Plant Protection Research Institute (PPRI), Agricultural Research Center
(ARC)
Dr. Amany M. Abd El Azim, PhD
Supervisor
Plant Protection Research Institute (PPRI), Agricultural Research Center
(ARC)
Repository
GitHub repository:
https://github.com/AHMEDY3DGENOME/MSSI-Pipeline
License
This project is released under the MIT License.
See the LICENSE file distributed with the source code for the full
license text.
Disclaimer
MSSI Pipeline is intended for scientific research and analytical use. Molecular stress and exploratory risk outputs should be interpreted within the context of the underlying experimental design and should not be used as a substitute for independent biological, toxicological, or field validation.
1 maintainer

Download files
Download the file for your platform. If you're not sure which to choose, learn more about installing packages.
Source Distribution
Built Distribution
Filter files by name, interpreter, ABI, and platform.
If you're not sure about the file name format, learn more about wheel file names.
Copy a direct link to the current filters
File details
Details for the file mssi_pipeline-1.0.1.tar.gz.
File metadata
- Download URL: mssi_pipeline-1.0.1.tar.gz
- Upload date:
- Size: 44.6 kB
- Tags: Source
- Uploaded using Trusted Publishing? No
- Uploaded via:
twine/7.0.0 CPython/3.12.3
File hashes
| Algorithm | Hash digest | |
|---|---|---|
| SHA256 |
d180663ce7461c8bceefec623f7ed6db0caf372ed9e79ea7b531391933c747a6
|
|
| MD5 |
006af0158363b9efadef2c7967dea6f3
|
|
| BLAKE2b-256 |
7d65d6fd041d7df58233184929e03bb8381402d55601e8858d5ce9235ac1e841
|
File details
Details for the file mssi_pipeline-1.0.1-py3-none-any.whl.
File metadata
- Download URL: mssi_pipeline-1.0.1-py3-none-any.whl
- Upload date:
- Size: 42.9 kB
- Tags: Python 3
- Uploaded using Trusted Publishing? No
- Uploaded via:
twine/7.0.0 CPython/3.12.3
File hashes
| Algorithm | Hash digest | |
|---|---|---|
| SHA256 |
add88b61087849e6b0c32d88ae7ed1fd375f18429cb94100e78522e5f6147cdd
|
|
| MD5 |
028fb1d21367fe5b5768a96e36a36373
|
|
| BLAKE2b-256 |
b86df3b9ce4a66204e43b1373bf513489d2815807af62cdc28891de16bed88a5
|














