A multi-agent system for debugging API failures

Project description
Multi-Agent Debugger
A powerful Python package that uses multiple AI agents to debug API failures by analyzing logs, code, and user questions. Built with CrewAI, it supports LLM providers including OpenAI, Anthropic, Google, Ollama, and more.
🎥 Demo Video
Watch the multiagent-debugger in action:
🏗️ Architecture
The Multi-Agent Debugger uses a sophisticated architecture that combines multiple specialized AI agents working together to analyze and debug API failures.
Core Agent Flow

Detailed Architecture

✨ Features
🤖 Multi-Agent Architecture
- Question Analyzer Agent: Extracts key entities from natural language questions and classifies error types
- Log Analyzer Agent: Searches and filters logs for relevant information, extracts stack traces
- Code Path Analyzer Agent: Validates and analyzes code paths found in logs
- Code Analyzer Agent: Finds API handlers, dependencies, and error handling code
- Root Cause Agent: Synthesizes findings to determine failure causes and generates visual flowcharts
🔧 Comprehensive Analysis Tools
- Log Analysis: Enhanced grep, filtering, stack trace extraction, and error pattern analysis
- Code Analysis: API handler discovery, dependency mapping, error handler identification, multi-language support
- Flowchart Generation: Error flow, system architecture, decision trees, sequence diagrams, and debugging storyboards
- Natural Language Processing: Convert user questions into structured queries
🌐 Multi-Provider LLM Support
- OpenAI
- Anthropic
- Ollama
- Azure OpenAI
- AWS Bedrock
- And 50+ more providers
Features
- Visual Flowcharts: Mermaid diagrams for error propagation and system architecture
- Copyable Output: Clean, copyable flowchart code for easy sharing
- Multi-language Support: Python, JavaScript, Java, Go, Rust, and more
📊 Output Formats
- Structured JSON: Programmatic access to analysis results
- Text Documents: Human-readable reports saved to local files
- Visual Flowcharts: Mermaid diagrams for documentation and sharing
🚀 Installation
# From PyPI
pip install multiagent-debugger

# From source
git clone https://github.com/VishApp/multiagent-debugger.git
cd multiagent-debugger
pip install -e .
⚡ Quick Start
- Set up your configuration:
multiagent-debugger setup
- Debug an API failure:
multiagent-debugger debug "Why did my /api/users endpoint fail yesterday?"
- View generated files:
- Analysis results in JSON format
- Text documents in current directory
- Visual flowcharts for documentation
🖥️ Command-Line Usage
Debug Command
Usage: python -m multiagent_debugger debug [OPTIONS] QUESTION

  Debug an API failure or error scenario with multi-agent assistance.

Arguments:
  QUESTION    The natural language question or debugging prompt.
              Example: 'find the common errors and the root-cause'

Options:
  -c, --config PATH             Path to config file (YAML)
  -v, --verbose                 Enable verbose output for detailed logs
  --mode [frequent|latest|all]  Log analysis mode:
                                  frequent: Find most common error patterns
                                  latest:   Focus on most recent errors
                                  all:      Analyze all available log lines
  --time-window-hours INT       Time window (hours) for log analysis
  --max-lines INT               Maximum log lines to analyze
  --code-path PATH              Path to source code directory/file for analysis
  -h, --help                    Show this message and exit

Examples:
  multiagent-debugger debug 'find the common errors and the root-cause' \
      --config ~/.config/multiagent-debugger/config.yaml --mode latest

  multiagent-debugger debug 'why did the upload to S3 fail?' \
      --mode frequent --time-window-hours 12 \
      --code-path /Users/myname/myproject/src

  multiagent-debugger debug 'analyze recent errors' \
      --code-path /path/to/specific/file.py
This command analyzes your logs, extracts error patterns and code paths, and provides root cause analysis with actionable solutions and flowcharts.
⚙️ Configuration
Create a config.yaml file (or use the setup command):
# Paths to log files
log_paths:
  - "/var/log/myapp/app.log"
  - "/var/log/nginx/access.log"

# Path to source code directory or file for analysis (SECURITY FEATURE)
code_path: "/path/to/your/source/code"  # Restricts code analysis to this path only

# Log analysis options
analysis_mode: "frequent"   # frequent, latest, all
time_window_hours: 24      # analyze logs from last N hours
max_lines: 10000           # maximum log lines to analyze

# LLM configuration
llm:
  provider: openai  # or anthropic, google, ollama, etc.
  model_name: gpt-4
  temperature: 0.1
  #api_key: optional, can use environment variable
Code Path Security
The code_path configuration is a security feature that restricts code analysis to a specific directory or file:
# Security: Only analyze code within this path
code_path: "/Users/myname/myproject/src"
How it works:
- When logs contain file paths (from stack traces, errors), the system validates them against
code_path - Files outside the configured path are rejected and not analyzed
- This prevents the system from analyzing sensitive system files or unrelated codebases
- Can be a directory (analyzes all source files within) or a specific file
Use cases:
- Multi-project environments: Restrict analysis to current project only
- Security: Prevent analysis of system files or sensitive directories
- Focus: Analyze only specific parts of large codebases
CLI override:
# Override config file code_path for this session
multiagent-debugger debug "question" --code-path /path/to/specific/project
Custom Providers
The system supports various LLM providers including OpenRouter, Anthropic, Google, and others. See Custom Providers Guide for detailed configuration instructions.
Environment Variables
Set the appropriate environment variable for your chosen provider:
- OpenAI:
OPENAI_API_KEY - Anthropic:
ANTHROPIC_API_KEY - Google:
GOOGLE_API_KEY - Azure:
AZURE_OPENAI_API_KEY,AZURE_OPENAI_ENDPOINT - AWS:
AWS_ACCESS_KEY_ID,AWS_SECRET_ACCESS_KEY,AWS_REGION - See documentation for other providers
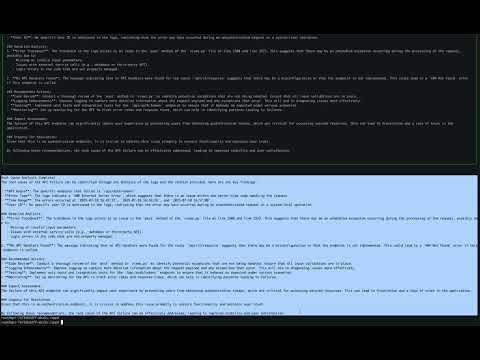
🔍 How It Works
1. Question Analysis
- Extracts key information like API routes, timestamps, and error types
- Classifies the error type (API, Database, File, Network, etc.)
- Structures the query for other agents
2. Log Analysis
- Searches through specified log files using enhanced grep
- Filters relevant log entries by time and pattern
- Extracts stack traces and error patterns
- Dynamically extracts code paths (file paths, line numbers, function names)
- Validates code paths found in logs
3. Code Analysis
- Validates that extracted file paths are within the configured
code_path(security) - Locates relevant API handlers and endpoints
- Identifies dependencies and error handlers
- Maps the code structure and relationships
- Supports multiple programming languages (Python, JavaScript, Java, Go, Rust, etc.)
- Rejects analysis of files outside the configured code path
4. Root Cause Analysis
- Synthesizes information from all previous agents
- Determines the most likely cause with confidence levels
- Generates creative narratives and metaphors
- Creates visual flowcharts for documentation
5. Output Generation
- Structured JSON for programmatic access
- Human-readable text documents
- Visual flowcharts in Mermaid format
- Copyable flowchart code for easy sharing
🛠️ Advanced Usage
List Available Providers
multiagent-debugger list-providers
List Models for a Provider
multiagent-debugger list-models openai
Debug with Custom Config
multiagent-debugger debug "Question?" --config path/to/config.yaml
Analyze Recent Errors Only
multiagent-debugger debug "What went wrong?" --mode latest --time-window-hours 2
Analyze Large Log Files
multiagent-debugger debug "Find patterns" --max-lines 50000
Restrict Code Analysis to Specific Path
# Only analyze code within /path/to/project directory
multiagent-debugger debug "What caused the error?" --code-path /path/to/project

# Analyze only a specific file
multiagent-debugger debug "Debug this file" --code-path /path/to/file.py
🧪 Development
# Create virtual environment
python package_builder.py venv

# Install development dependencies
python package_builder.py install

# Run tests
python package_builder.py test

# Build distribution
python package_builder.py dist
📋 Requirements
- Python: 3.8+
- Dependencies:
- crewai>=0.28.0
- pydantic>=2.0.0
- And others (see requirements.txt)
📄 License
MIT License - see LICENSE for details.
🤝 Contributing
Contributions are welcome! Please feel free to submit a Pull Request.
🆘 Support
- GitHub Issues: Report a bug
- Documentation: Read more
🎯 Use Cases
- API Debugging: Quickly identify why API endpoints are failing
- Production Issues: Analyze logs and code to find root causes
- Error Investigation: Understand complex error chains and dependencies
- Documentation: Generate visual flowcharts for error propagation
- Team Collaboration: Share analysis results in multiple formats
- Multi-language Projects: Support for Python, JavaScript, Java, Go, Rust, and more
- Time-based Analysis: Focus on recent errors or specific time periods
- Large Log Analysis: Handle massive log files with configurable limits
Release history Release notifications | RSS feed


Download files
Download the file for your platform. If you're not sure which to choose, learn more about installing packages.
Source Distribution
Built Distribution
Filter files by name, interpreter, ABI, and platform.
If you're not sure about the file name format, learn more about wheel file names.
Copy a direct link to the current filters
File details
Details for the file multiagent_debugger-1.0.22.tar.gz.
File metadata
- Download URL: multiagent_debugger-1.0.22.tar.gz
- Upload date:
- Size: 74.1 kB
- Tags: Source
- Uploaded using Trusted Publishing? No
- Uploaded via: twine/6.1.0 CPython/3.13.2
File hashes
| Algorithm | Hash digest | |
|---|---|---|
| SHA256 |
0af16026ffa6d7583f6cf3507c072a168fd4d6e6aa6d45e29ee25d84732ac43f
|
|
| MD5 |
4a23837090c6485b714cdd3959a87826
|
|
| BLAKE2b-256 |
0ead6e6cc2c525d2bba8e4192f6933c3cd04032754b4287ca2028cee897c0dd0
|
File details
Details for the file multiagent_debugger-1.0.22-py3-none-any.whl.
File metadata
- Download URL: multiagent_debugger-1.0.22-py3-none-any.whl
- Upload date:
- Size: 79.2 kB
- Tags: Python 3
- Uploaded using Trusted Publishing? No
- Uploaded via: twine/6.1.0 CPython/3.13.2
File hashes
| Algorithm | Hash digest | |
|---|---|---|
| SHA256 |
d9bf870a47b06821323abad3796cf4d23515adf96a2379f4eac5277a4593a3ff
|
|
| MD5 |
45d9566b08f7b1d95592376e66f3d6dd
|
|
| BLAKE2b-256 |
d7e97812e9df31948bbc2e62fb034864b59f89bf11209d80d32b6bbed62df79a
|


