
multilayer-sdk
Pure-Python Synchronized Multi-Panel Map Visualization, Spatial Comparison Engine & Interactive Dashboard Builder.




🌐 Live Interactive Studio & Documentation
Explore the interactive multi-panel map simulator and comprehensive reference manual:
Try out real-time neon laser crosshair tracking, split-screen curtain swipe comparisons, and live choropleth classifiers directly in your browser.
🌟 Overview
multilayer-sdk (the headless Python core behind 02Multimap) allows urban planners, spatial data scientists, and researchers to visualize, cross-analyze, and compare multiple spatial datasets side-by-side with millisecond synchronization.
Instead of toggling layers on and off in a single map, multilayer coordinates up to 8 synchronized map viewports in dynamic grids (1x2, 2x1, 1x3, 2x2, 2x3, 2x4) with:
- Bi-directional Pan & Zoom Broadcasting: Drag or zoom on any panel to coordinate all others in real time.
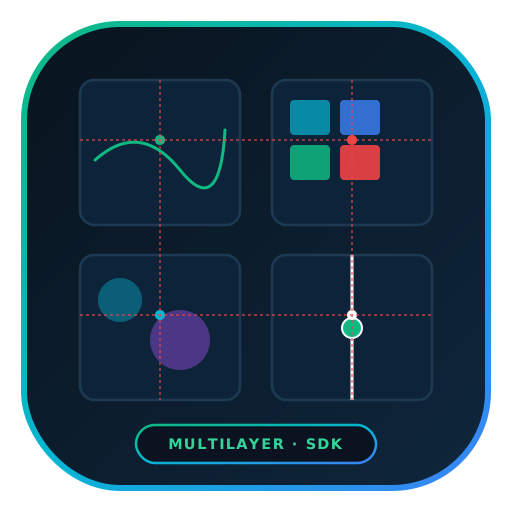
- Neon Laser Crosshair Cursor Tracking: Move your mouse over any panel to project neon-colored crosshairs tracking the exact geographic coordinate across all viewports.
- Graduated Thematic Choropleths: Quantiles, Equal Interval, Natural Breaks, and Standard Deviation statistical binning with scientific palettes (
viridis,magma,plasma,turbo,cividis,spectral,rdylbu). - Interactive Split-Screen Curtain Swipe: Draggable split slider for before/after temporal change detection.
- Single-File Self-Contained HTML Dashboards: Export zero-dependency interactive HTML files ready for presentations, stakeholders, or offline field audits.
- Jupyter Notebook & Google Colab Integration: Rich inline widget display via
mm.show().
🚀 Installation
pip install multilayer-sdk
⚡ Quickstart
1. Build a 4-Panel Synchronized Workspace
import multilayer as ml

# 1. Initialize a 4-panel (2x2) synchronized map grid
mm = ml.MultiMap(grid="2x2", title="Urban Vulnerability & Land Use Assessment", basemap="carto-dark")

# 2. Panel 1: High-resolution satellite imagery with study area boundary
mm.panel(0).title = "1. Satellite Context"
mm.panel(0).set_basemap("satellite")
mm.panel(0).add_layer("study_area.geojson", stroke_color="#38bdf8", fill_opacity=0.2)

# 3. Panel 2: Thematic choropleth of population density
vlayer = ml.VectorLayer.from_geojson("demographics.geojson")
pop_choro = ml.Choropleth.classify(vlayer, property_name="density_km2", method="quantiles", color_ramp="viridis")
mm.panel(1).title = "2. Population Density"
mm.panel(1).add_layer(pop_choro)

# 4. Panel 3: Flood hazard exposure score
risk_choro = ml.Choropleth.classify(vlayer, property_name="flood_risk_score", method="equal_interval", color_ramp="magma")
mm.panel(2).title = "3. Flood Hazard Exposure"
mm.panel(2).add_layer(risk_choro)

# 5. Panel 4: Future 2030 Master Zoning Plan
mm.panel(3).title = "4. Future Master Plan 2030"
mm.panel(3).add_layer("zoning_plan.geojson", fill_color="#10b981", fill_opacity=0.6)

# 6. Save as standalone interactive HTML dashboard
mm.to_html("urban_assessment_dashboard.html")

# 7. Render inline in Jupyter Notebook / Google Colab
mm.show()
2. Draggable Split-Screen Curtain Swipe Comparison
import multilayer as ml

swipe = ml.SwipeMap(
    left_layer="landcover_2010.geojson",
    right_layer="landcover_2026.geojson",
    left_title="Historical (2010)",
    right_title="Current (2026)",
    basemap="satellite"
)

swipe.to_html("deforestation_swipe.html")
💻 Command Line Interface (CLI)
# 1. Build a 2x2 synchronized dashboard from 4 GeoJSON files
multilayer build --layers bldgs.geojson,roads.geojson,hazard.geojson,zoning.geojson --grid 2x2 --out city_dashboard.html --open

# 2. Build a 2-panel before/after split-screen swipe comparison
multilayer compare flood_2020.geojson flood_2026.geojson --left-title "2020 Flood" --right-title "2026 Flood" --out flood_swipe.html

# 3. Inspect GeoJSON feature count, properties, and bounding box
multilayer inspect study_area.geojson

# 4. List all built-in web map tile basemaps
multilayer tiles
⚙️ Supported Grid Matrices
| Grid Preset | Layout Dimensions | Panel Count | Primary Cartographic Use Case |
|---|---|---|---|
1x2 |
1 Row $\times$ 2 Columns | 2 Panels | Before/After comparisons, Suitability vs Actual zoning |
2x1 |
2 Rows $\times$ 1 Column | 2 Panels | Vertical elevation profiles, transport corridors |
1x3 |
1 Row $\times$ 3 Columns | 3 Panels | Past $\rightarrow$ Present $\rightarrow$ Future temporal timelines |
2x2 |
2 Rows $\times$ 2 Columns | 4 Panels | 4-way evaluation (Base, Demographics, Hazards, Policy) |
2x3 |
2 Rows $\times$ 3 Columns | 6 Panels | Multi-criteria evaluation (MCDA factor grids) |
2x4 |
2 Rows $\times$ 4 Columns | 8 Panels | High-density multi-scenario sensitivity snapshots |
📄 Academic Citation
If you use multilayer-sdk in scientific publications, planning projects, or research, please cite:
@software{eminoglu2026multilayer,
  author    = {Emino{\\u{g}}lu, Yusuf},
  title     = {{multilayer-sdk: Pure-Python Synchronized Multi-Panel Map Visualization, Spatial Comparison Engine, and Interactive Dashboard Builder}},
  year      = {2026},
  publisher = {PyPI - Python Package Index},
  version   = {0.1.0},
  url       = {https://gitlab.com/geospacephilo/multilayer-sdk}
}
📜 License
Distributed under the MIT License. Copyright (c) 2026 Yusuf Eminoğlu.
1 maintainer

Metadata
1 maintainer
Release files for multilayer-sdk 0.12.1
For a detailed explanation of source distributions (sdists) and built distributions (wheels), please see the package formats documentation.
Source distribution (sdist)
| File | Size | Uploaded | |
|---|---|---|---|
| multilayer_sdk-0.12.1.tar.gz | 56.7 kB | Details |
Built distribution (wheel)
| File | Interpreter | ABI | Platform | Reset |
|---|---|---|---|---|
| multilayer_sdk-0.12.1-py3-none-any.whl | Python 3 | none | any | Details |
Total release size: 124.0 kB
Release files / multilayer_sdk-0.12.1.tar.gz
| Download URL | multilayer_sdk-0.12.1.tar.gz |
|---|---|
| Size | 56.7 kB |
| Tags | Source |
|
SHA-256 checksum How to use checksums |
f78cce4ab67584ce7899fa59317bc5e4a76e654e0487e372caeb315475d472c5
|
|
BLAKE2b-256 checksum How to use checksums |
5ffde0f1b23344ed927278442f00907f55fb0ac099bbd20b5b1b6d4b41305947
|
| Upload date | |
|
Uploaded using Trusted Publishing? What is trusted publishing? |
No |
| Uploaded via |
twine/7.0.0 CPython/3.14.3
|
Release files / multilayer_sdk-0.12.1-py3-none-any.whl
| Download URL | multilayer_sdk-0.12.1-py3-none-any.whl |
|---|---|
| Size | 67.4 kB |
| Tags | Python 3 |
|
SHA-256 checksum How to use checksums |
10582696c2533503c434ef2601b858945258b0fa467a0dc05c5b5d081f07d694
|
|
BLAKE2b-256 checksum How to use checksums |
36d74ae9cae47fa4f878832415be806fa4ae069e532fb41e3e05b08c91ad83b3
|
| Upload date | |
|
Uploaded using Trusted Publishing? What is trusted publishing? |
No |
| Uploaded via |
twine/7.0.0 CPython/3.14.3
|














