Multiplex: visualizations that tell stories—A Python library to create and annotate beautiful network graph visualizations, text visualizations and more.

Project description

Multiplex
Visualizations should tell a story, and tell it in a beautiful way. Multiplex is a visualization library for Python built on these principles using matplotlib. This library aims to make it as easy as possible for you to transform data into beautiful visualizations that tell a story.
The instructions in this README.md file will get you a copy of the project up and running. For use-cases of Multiplex, check out the Jupyter Notebook examples. To read more about Multiplex, read the documentation.
Who is Multiplex for?
Multiplex is aimed at data scientists, researchers, students and all those who work with data and are familiar with Python.
Why should I use Multiplex?
If Multiplex is based on matplotlib, why not use matplotlib directly?
Multiplex does not replace matplotlib. Anything that you can do with Multiplex, you can also do with matplotlib.
Multiplex makes it easier to create beautiful visualizations. This is achieved by providing:
- 4 custom matplotlib styles;
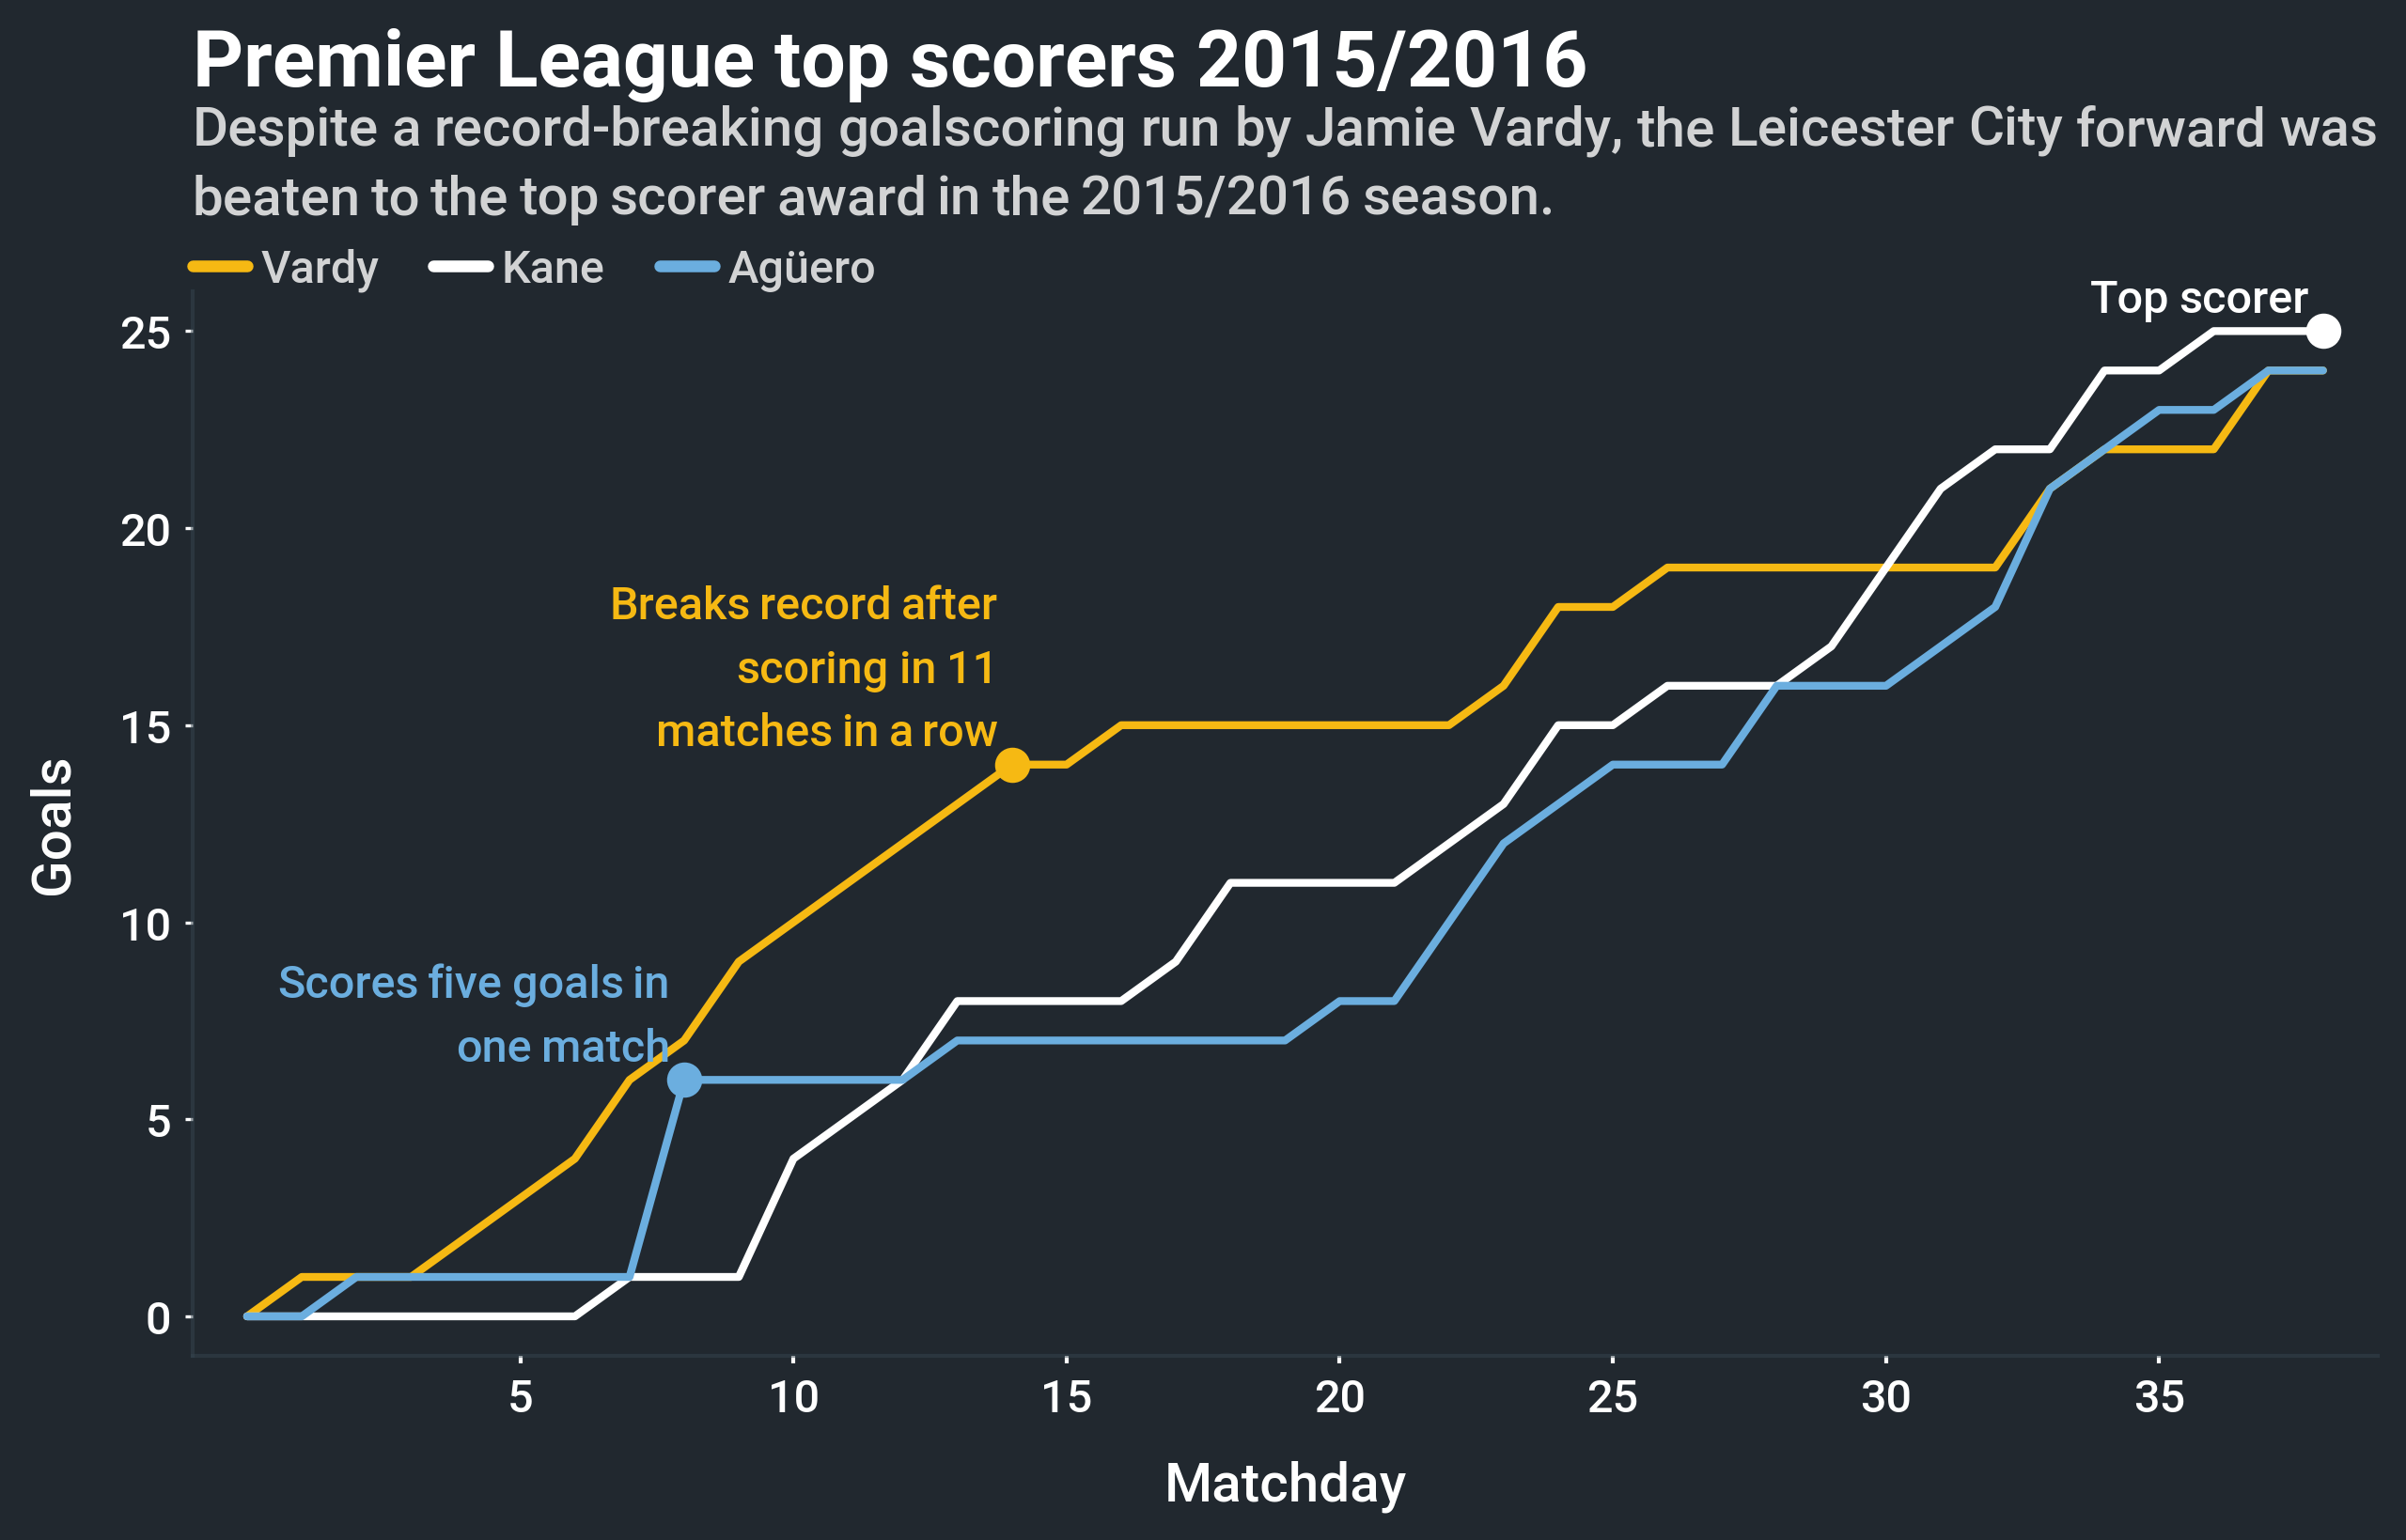
- Functionality to caption visualizations;
- Functionality to annotate any visualization with text; and
- New types of visualizations not available in matplotlib:
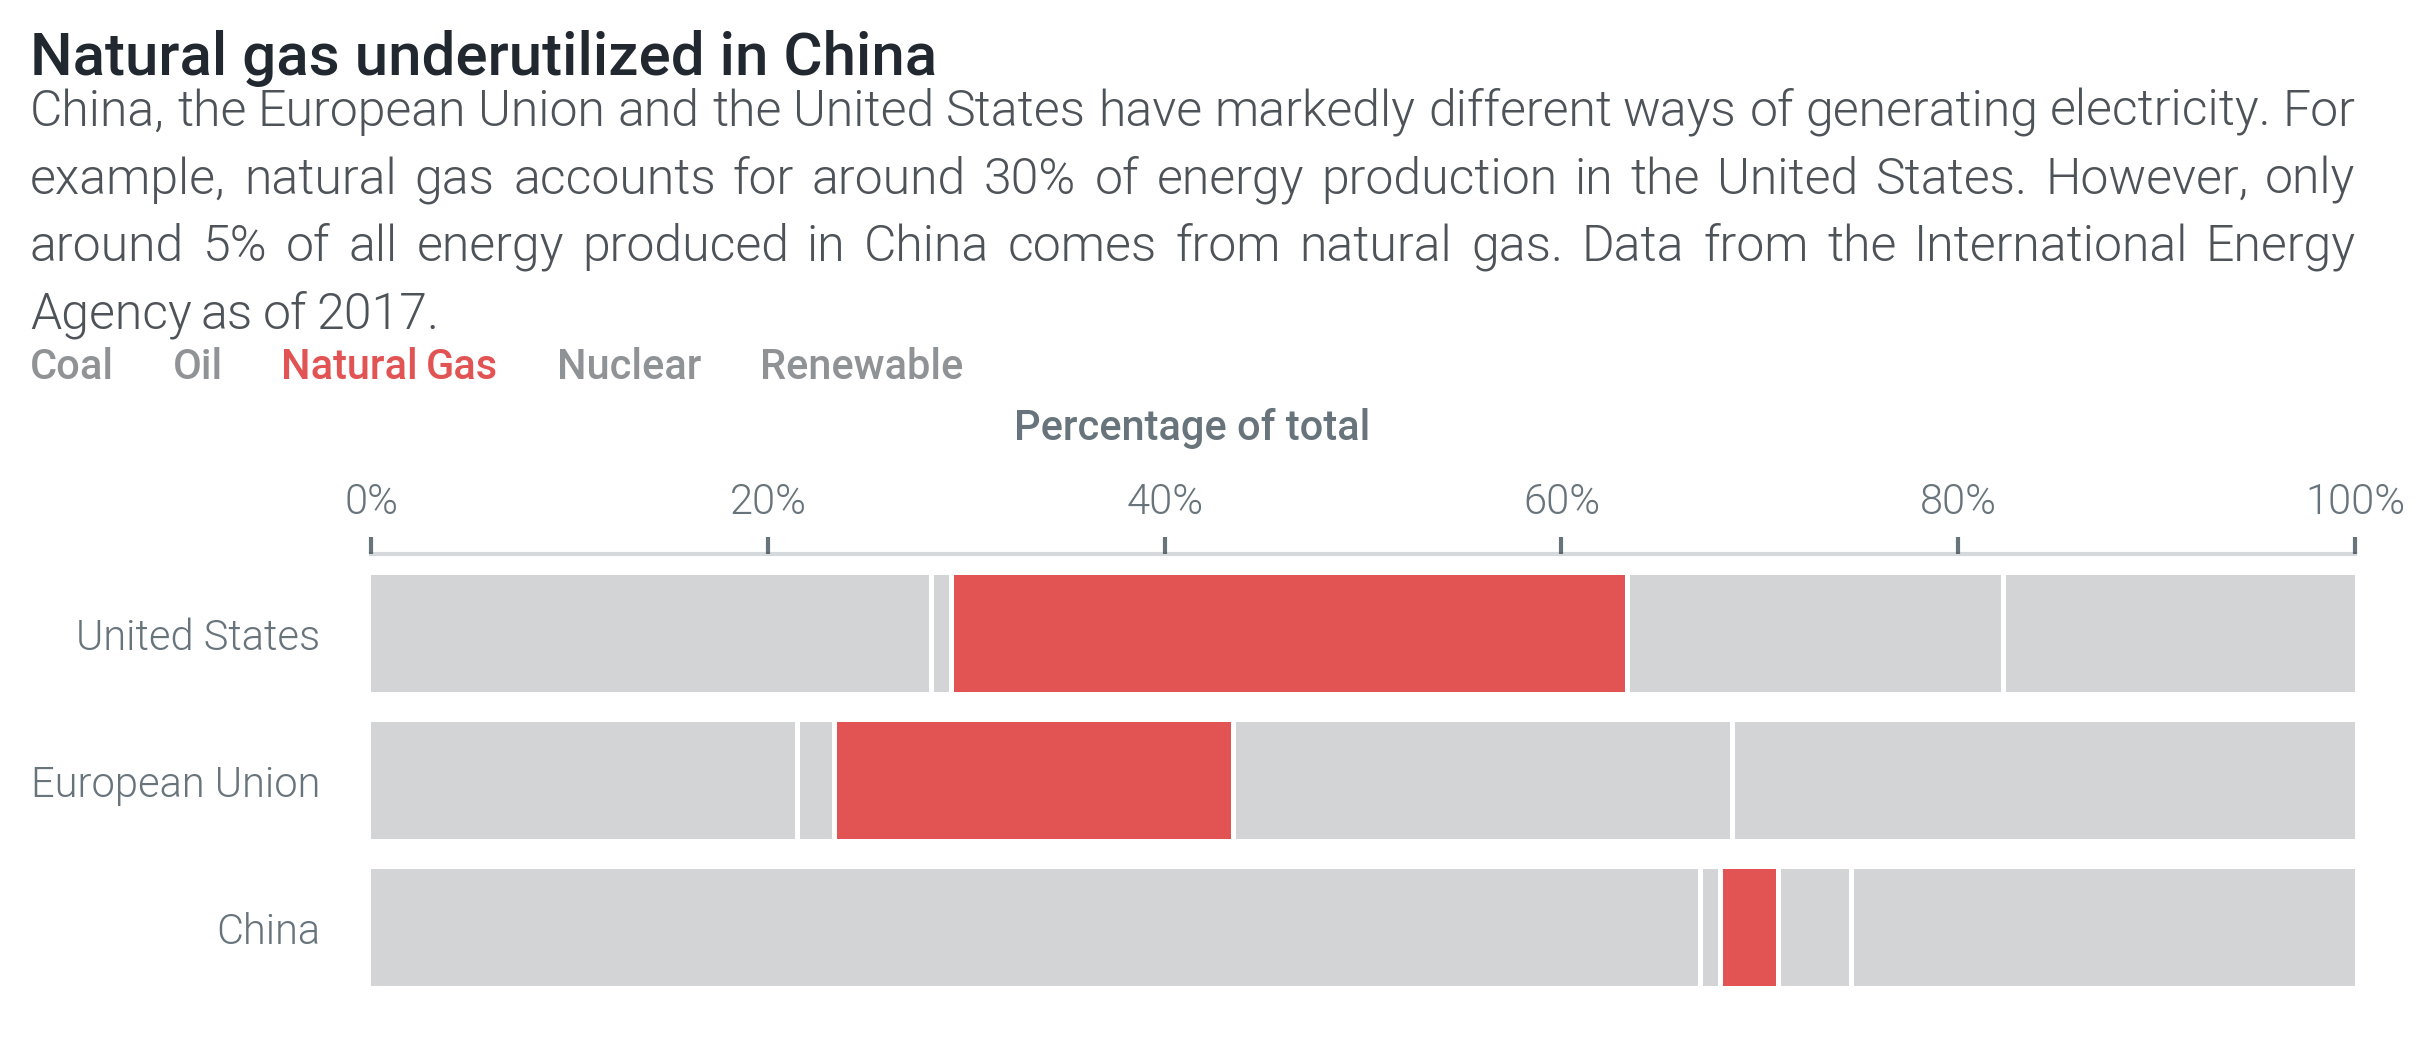
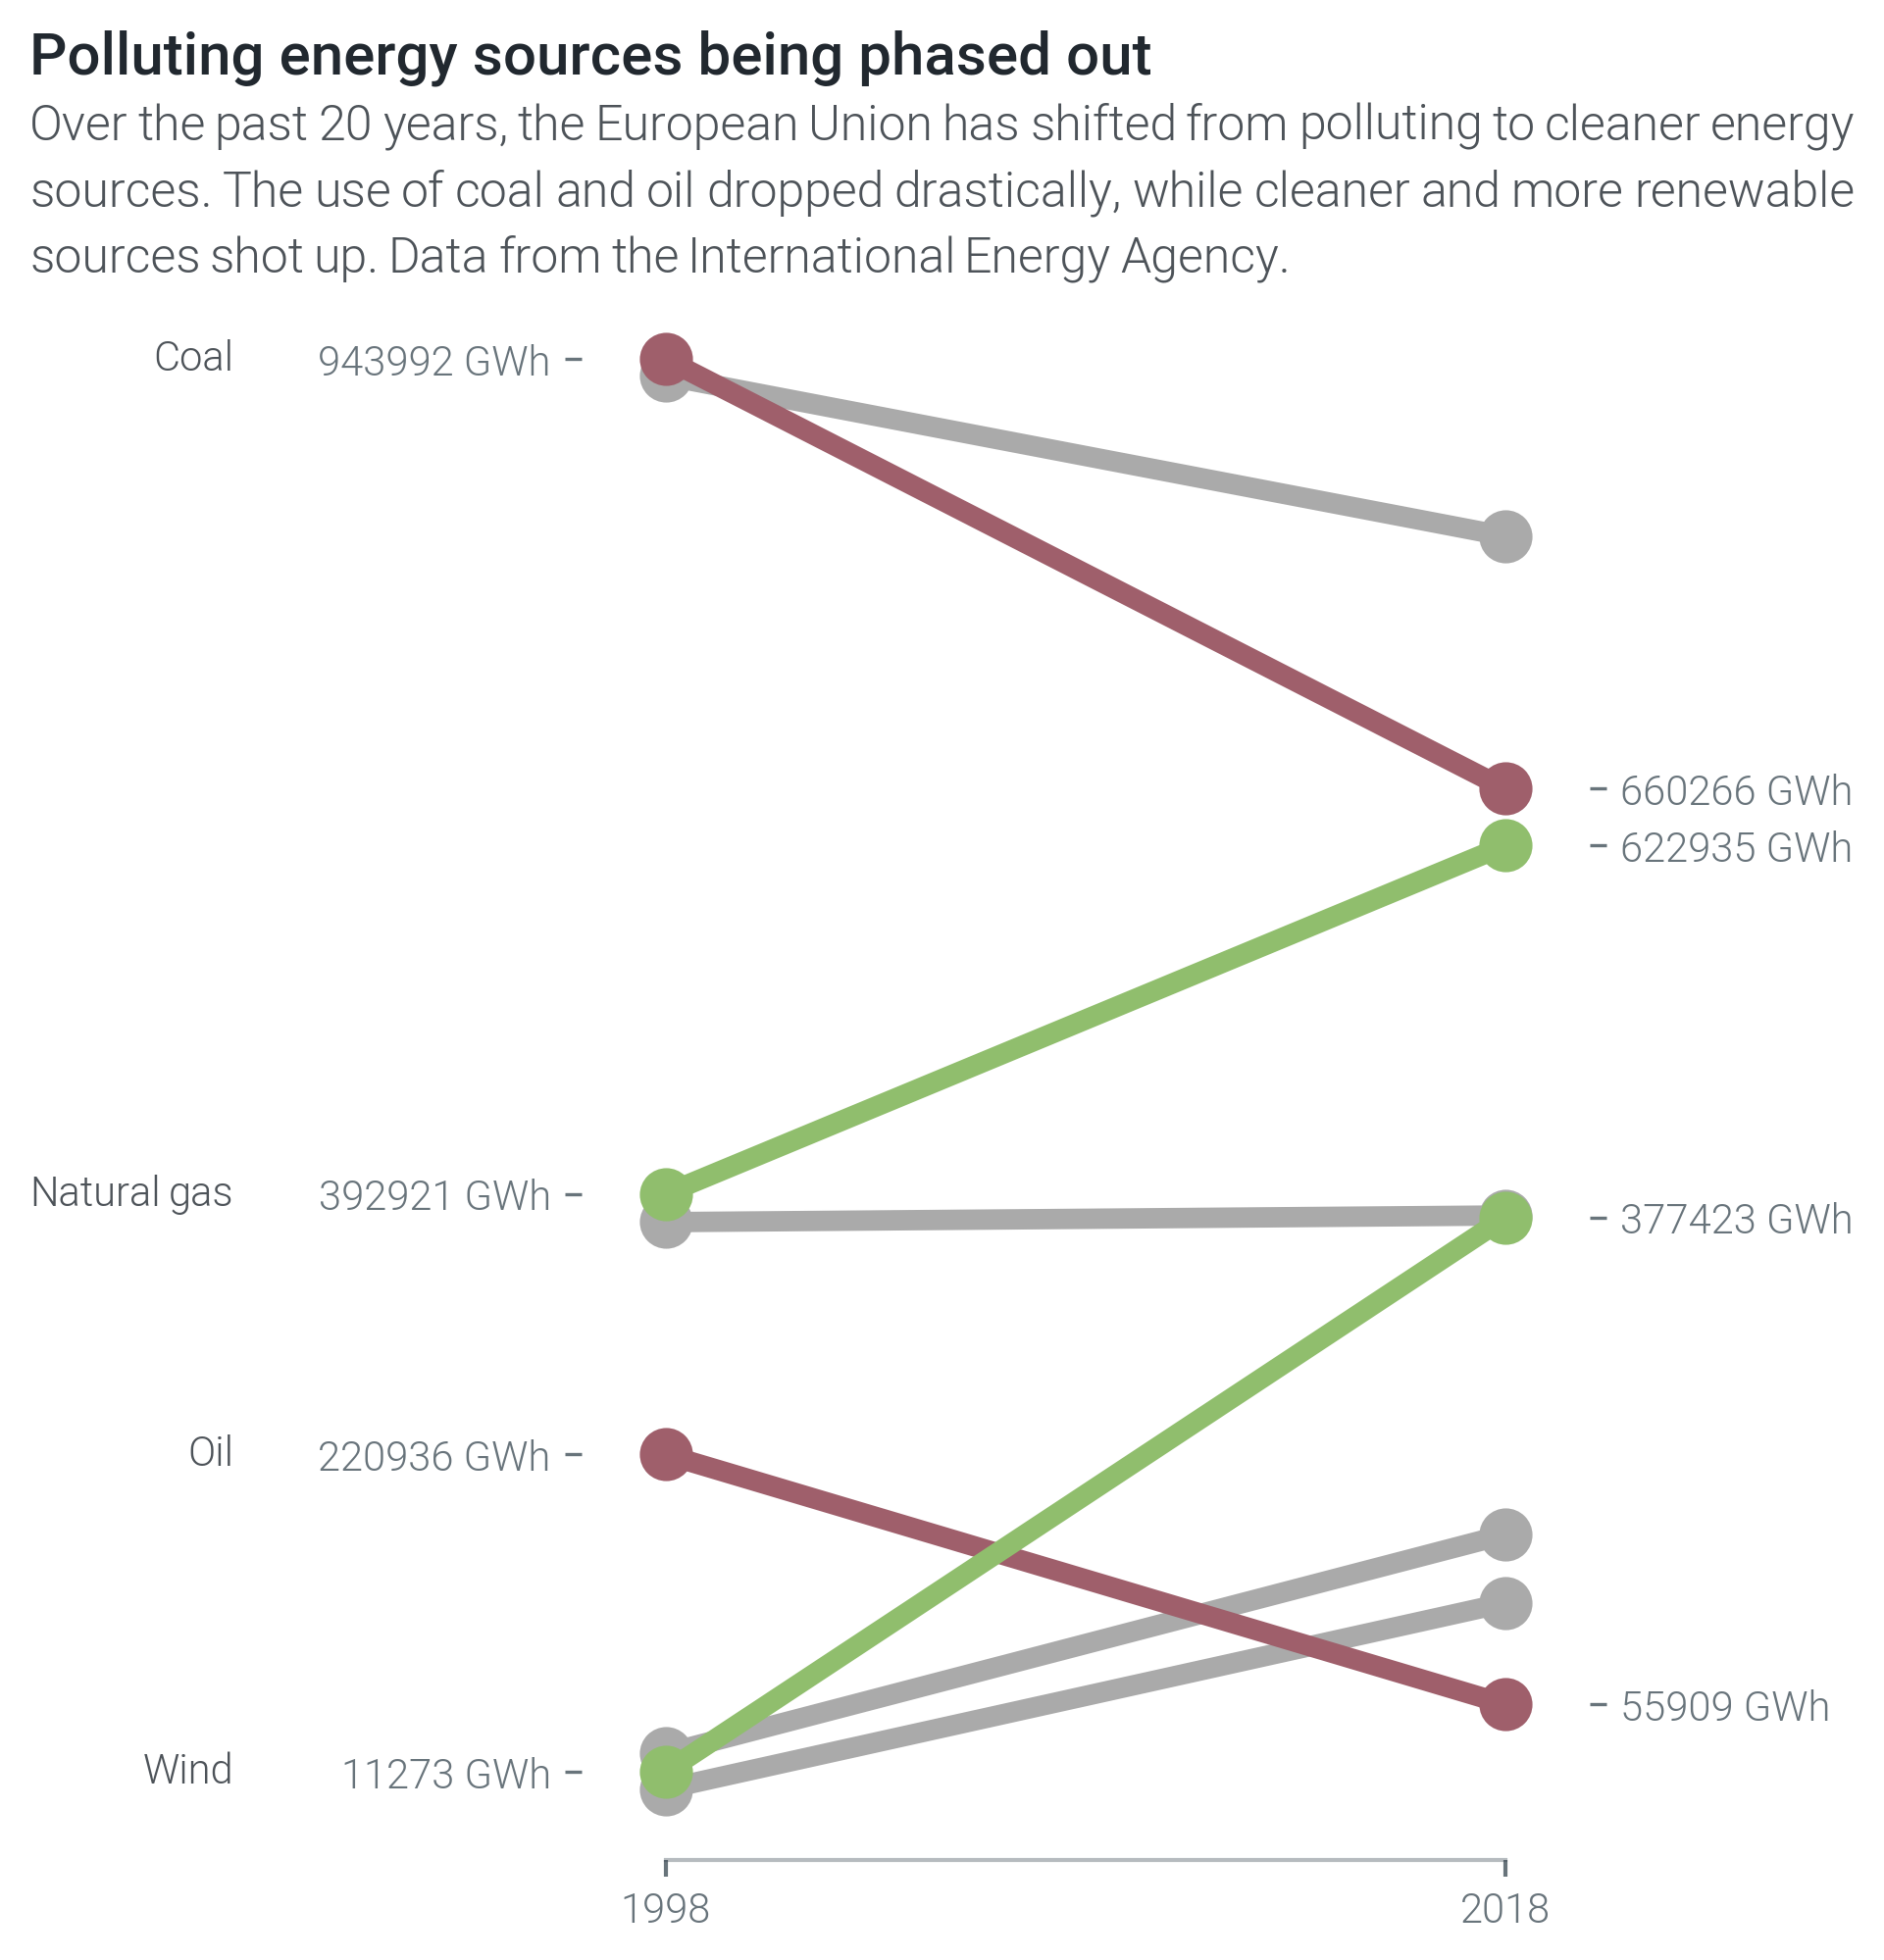
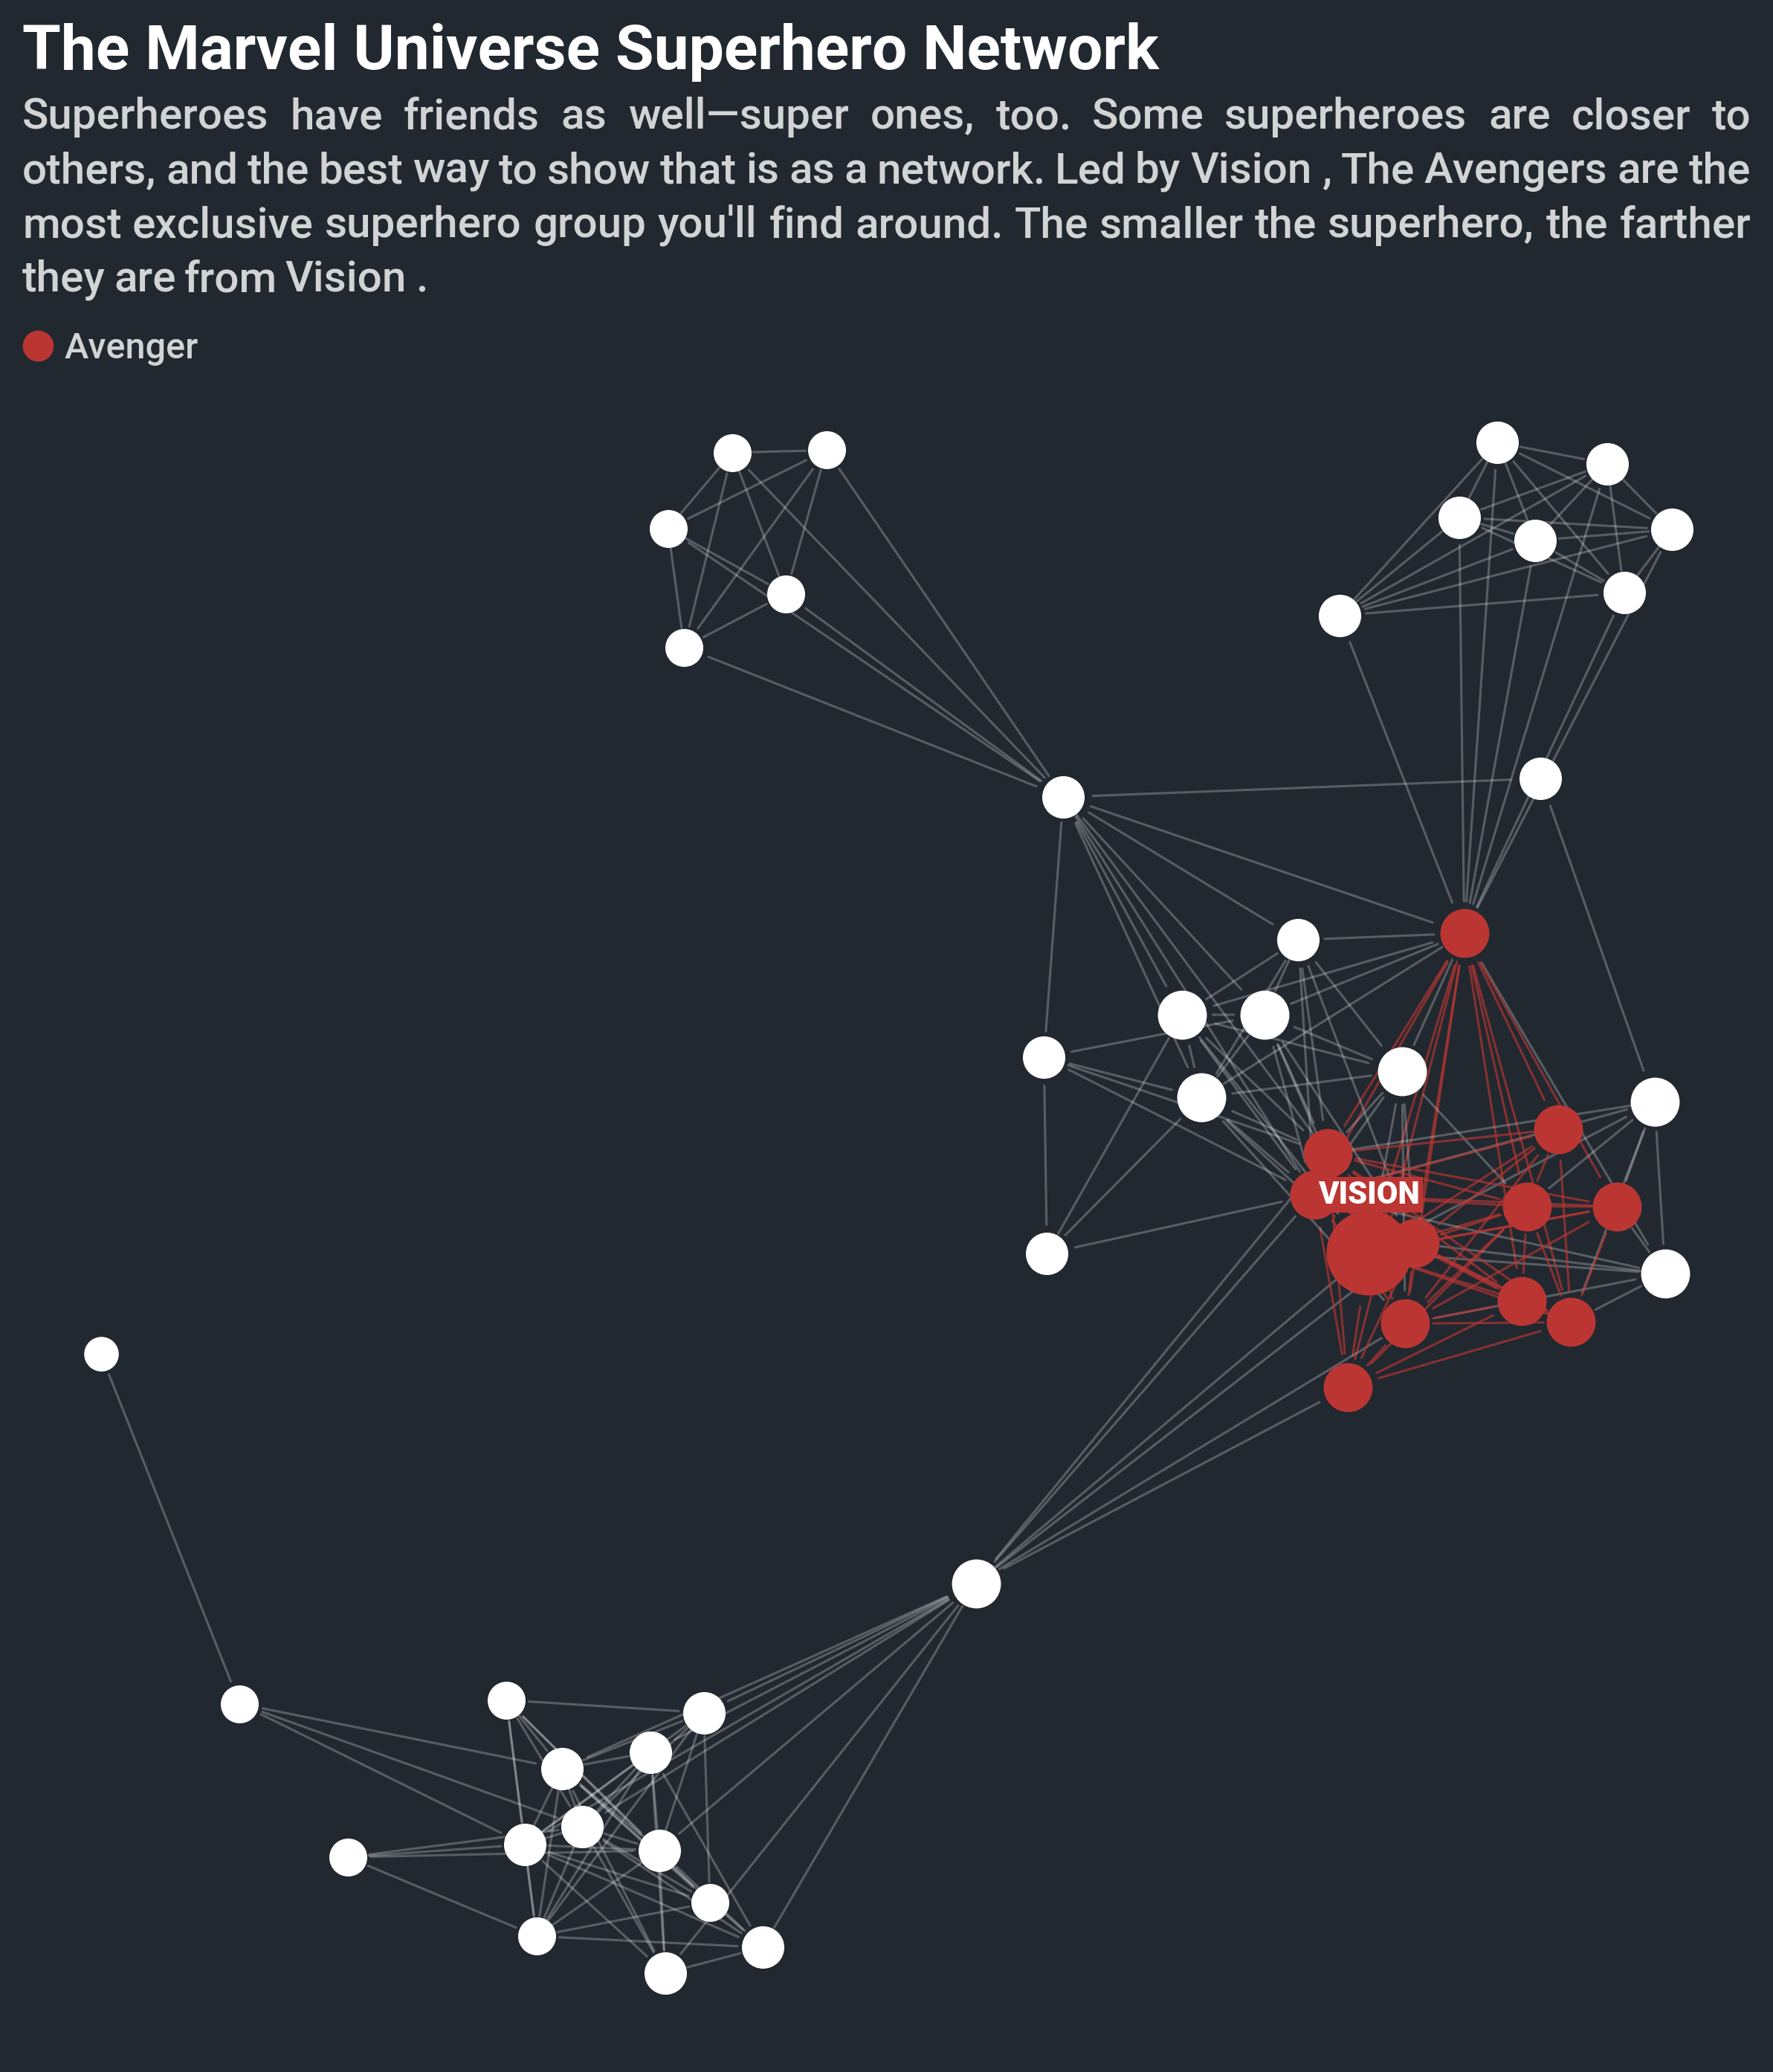
- 100% bar chart,
- Network graph,
- Slope graph,
- Population chart, and
- Text-only visualizations.
Multiplex automatically lays out your data so that you can focus on telling your story.
How do I use Multiplex?
Prerequisites
Multiplex is based on matplotlib.
You can install matplotlib using pip: python -m pip install -U matplotlib.
More details about it are available in matplotlib's repository.
Multiplex also uses the following libraries in certain visualizations:
Installing
You can install Multiplex using pip: python -m pip install -U multiplex-plot.
Quickstart
Creating visualizations with Multiplex is very easy. For example, you can create a text-only visualization in just 10 lines of code, including all styling options:
import matplotlib.pyplot as plt
from multiplex import drawable
plt.style.use('styles/multiplex.style')
viz = drawable.Drawable(plt.figure(figsize=(10, 2)))
paragraph = """Anthony Lopes is a Portuguese professional footballer who plays for Olympique Lyonnais as a goalkeeper. He came through the youth ranks at Lyon, being called to the first team in 2011 and making his debut the following year."""
style = { 'align': 'justify', 'fontfamily': 'serif', 'alpha': 0.9, 'lineheight': 1.25, 'lpad': 0.1, 'rpad': 0.1 }
viz.draw_text_annotation(paragraph, **style)
viz.set_title('Profile: Anthony Lopes', loc='left')
viz.set_caption("""Wikipedia is a useful repository to get more information about anything. Below is an excerpt from the Wikipedia profile of footballer Anthony Lopes.""")
viz.show()

All it takes to draw a simple text visualization is 10 lines of code:
- 3 lines to import matplotlib, Multiplex and the visualization style;
- 3 lines to set up the visualization object, load the data and set the style;
- 4 lines to draw and show the visualization, including a title and caption.
Multiplex does all the tedious work for you: the layout, alignment and more. At the same time, you can take as much control as you want.
Using Multiplex is very easy, but you can get started by checking out the Jupyter Notebook tutorials for an easy-to-follow tour of Multiplex's capabilities.
Example visualizations
Built with
Versioning
We use SemVer for versioning. For the versions available, see the tags on this repository.
Authors
- Nicholas Mamo - Library development - NicholasMamo
License
This project is licensed under the GNU General Public License v3.0 - see the LICENSE file for details
Acknowledgments
- PurpleBooth for this README template
- Cole Nussbaumer Knaflic's Storytelling with Data for the inspiration
Release history Release notifications | RSS feed


Download files
Download the file for your platform. If you're not sure which to choose, learn more about installing packages.
Source Distribution
File details
Details for the file multiplex-plot-0.5.0.tar.gz.
File metadata
- Download URL: multiplex-plot-0.5.0.tar.gz
- Upload date:
- Size: 78.2 kB
- Tags: Source
- Uploaded using Trusted Publishing? No
- Uploaded via: twine/3.3.0 pkginfo/1.7.0 requests/2.22.0 setuptools/45.2.0 requests-toolbelt/0.9.1 tqdm/4.50.2 CPython/3.8.5
File hashes
| Algorithm | Hash digest | |
|---|---|---|
| SHA256 |
3034dc4d179b6c5b79b922894f10887ad447da0c0c6aa61fc0c1ff81ce81f891
|
|
| MD5 |
618cfa1ed4ac7826f9f8cedeb10f6cd0
|
|
| BLAKE2b-256 |
9697c323fc64838b4c7647bf24ea4b8d3f911f82493c5b7a833f701b55523cb9
|


