
MUSE: cross-species single-cell multi-omics data integration

Project description
MUSE
Description
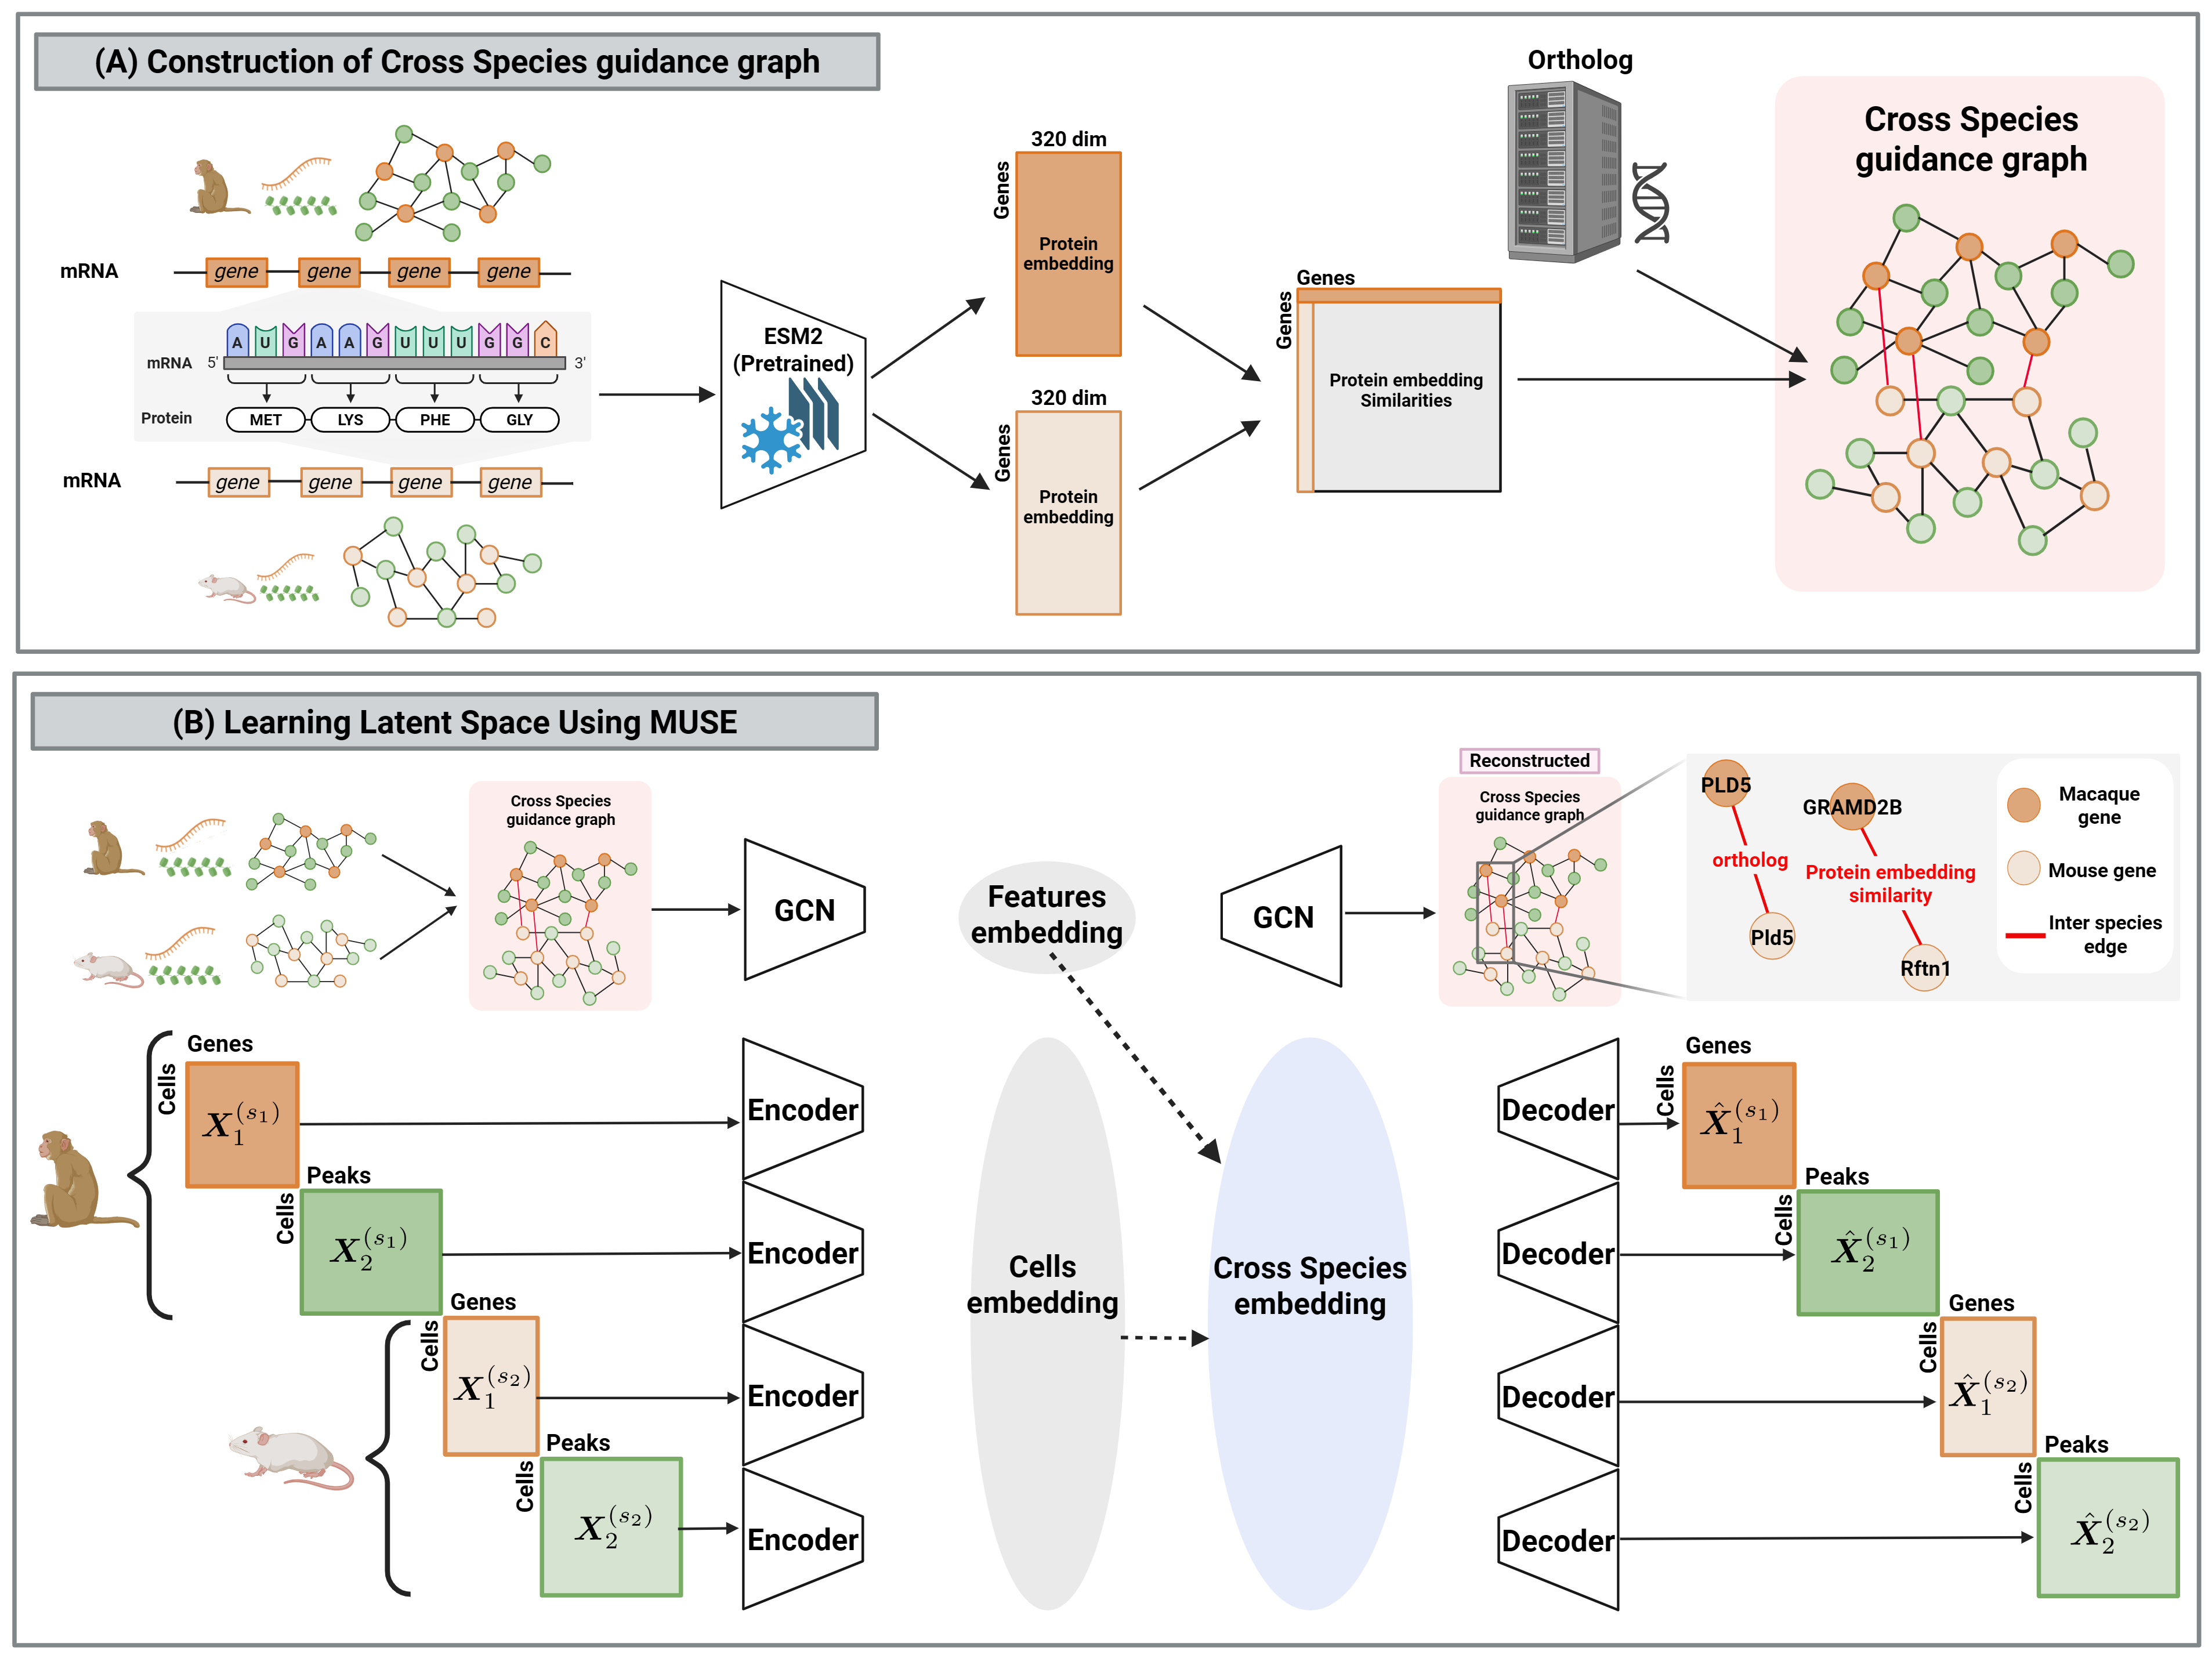
MUSE is a method for cross species multiomics data integration.
This model offers three main analyses:
- Construction of cross species guidance graph
- Integration of cross species multiomics data
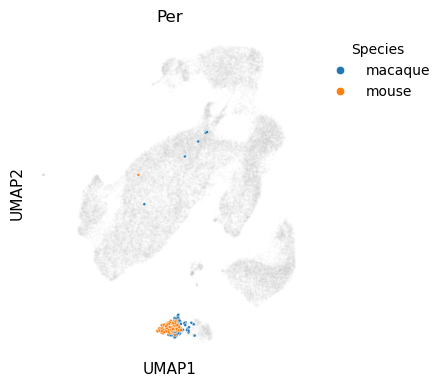
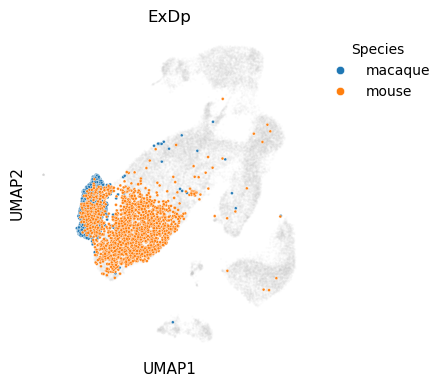
- UMAP projection of the integrated latent space
MUSE framework
Installation
- Clone the repository
git clone https://github.com/NakaeFuka/MUSE.git
cd MUSE
- Create the conda environment
conda env create -f environment.yaml
conda activate muse-dev
- Install MUSE
From PyPI:
pip install museclue
Or from source:
pip install .
Verify installation
python -c "import museclue; print('MUSE installed successfully')"
Dependencies
Python >= 3.8
torch >= 2.4.1
scanpy >= 1.9.8
anndata >= 0.9.2
numpy >= 1.24
scipy >= 1.10.1
pandas >= 2.0.3
scikit-learn >= 1.3.2
networkx >= 3.1
igraph >= 0.10.3
leidenalg >= 0.9.1
Build Cross Speceis guidance graph
Run the command below to build a cross-species guidance graph between macaque and mouse
python3 /code/construct_cross_species_graph.py \
  --sp1 macaque \
  --sp2 mouse \
  --ensembl_sp1 macaca_mulatta \
  --ensembl_sp2 mus_musculus \
  --rna1 /MUSE/data/A82B_macaque_pp_rna_1852genes_with_protein_embedding.h5ad \
  --atac1 /MUSE/data/A82B_macaque_pp_atac_25087peaks.h5ad \
  --rna2 /MUSE/data/E145_2_mouse_pp_rna_2141genes_with_protein_embedding.h5ad \
  --atac2 /MUSE/data/E145_2_mouse_pp_atac_20985peaks.h5ad \
  --gene_id_col gene_id \
  --embedding_key X_protein \
  --thr_min 0.70 --thr_max 1.00 --thr_step 0.01 \
  --agg max \
  --out_graph /graph/macaque_mouse.guidance.graphml.gz
MUSE training
In this tutolial, we present an application of MUSE using two species (macaque and mouse) multiomics datesets (GSE241429). A cross-species guidance graph is first constructed based on ortholog relationships and protein embedding similarities. The model is then trained using the constructed guidance graph together with the individual datasets from each species.
# ----------------
# Train MUSE model
# ----------------
muse = museclue.models.fit_SCGLUE(
    {
        "macaque_rna": macaque_rna,
        "macaque_atac": macaque_atac,
        "mouse_rna": mouse_rna,
        "mouse_atac": mouse_atac,
    },
    guidance_graph,
    model=museclue.models.SCGLUEModel,
    fit_kws={"directory": str(RUN_DIR)},
)

print("[INFO] Training finished.")
Visualization
First, load the trained model and obtain the embeddings from the trained model.
trained_model = museclue.models.load_model(MODEL_PATH)
macaque_rna.obsm["X_muse"] = trained_model.encode_data("macaque_rna", macaque_rna)
macaque_atac.obsm["X_muse"] = trained_model.encode_data("macaque_atac", macaque_atac)
mouse_rna.obsm["X_muse"] = trained_model.encode_data("mouse_rna", mouse_rna)
mouse_atac.obsm["X_muse"] = trained_model.encode_data("mouse_atac", mouse_atac)
Necessary metadata labels (domain and species) were added to each AnnData object, and all datasets were concatenated into a single AnnData object.
macaque_rna.obs["domain"] = "rna"
macaque_atac.obs["domain"] = "atac"
macaque_combined = ad.concat([macaque_rna, macaque_atac])

mouse_rna.obs["domain"] = "rna"
mouse_atac.obs["domain"] = "atac"
mouse_combined = ad.concat([mouse_rna, mouse_atac])

macaque_rna.obs["domain"] = "macaque_rna"
macaque_atac.obs["domain"] = "macaque_atac"
mouse_rna.obs["domain"] = "mouse_rna"
mouse_atac.obs["domain"] = "mouse_atac"
macaque_rna.obs["species"] = "macaque"
macaque_atac.obs["species"] = "macaque"
mouse_rna.obs["species"] = "mouse"
mouse_atac.obs["species"] = "mouse"

all_combined = ad.concat([macaque_rna, macaque_atac, mouse_rna, mouse_atac])
Using the concatenated AnnData object, UMAP was visualized for each cell-type label, with cells colored by species.
import numpy as np
import matplotlib as mpl
import matplotlib.pyplot as plt
import scanpy as sc

# =========================
# Paper-style matplotlib settings
# =========================
mpl.rcParams.update({
    "pdf.fonttype": 42,
    "ps.fonttype": 42,
    "font.size": 11,
    "axes.titlesize": 12,
    "axes.labelsize": 11,
    "legend.fontsize": 10,
    "legend.title_fontsize": 10,
})

# Cell types to highlight (kept as in the original code)
target_celltypes = ['Per', 'ExDp']

# Work on a copy to avoid chained assignment / view warnings
adata = all_combined.copy()
adata.obs_names_make_unique()
adata.obs.index = adata.obs.index.astype(str)

# Species list (preserve the existing order in the AnnData)
species_list = adata.obs["species"].unique()

# Recompute neighbors/UMAP using the integrated embedding
if "X_muse" not in adata.obsm:
    raise KeyError("adata.obsm['X_muse'] is missing. Please confirm the integrated embedding exists.")

sc.pp.neighbors(adata, use_rep="X_muse", metric="cosine")
sc.tl.umap(adata, random_state=0)

# =========================
# Publication-oriented UMAP styling
# =========================
POINT_SIZE_FG = 18
POINT_SIZE_BG = 8
ALPHA_BG = 0.06
ALPHA_FG = 0.95
EDGE_COLOR = "white"
EDGE_LW = 0.25

# Background (non-highlighted cells)
OUT_COLOR = "#C8C8C8"

# Fixed species colors (tab10)
tab10 = mpl.colormaps["tab10"].colors
species_color = {sp: tab10[i % len(tab10)] for i, sp in enumerate(species_list)}

# =========================
# UMAP highlighting per cell type
# =========================
for ct in target_celltypes:
    # Initialize highlight labels ("Out" for background)
    adata.obs["highlight"] = np.full(adata.n_obs, "Out", dtype=object)

    # Assign labels for the target cell type per species
    found = False
    for sp in species_list:
        mask = (adata.obs["cell_type"] == ct) & (adata.obs["species"] == sp)
        if mask.any():
            adata.obs.loc[mask, "highlight"] = f"{ct} ({sp})"
            found = True

    if not found:
        print(f"Skipping {ct} — no matching cells found.")
        continue

    # Keep only labels that actually exist
    target_labels = [
        f"{ct} ({sp})"
        for sp in species_list
        if f"{ct} ({sp})" in adata.obs["highlight"].unique()
    ]

    # Palette: background + per-species colors
    palette = {"Out": OUT_COLOR}
    for sp in species_list:
        lab = f"{ct} ({sp})"
        if lab in target_labels:
            palette[lab] = species_color[sp]

    fig, ax = plt.subplots(figsize=(4.6, 4.0))

    # Background layer
    out_mask = adata.obs["highlight"] == "Out"
    if out_mask.any():
        sc.pl.umap(
            adata[out_mask].copy(),
            color="highlight",
            palette=palette,
            size=POINT_SIZE_BG,
            alpha=ALPHA_BG,
            zorder=1,
            show=False,
            ax=ax,
        )

    # Foreground (highlighted cells)
    fg_mask = adata.obs["highlight"].isin(target_labels)
    if fg_mask.any():
        sc.pl.umap(
            adata[fg_mask].copy(),
            color="highlight",
            palette=palette,
            size=POINT_SIZE_FG,
            alpha=ALPHA_FG,
            zorder=2,
            show=False,
            ax=ax,
            edgecolor=EDGE_COLOR,
            linewidth=EDGE_LW,
        )

    # Minimal axes for figure panels
    ax.set_title(ct, pad=6)
    ax.set_xticks([])
    ax.set_yticks([])
    for spine in ax.spines.values():
        spine.set_visible(False)

    # Legend showing species only
    legend_handles = []
    for sp in species_list:
        lab = f"{ct} ({sp})"
        if lab in palette:
            legend_handles.append(
                plt.Line2D(
                    [0], [0],
                    marker="o",
                    linestyle="",
                    label=sp,
                    markerfacecolor=palette[lab],
                    markeredgecolor=EDGE_COLOR,
                    markeredgewidth=0.4,
                    markersize=6,
                )
            )

    ax.legend(
        handles=legend_handles,
        title="Species",
        frameon=False,
        loc="upper left",
        bbox_to_anchor=(1.02, 1.0),
    )

    plt.tight_layout()
    plt.show()
Release history Release notifications | RSS feed

Download files
Download the file for your platform. If you're not sure which to choose, learn more about installing packages.
Source Distribution
Built Distribution
Filter files by name, interpreter, ABI, and platform.
If you're not sure about the file name format, learn more about wheel file names.
Copy a direct link to the current filters
File details
Details for the file museclue-0.1.2.tar.gz.
File metadata
- Download URL: museclue-0.1.2.tar.gz
- Upload date:
- Size: 76.7 kB
- Tags: Source
- Uploaded using Trusted Publishing? No
- Uploaded via: twine/6.2.0 CPython/3.10.19
File hashes
| Algorithm | Hash digest | |
|---|---|---|
| SHA256 |
a9d900339d58dbfd8e8c722f2bb70769477a8dff25317611a4b97e1d0aac2524
|
|
| MD5 |
4eeba9441a40e4ff29a7e214d995cac7
|
|
| BLAKE2b-256 |
7d57bd5378ca83e5b5ac08811c8c493551d19352b46d345f26770b5755d2adc8
|
File details
Details for the file museclue-0.1.2-py3-none-any.whl.
File metadata
- Download URL: museclue-0.1.2-py3-none-any.whl
- Upload date:
- Size: 84.5 kB
- Tags: Python 3
- Uploaded using Trusted Publishing? No
- Uploaded via: twine/6.2.0 CPython/3.10.19
File hashes
| Algorithm | Hash digest | |
|---|---|---|
| SHA256 |
2a91d31c9c3bf990b5de45e7bf99f592634b0a5d5207b73537c91cee13a79a8e
|
|
| MD5 |
b1d0116266b467ca4ac86b5066d892e3
|
|
| BLAKE2b-256 |
78081d50afba86616e8f81f3ad37612318bb1d37125eb53d74efb6b44c709285
|






