Open-source observability for your LLM application.

Project description
MyScale Telemetry
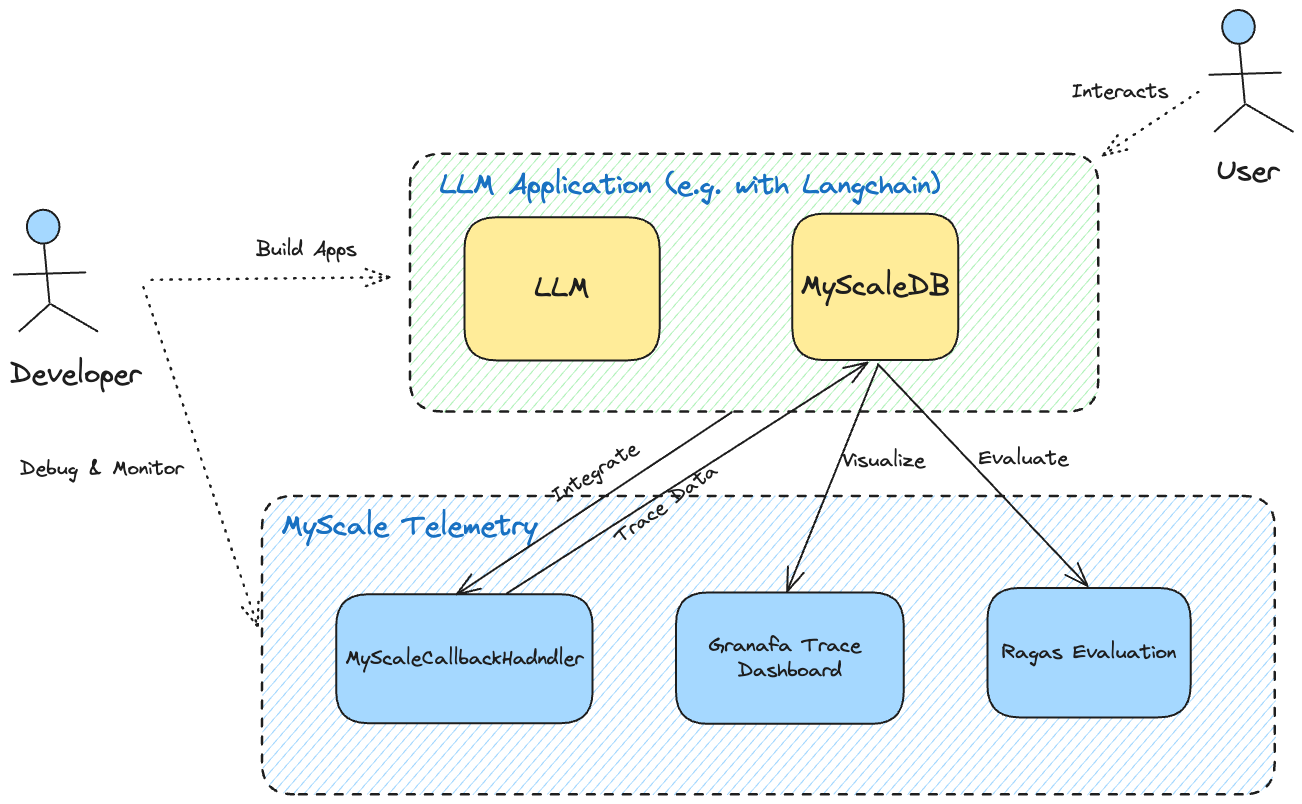
The MyScale Telemetry is a powerful tool designed to enhance the observability of LLM applications by capturing trace data from LangChain-based applications and storing it in MyScaleDB or ClickHouse. This enables developers to diagnose issues, optimize performance, and gain deeper insights into their applications' behavior.
Installation
Install the MyScale Telemetry package using pip:
pip install myscale-telemetry
Usage
Here is an example of how to use the MyScaleCallbackHandler with LangChain:
import os
from operator import itemgetter
from myscale_telemetry.handler import MyScaleCallbackHandler
from langchain_core.output_parsers import StrOutputParser
from langchain_core.prompts import ChatPromptTemplate
from langchain_openai import ChatOpenAI, OpenAIEmbeddings
from langchain_community.vectorstores import MyScale, MyScaleSettings
from langchain_core.runnables import RunnableConfig

# set up the environment variables for OpenAI and MyScale Cloud/MyScaleDB
os.environ["OPENAI_API_KEY"] = "YOUR_OPENAI_KEY"
os.environ["MYSCALE_HOST"] = "YOUR_MYSCALE_HOST"
os.environ["MYSCALE_PORT"] = "YOUR_MYSCALE_PORT"
os.environ["MYSCALE_USERNAME"] = "YOUR_USERNAME"
os.environ["MYSCALE_PASSWORD"] = "YOUR_MYSCALE_PASSWORD"

# for MyScale cloud, you can set index_type="MSTG" for better performance compared to SCANN
vectorstore = MyScale.from_texts(["harrison worked at kensho"], embedding=OpenAIEmbeddings(), config=MyScaleSettings(index_type="SCANN"))
retriever = vectorstore.as_retriever()
model = ChatOpenAI()
template = """Answer the question based only on the following context:
{context}

Question: {question}

"""
prompt = ChatPromptTemplate.from_template(template)

chain = (
    {
    "context": itemgetter("question") | retriever,
    "question": itemgetter("question"),
    }
    | prompt
    | model
    | StrOutputParser()
)

# integrate MyScaleCallbackHandler to capture trace data during the chain execution
chain.invoke({"question": "where did harrison work"}, config=RunnableConfig(
    callbacks=[
        MyScaleCallbackHandler()
    ]
))
In the default scenario, the callback handler generates a trace_id for a single Agent call. However, if you wish to integrate the Trace of the LLM call process with a higher-level caller, you can configure the RunnableConfig to pass in metadata with trace_id as the key during the call, as in the following example:
# trace_id obtained from the upper layer, such as request_id of http request
trace_id = "http-request-id-xxx"
chain.invoke({"question": "where did harrison work"}, config=RunnableConfig(
        callbacks=[
            MyScaleCallbackHandler()
        ],
        metadata={"trace_id": trace_id}
    ))
Custom Parameters
When invoking MyScaleCallbackHandler(), you can specify several parameters to customize its behavior. If not specified, the default values will be used.
myscale_host: MyScale database host (can also be set viaMYSCALE_HOSTenvironment variable)myscale_port: MyScale database port (can also be set viaMYSCALE_PORTenvironment variable)myscale_username: MyScale database username (can also be set viaMYSCALE_USERNAMEenvironment variable)myscale_password: MyScale database password (can also be set viaMYSCALE_PASSWORDenvironment variable)threads: Number of upload threads (default: 1)max_retries: Maximum number of upload retries (default: 10)max_batch_size: Maximum upload batch size (default: 1000)max_task_queue_size: Maximum upload task queue size (default: 10000)upload_interval: Upload interval in seconds (default: 0.5)database_name: Name of the trace database (default: "otel")table_name: Name of the trace table (default: "otel_traces")force_count_tokens: Forces the calculation of LLM token usage, useful when OpenAI LLM streaming is enabled and token usage is not returned (default: False)encoding_name: Name of the encoding used by tiktoken. This is only relevant ifforce_count_tokensis set to True (default: cl100k_base)
Observability
To display trace data collected through the MyScale Telemetry from the LLM Application runtime easily and clearly, we also provide a Grafana Trace Dashboard. The dashboard allows users to monitor the status of the LLM Application which is similar to LangSmith, making it easier to debug and improve its performance.
Requirements
- Grafana
- Official ClickHouse data source for Grafana
- A compatible database instance. MyScale Telemetry supports MyScaleDB, MyScale Cloud, and ClickHouse.
Set up the Trace Dashboard
Once you have Grafana, installed the ClickHouse data source plugin, and have a MyScale cluster with trace data collected through MyScale Telemetry, follow these steps to set up the MyScale Trace Dashboard in Grafana:
-
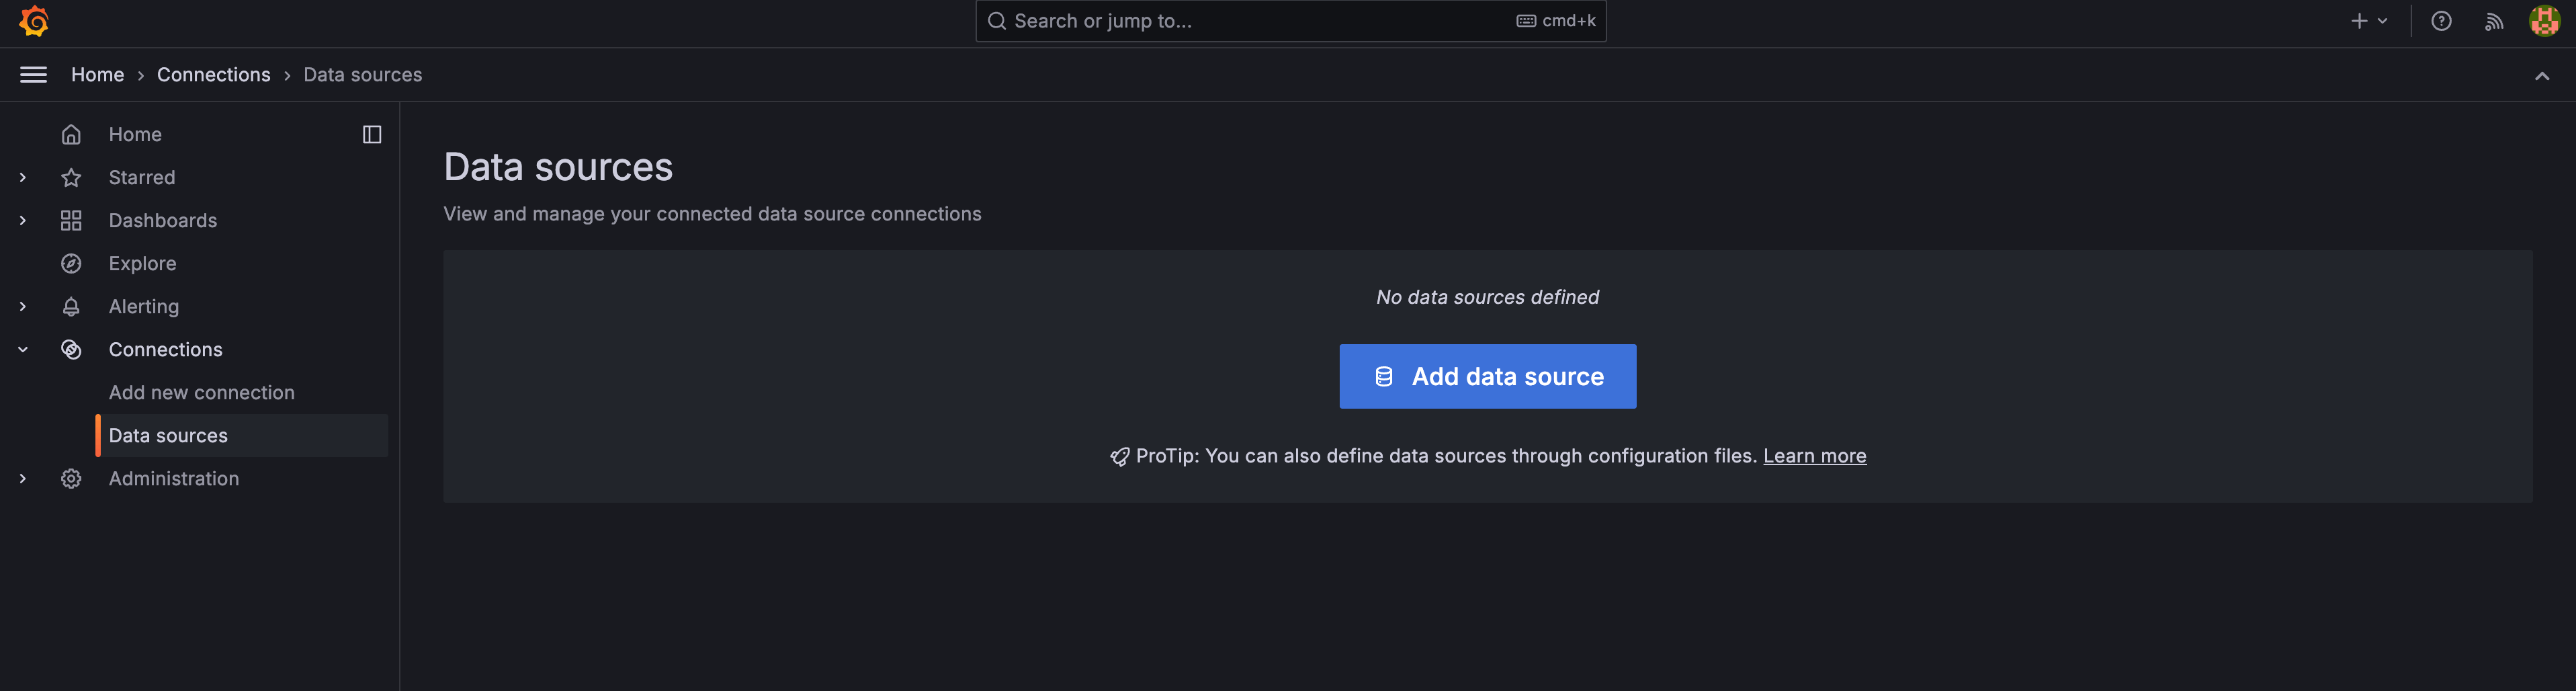
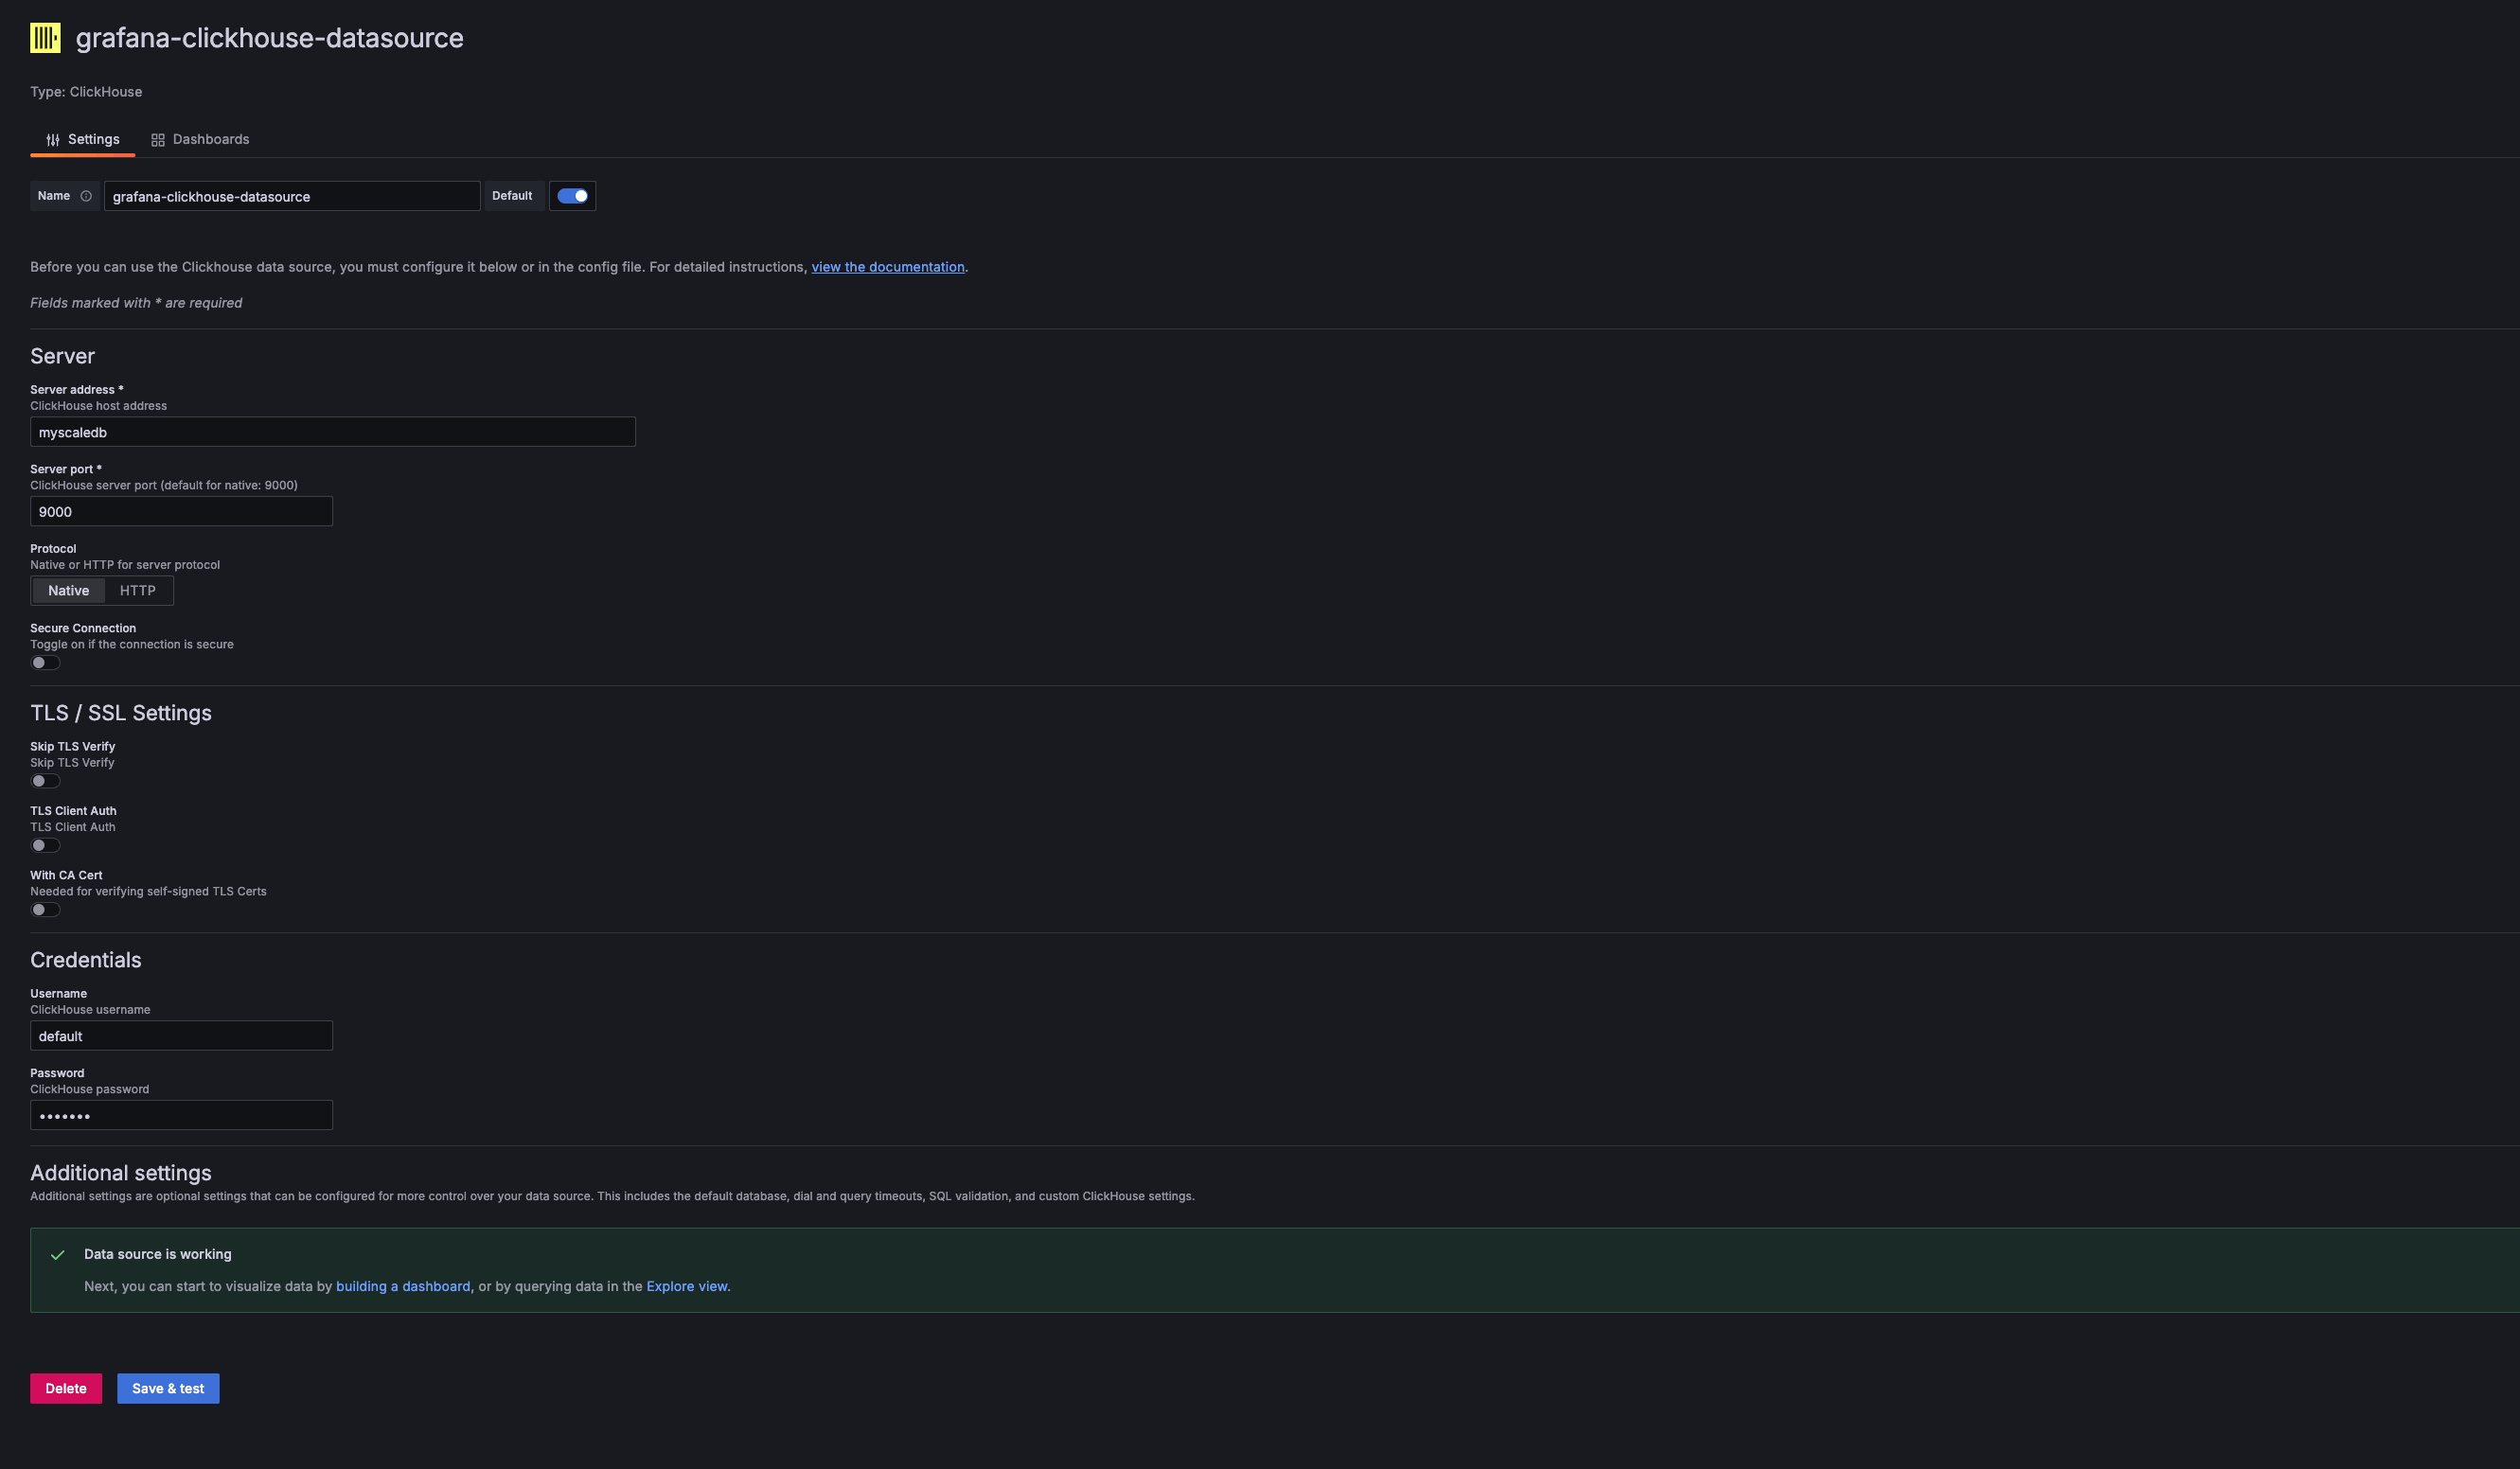
Add a new ClickHouse Data Source in Grafana:
In the Grafana Data Source settings, add a new ClickHouse Data Source. Enter the Server Address, Server Port, Username, and Password to match those of your MyScale Cloud/MyScaleDB.
-
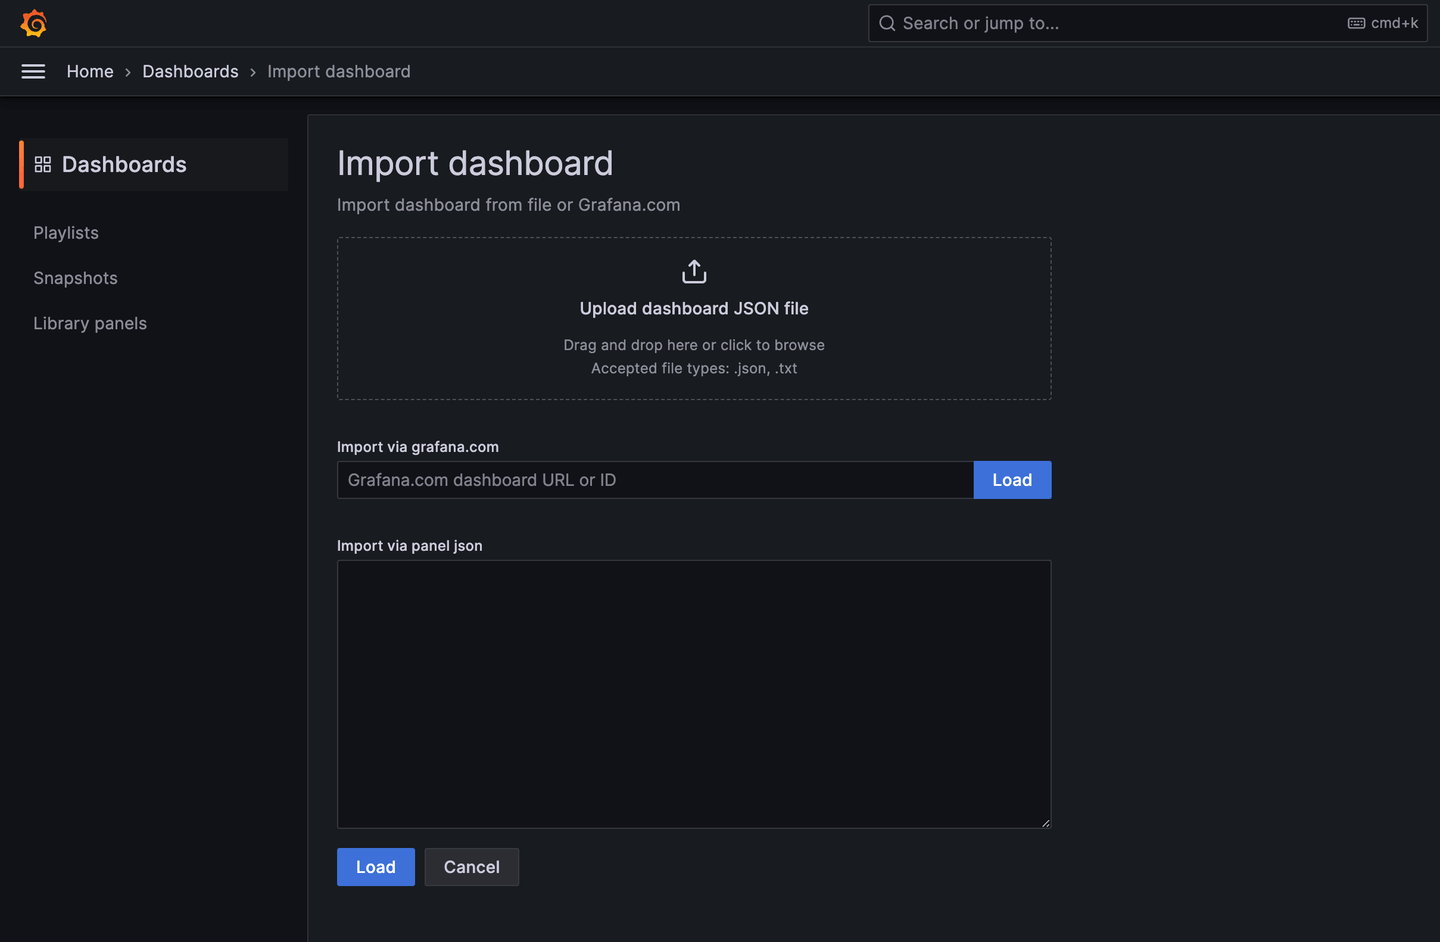
Import the MyScale Trace Dashboard:
Once the ClickHouse Data Source is added, you can import the MyScale Trace Dashboard.
-
Configure the Dashboard:
After importing, select the MyScale Cluster (ClickHouse Data Source Name), the database name, table name, and TraceID of the trace you want to analyze. The dashboard will then display the Traces Table and the Trace Details Panel of the selected trace.
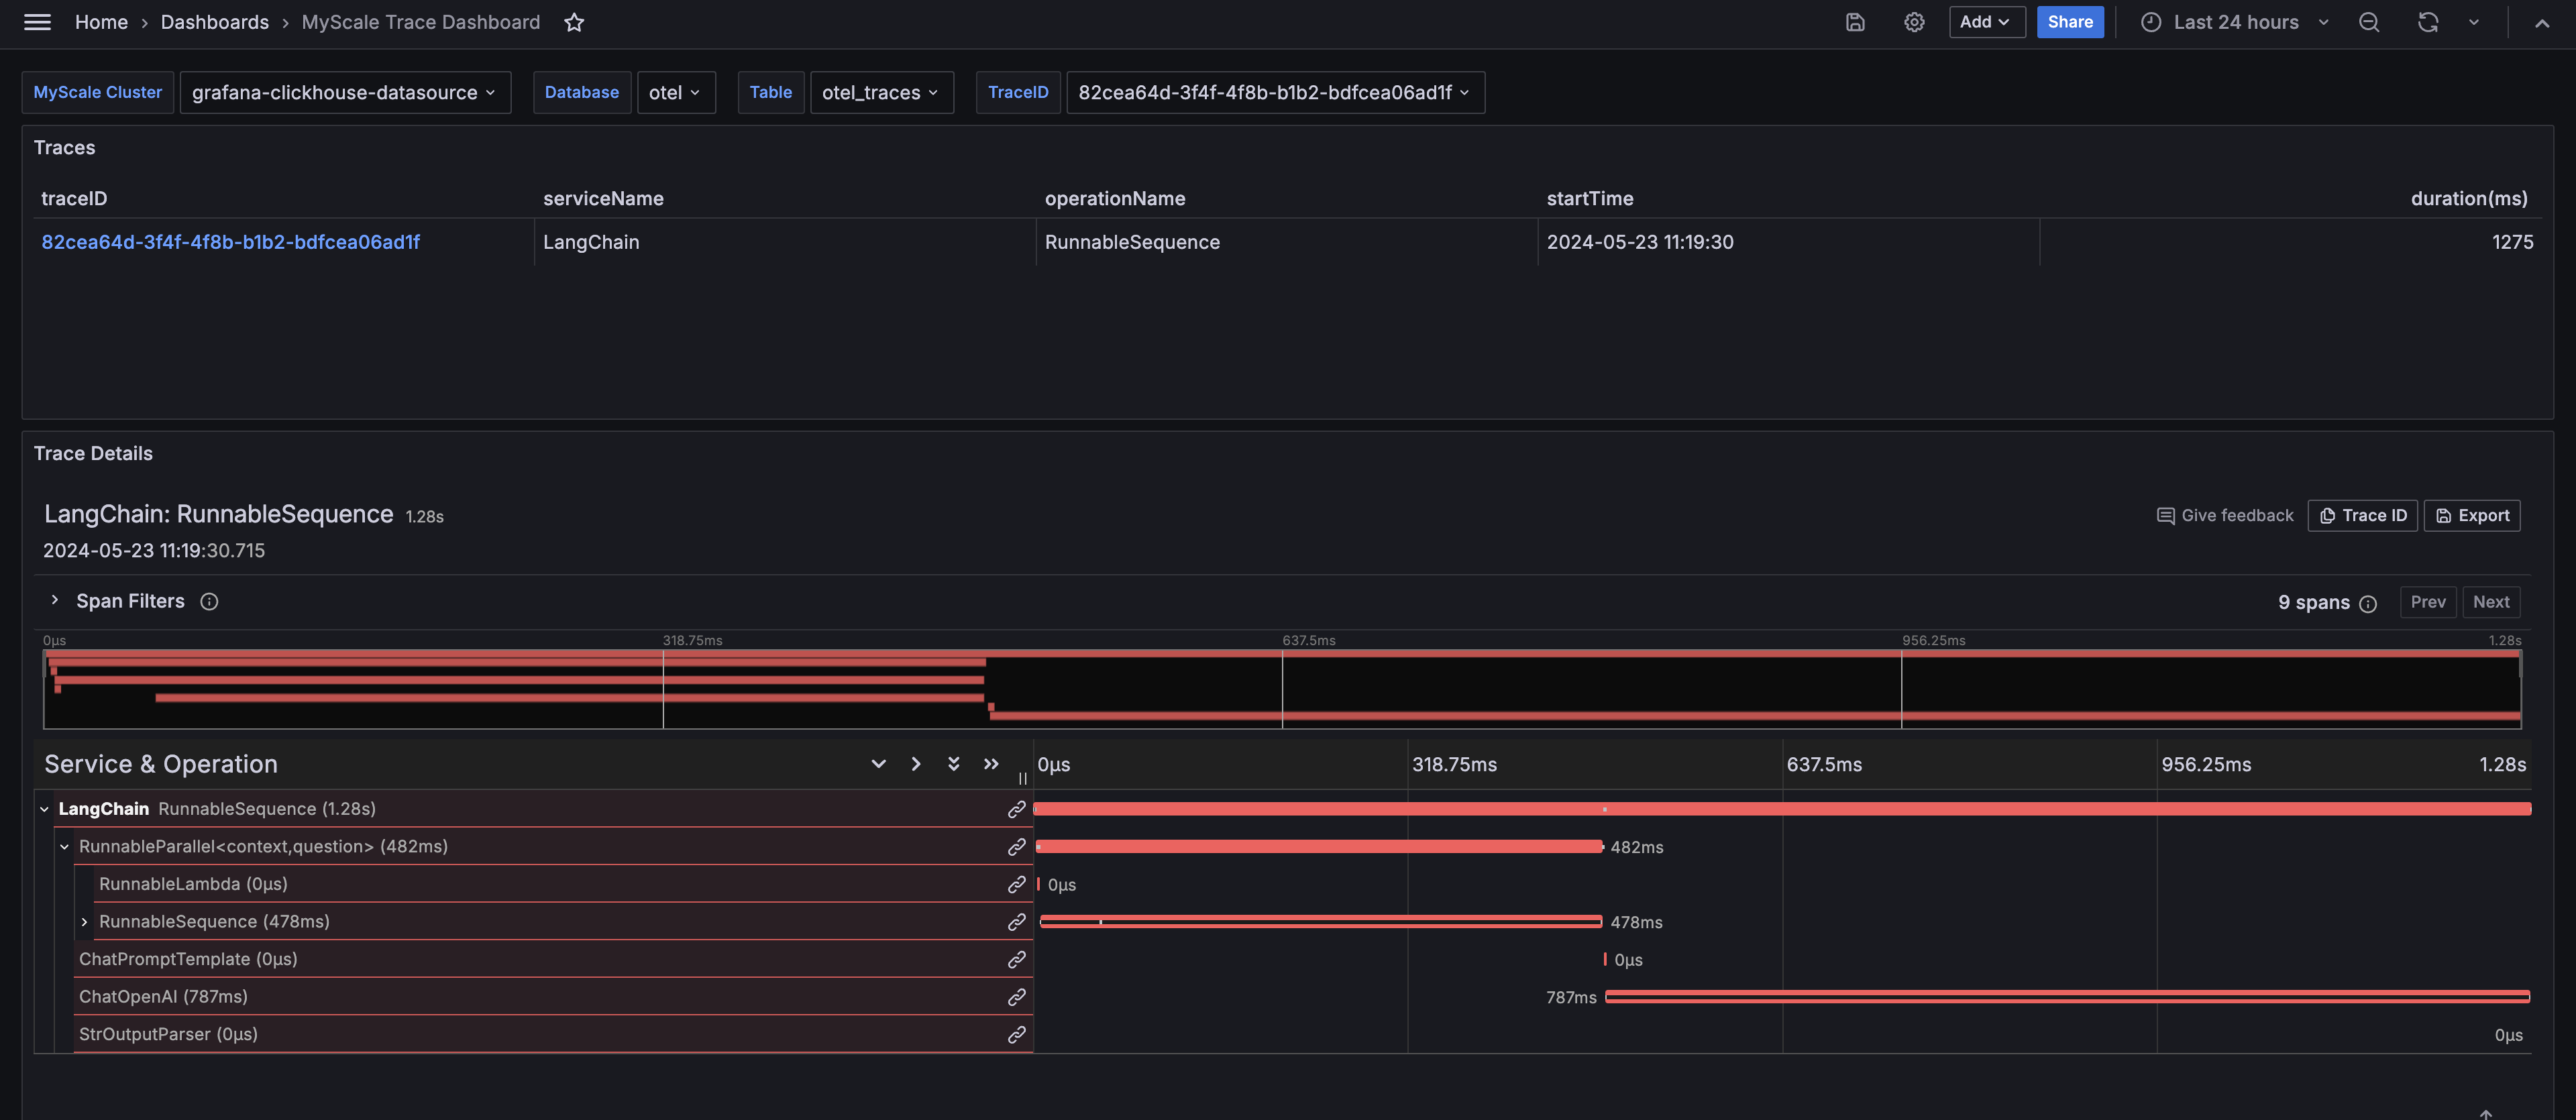
The MyScale Trace Dashboard provides comprehensive insights into the runtime behavior of your LLM applications, similar to LangSmith. It displays critical information that helps in debugging, optimizing, and understanding the performance of your applications.
Roadmap
- Support for more LLM frameworks
- Support LLM tracing directly
- Extend to end-to-end GenAI system observability
Acknowledgment
We give special thanks for these open-source projects:
- LangChain: The most popular LLM framework integrated with MyScale Telemetry.
- OpenTelemetry: The schema of MyScale Telemetry is inspired by this widely used system telemetry toolset.
- MyScaleDB and ClickHouse: Data collected by MyScale Telemetry can be stored in either of these databases.
Release history Release notifications | RSS feed


Download files
Download the file for your platform. If you're not sure which to choose, learn more about installing packages.
Source Distribution
Built Distribution
Filter files by name, interpreter, ABI, and platform.
If you're not sure about the file name format, learn more about wheel file names.
Copy a direct link to the current filters
File details
Details for the file myscale_telemetry-0.2.3.3.tar.gz.
File metadata
- Download URL: myscale_telemetry-0.2.3.3.tar.gz
- Upload date:
- Size: 16.4 kB
- Tags: Source
- Uploaded using Trusted Publishing? No
- Uploaded via: twine/6.0.1 CPython/3.12.8
File hashes
| Algorithm | Hash digest | |
|---|---|---|
| SHA256 |
f3a6710d16c1f3eb229a33a81cf27f7448cfc3dcddacbb6bf6cc927698447bee
|
|
| MD5 |
d183f04f9ec50c1ff2966d0a4b51ac01
|
|
| BLAKE2b-256 |
2ed30a2a39ec57a214b088039bb2e8d582f5ad9c560ce2d51d59f40461310133
|
File details
Details for the file myscale_telemetry-0.2.3.3-py3-none-any.whl.
File metadata
- Download URL: myscale_telemetry-0.2.3.3-py3-none-any.whl
- Upload date:
- Size: 14.8 kB
- Tags: Python 3
- Uploaded using Trusted Publishing? No
- Uploaded via: twine/6.0.1 CPython/3.12.8
File hashes
| Algorithm | Hash digest | |
|---|---|---|
| SHA256 |
c673c23080fe5555fc655d801365c2173446c5a7c349a1938cc938cd12f5d472
|
|
| MD5 |
b3f2e734ce1aba0b8e7bfae15d566f4f
|
|
| BLAKE2b-256 |
7f316d2029ff8d42da1604b6055b685ae4e4b981e8d0a6b262fc652d070d8b0d
|


