A set of functions that process and create descriptive summary visualizations to help develop a broader narrative through-line of tweet data.
Project description
Narrator
by Chris Lindgren chris.a.lindgren@gmail.com Distributed under the BSD 3-clause license. See LICENSE.txt or http://opensource.org/licenses/BSD-3-Clause for details.
Overview
A set of functions that process and create descriptive summary visualizations to help develop a broader narrative through-line of one's tweet data.
It functions only with Python 3.x and is not backwards-compatible (although one could probably branch off a 2.x port with minimal effort).
Warning: narrator performs very little custom error-handling, so make sure your inputs are formatted properly! If you have questions, please let me know via email.
System requirements
- ast
- matplot
- pandas
- numpy
- emoji
- re
Installation
pip install narrator
Objects
narrator will initialize and use the following objects in future versions. It is currently not implemented yet. More to come here.
topperObject: Object class with attributes that store desired top X samples from the corpus Object properties as follows:.top_x_hashtags:.top_x_tweeters:.top_x_tweets:.top_x_topics:.top_x_urls:.top_x_rts:.period_dates:
General Functions
narrator contains the following general functions:
initializeTO: Initializes a topperObject().date_range_writer: Takes beginning date and end date to write a range of those dates per Day as a List- Args:
- bd= String. Beginning date in YYYY-MM-DD format
- ed= String. Ending date in YYYY-MM-DD format
- Returns List of arrow date objects for whatever needs.
- Args:
period_writer: Accepts list of lists of period date information and returns a Dict of per Period dates for temporal analyses.- Args:
- periodObj: Optional first argument periodObject, Default is None
- 'ranges': Hierarchical list in following structure:
ranges = [
['p1', ['2018-01-01', '2018-03-30']],
['p2', ['2018-04-01', '2018-06-12']],
...
]
- Returns Dict of period dates per Day as Lists:
{ 'p1': ['2018-01-01', '2018-01-02', ...] }
- Args:
Summarizer Functions
summarizer: Counts a column variable of interest and returns a sample data set based on set parameters. There are 5 search options from which to choose. See the the 'main_sum_option' list below.- Args:
- Required Options:
- main_sum_option= String. Current options for sampling include the following:
- 'sum_all_col': Sum of all the passed variable across entire corpus
- 'sum_group_col': Sum of a group of the passed variables (List) across entire corpus
- 'sum_single_col': Sum of a single isolated variables value (String) across entire corpus
- 'single_term_per_day': Sum of single variable per Day in provided range
- 'grouped_terms_perday': Sum of group of a type of variable per Day in provided range
- column_type= String. Provides the type of summary to conduct.
- 'hashtags': Searches for hashtags
- 'urls': Searches for URLs
- 'other': Searches for another type of content
- df_corpus= DataFrame of tweet corpus
- primary_col= String. Name of the primary targeted DataFrame column of interest, e.g., hashtags, urls, etc.
- sort_check= Boolean. If True, sort sums per day.
- sort_date_check= Boolean. If True, sort by dates.
- sort_type= Boolean. If True, descending order. If False, ascending order.
- main_sum_option= String. Current options for sampling include the following:
- Conditional Options: Based on the 'main_sum_option', these will vary in use and assignment.
- group_search_option= String. Use to choose what search options to use for 'group_col_per_day'.
- 'single_col': Searches for search terms in the single pertinent column
- 'keywords_and_col': Searches for a column variable and accompanying keywords in another content column, such as 'tweets'. For example, you search for someone's name in the corpus that isn't always represented as a hashtag.
- simple_list= List of terms to isolate.
- keyed_list= List of Dicts. A keyed list of keywords of which you search within the secondary_col.
- secondary_col= String. Name of the secondary targeted DataFrame column of interest, if needed, e.g., tweets, usernames, etc.
- single_term= String of single term to isolate.
- time_agg_type= If sum by group temporally, define its temporal aggregation:
- 'day': Aggregate time per Day
- 'period': Aggregate time per period
- date_col= String value of the DataFrame column name for the dates in xx-xx-xxxx format.
- id_col= String value of the DataFrame column name for the unique ID.
- grouped_output_type= String. Options for particular Dataframe output
- consolidated= Each listed value in group is a column with its period values
- spread= One column for each listed group value
- group_search_option= String. Use to choose what search options to use for 'group_col_per_day'.
- Required Options:
- Return: Depending on option, a sample as a List of Tuples or Dict of grouped samples
- Args:
get_sample_size: Helper function for summarizer functions. If sample=True, then sample sent here and returned to the summarizer for output.- Args:
- sort_check= Boolean. If True, sort the corpus.
- sort_date_check= Boolean. If True, sort corpus based on dates.
- counted_list= List. Tallies from corpus.
- ss= Integer of sample size to output.
- sample_check= Boolean. If True, use ss value. If False, use full corpus.
- Returns DataFrame to summarizer function.
- Args:
grouper: Takes default values in 'skeleton' Dict and hydrates them with sample List of Tuples- Args:
- group_type= String. Current options include 'day' or 'period'
- listed_tuples= List of Tuples from get_sample_size().
- Example structure is the following:
[(('keyword', '01-27-2019'), 100), (...), ...]
- Example structure is the following:
- skeleton= Dict. Fully hydrated skeleton dict, wherein grouper() updates its default 0 Int values.
- Returns Dict of updated values per keyword
- Args:
skeletor: Takes desired date range and list of keys to create a skeleton Dict before hydrating it with the sample values. Overall, this provides default 0 Int values for every keyword in the sample.- Args:
- aggregate_level= String. Current options include:
- 'day': per Day
- 'period_day': Days per Period
- 'period': per Period
- date_range=
- If 'day' aggregate level, a List of per Day dates
['2018-01-01', '2018-01-02', ...] - If 'period' aggregate level, a Dict of periods with respective date Lists:
{{'1': ['2018-01-01', '2018-01-02', ...]}}
- If 'day' aggregate level, a List of per Day dates
- keys= List of keys for hydrating the Dict
- aggregate_level= String. Current options include:
- Returns full Dict 'skeleton' with default 0 Integer values for the grouper() function
- Args:
whichPeriod: Helper function for grouper(). Isolates what period a date is in for use.- Args:
- period_dates= Dict of Lists per period
- date= String. Date to lookup.
- Returns String of period to grouper().
- Args:
find_term: Helper function for accumulator(). Searches for hashtag in tweet. If there, return True. If not, return False. - Args: - search= String. Term to search for. - text= String. Text to search. - Returns Booleangrouped_dict_to_df: Takes grouped Dict and outputs a DataFrame.- Args:
- main_sum_option= String. Options for grouping into a Dataframe.
- group_hash_temporal= Multiple groups of hashtags
- grouped_output_type= Sring. oPtions for DF outputs
- spread= Good for small multiples in D3.js
- consolidated= Good for small multiples in matplot
- time_agg_type= String. Options for type of temporal grouping.
- period= Grouped by periods
- group_dict= Hydrated Dict to convert to a DataFrame for visualization or output
- main_sum_option= String. Options for grouping into a Dataframe.
- Returns DataFrame for use with a plotter function or output as CSV
- Args:
accumulator: Helper function for summarizer function. Accumulates by simple lists and keyed lists.- Args:
- checker= String. Options for accumulation:
- simple: Takes values from simple_list and conducts a search on primary_col.
- keyed: Takes values from keyed_list and conducts a search on secondary_col.
- df_list= List. DataFrame passed as a list for traversing
- check_list= List. List of terms to accrue and append
- If simple, converted to List of each listed term.
- If keyed, List of dicts, where each key is its accompanying primary_col term.
- checker= String. Options for accumulation:
- Returns a hydrated list of Tuples with each primary term and its accompanying date.
- Args:
Plotter Functions
bar_plotter: Plot the desired sum of your column sums as a bar chart- Args:
- ax=None # Resets the chart
- counter = List of tuples returned from match_maker(),
- path = String of desired path to directory,
- output = String value of desired file name (.png)
- Returns: Nothing, but outputs a matplot figure in your Jupyter Notebook and .png file.
- Args:
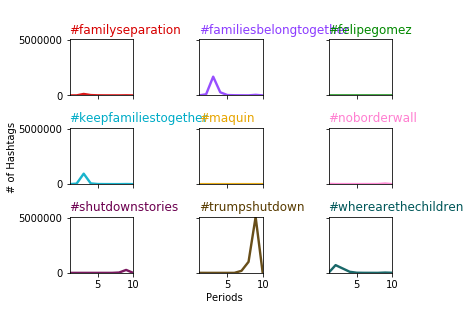
multiline_plotter: Plots and saves a small-multiples line chart from a returned DataFrame from the summarizer function that used the 'spread' output option- Modified src: https://python-graph-gallery.com/125-small-multiples-for-line-chart/
- Args:
- style= String. See matplot docs for options available, e.g. 'seaborn-darkgrid'
- pallette= String. See matplot docs for options available, e.g. 'Set1'
- graph_option= String. Options for sampling will include all of the the following, but for now only 'group_var_per_period':
- 'single_var_per_day': Sum of single variable per Day in provided range
- 'group_var_per_day': Sum of group of variable per Day in provided range
- 'single_var_per_period': Sum of single variable per Period
- 'group_var_per_period': Sum of group of variable per Period
- df= DataFrame of data set to be visualized
- x_col= DataFrame column for x-axis
- multi_x= Integer for number of graphs along x/rows
- multi_y= Integer for number of graphs along y/columns
- NOTE: Only supports 3x3 right now.
- linewidth= Float. Line width level.
- alpha= Float (0-1). Opacity level of lines
- chart_title= String. Title for the overall chart
- x_title= String. Label for x axis
- y_title= String. Label for y axis
- path= String. Path to save figure
- output= String. Filename for figure.
- Returns nothing, but plots a 'small multiples' series of charts
Example Uses
Create a Dictionary of period dates
ranges = [
    ('1', ['2018-01-01', '2018-03-30']),
    ('2', ['2018-04-01', '2018-06-12']),
    ('3', ['2018-06-13', '2018-07-28']),
    ('4', ['2018-07-29', '2018-10-17']),
    ('5', ['2018-10-18', '2018-11-24']),
    ('6', ['2018-11-25', '2018-12-10']),
    ('7', ['2018-12-11', '2018-12-19']),
    ('8', ['2018-12-20', '2018-12-25']),
    ('9', ['2018-12-26', '2019-02-13']),
    ('10', ['2019-02-14', '2019-02-28'])
]

period_dates = narrator.period_dates_writer(ranges=ranges)
period_dates['1'][:5]

## Output ##
['2018-01-01', '2018-01-02', '2018-01-03', '2018-01-04', '2018-01-05']
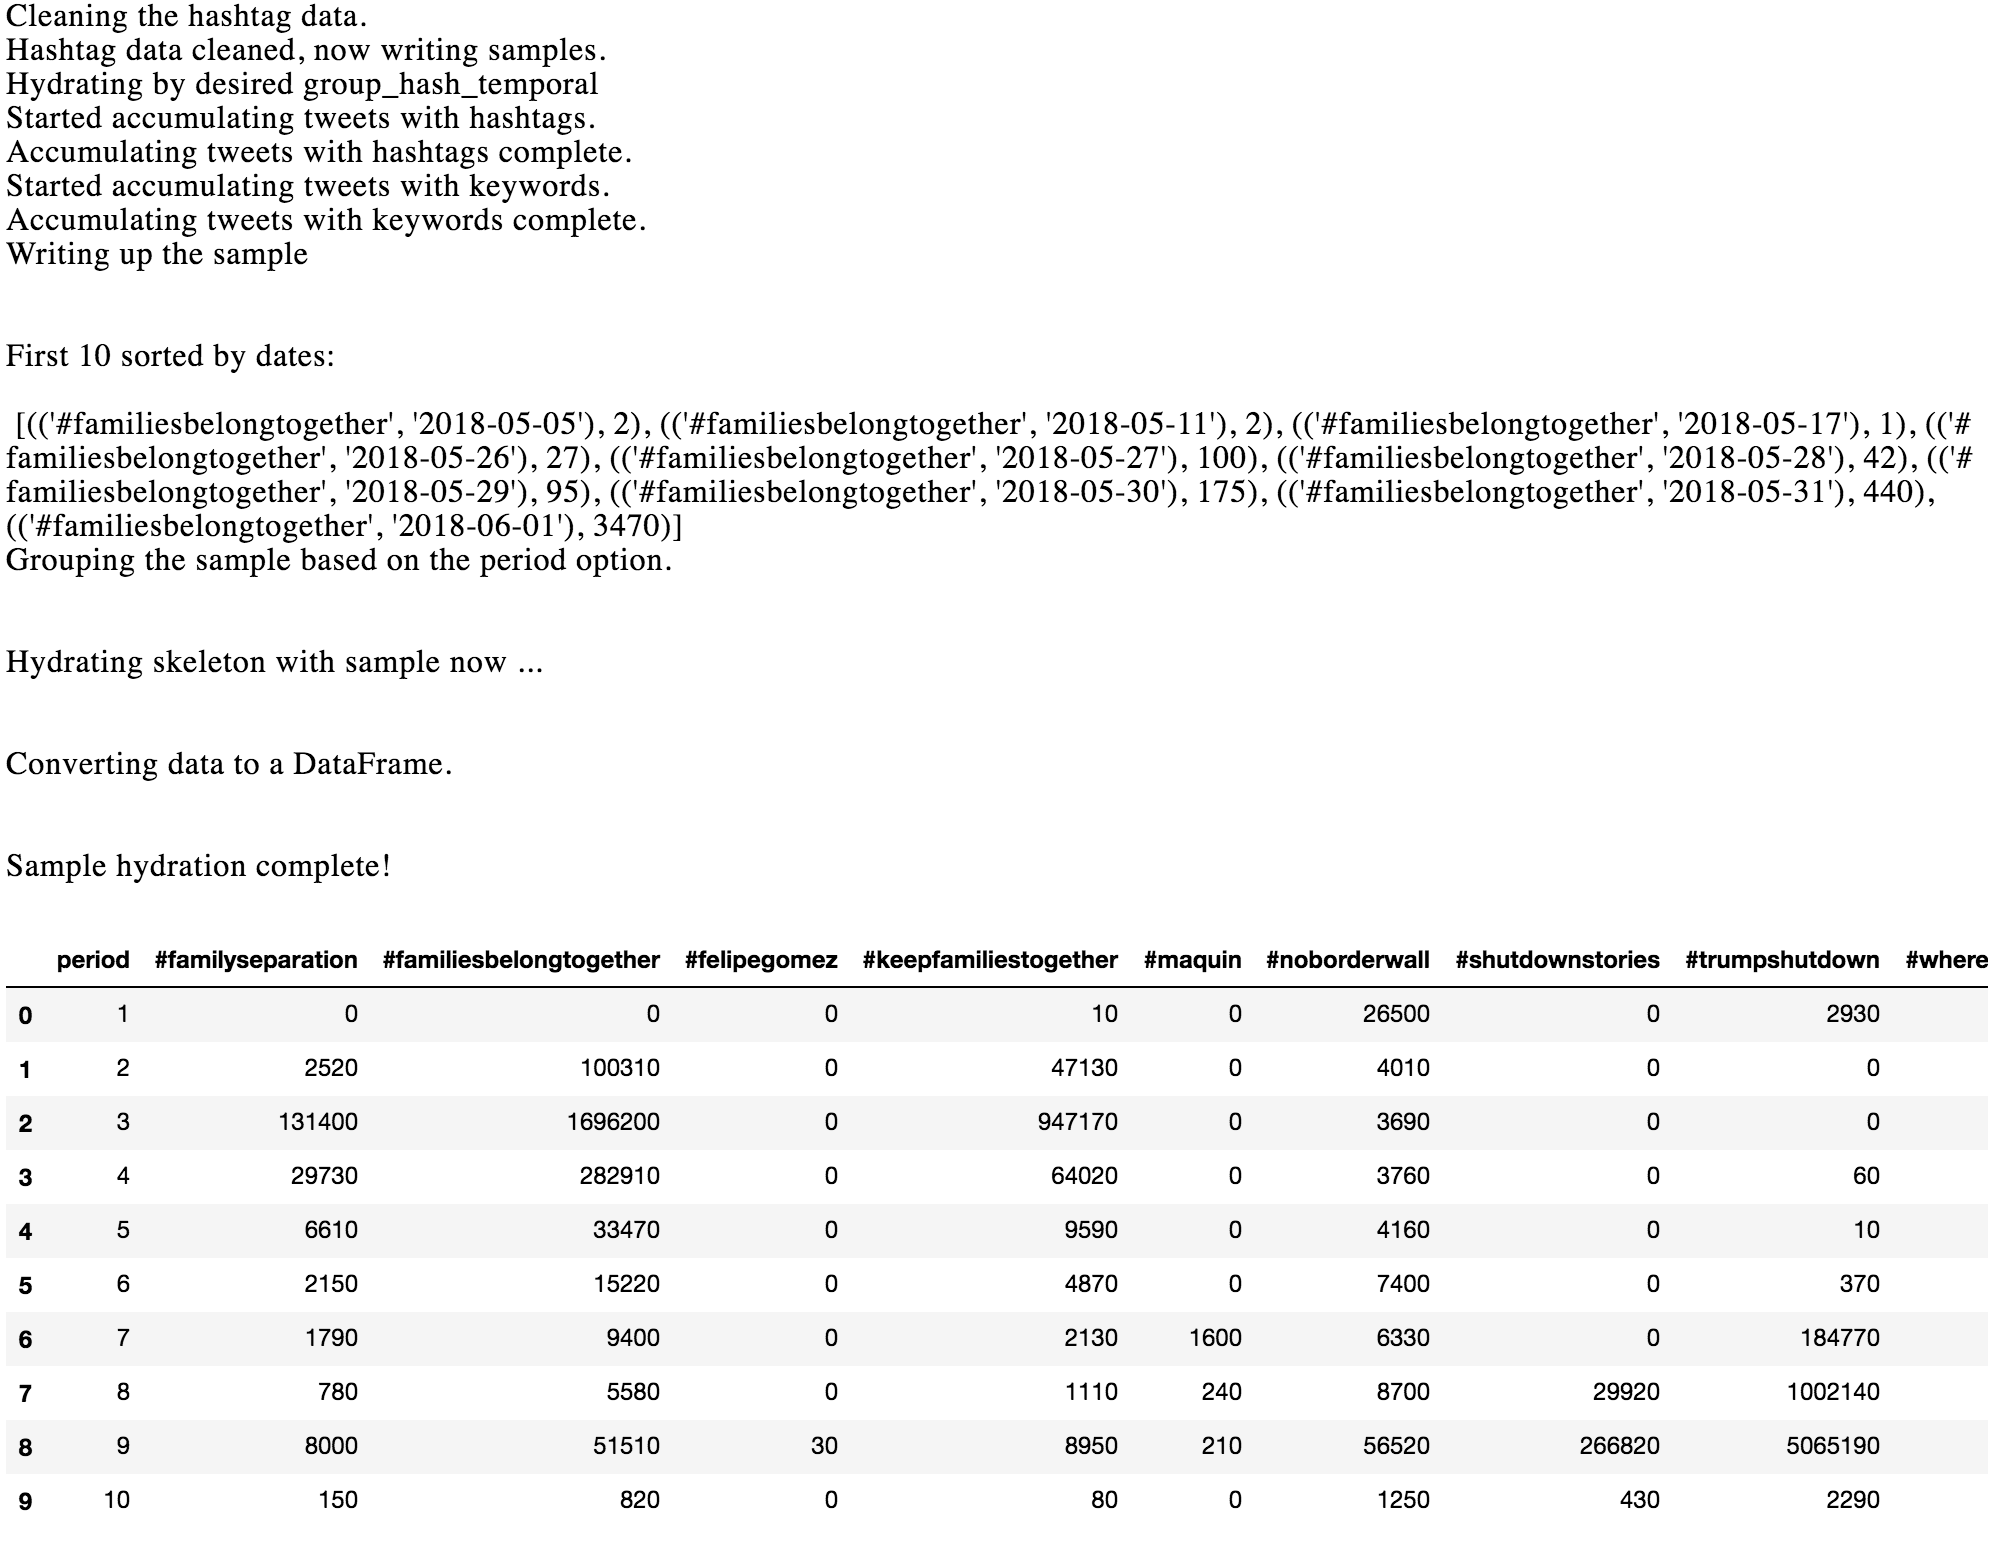
Use the hashtag_summarizer to generate multiple types of summary outputs
The below examples takes a group of hashtags, searches for them based on the period dates, then outputsthese groupings in descending order. In this case, it can also use a keyword list and hashtag list as 2 forms of input to inform the search across the corpus.
# 1. Create and assign listed values. If a search term has
# multiple variations, create a list of dictionaries and pass
# it to the summarizer() function as a "keyword_list".
liberal_keyword_list = [
    {
        '#felipegomez': ['felipe alonzo-gomez', 'felipe gomez']
    },
    {
        '#maquin': ['jakelin caal', 'maquín', 'maquin' ]
    }
]
liberal_hashtag_list = [
    '#familyseparation', '#familiesbelongtogether',
    '#felipegomez', '#keepfamiliestogether',
    '#maquin', '#noborderwall', '#shutdownstories',
    '#trumpshutdown', '#wherearethechildren'
]

# 2. Create Dict "skeleton" with above listed search values
# This dict is passed as the "skeleton" parameter in the
# summarizer function
dict_group_skel = narrator.skeletor(
    aggregate_level='period',
    date_range=period_dates,
    keys=liberal_hashtag_list
)

# 3. Fill out the search parameters to return a hydrated
# pandas DataFrame.
df_sum = summarizer(
    # Required options
    column_type='hashtags',
    primary_col='hashtags',
    main_sum_option='grouped_terms_perday',
    df_corpus=df_all,
    sort_check=True, # Sort per day
    sort_date_check=False, #Do not sort by date
    sort_type=True, # Ascending (F) or descending (T)?
    # Conditional options
    group_search_option='keywords_and_col',
    simple_list=liberal_hashtag_list, # List of terms
    keyed_list=liberal_keyword_list, # List of alternative terms
    secondary_col='tweet',
    date_col='date',
    id_col='id',
    sample_check=False, # Use custom sample size (True or False)
    sample_size=None, # Custom sample size (Int or None)
    skeleton=dict_group_skel,
    time_agg_type='period',
    period_dates=period_dates,
    grouped_output_type='spread' #spread or consolidated
)
Output from above code:
Plot a "Small Multiples" Line Chart
import colorcet as cc

narrator.multiline_plotter(
    style='tableau-colorblind10',
    palette=cc.cm.glasbey_dark,
    graph_option='group_hash_per_period',
    df=ht_df_sum,
    x_col='period',
    multi_x=3,
    multi_y=3,
    linewidth=1.9,
    alpha=0.9,
    chart_title='Liberal hashtag sums per period',
    x_title='Periods',
    y_title='# of Hashtags',
    path='figures',
    output='test_multi.png'
)
Output:
Distribution update terminal commands
# Create new distribution of code for archiving
sudo python3 setup.py sdist bdist_wheel

# Distribute to Python Package Index
python3 -m twine upload --repository-url https://upload.pypi.org/legacy/ dist/*
Project details
Release history Release notifications | RSS feed
Download files
Download the file for your platform. If you're not sure which to choose, learn more about installing packages.
Source Distribution
Built Distribution
Hashes for narrator-0.0.0.3-py3-none-any.whl
| Algorithm | Hash digest | |
|---|---|---|
| SHA256 | 65b09932d0901db221c4fd9bbb4429e202db7579438216cfe3164241f3940421 |
|
| MD5 | 8be743dc60a94e4b7a05ad54faf4ea30 |
|
| BLAKE2b-256 | 33f39f0eb1a2a039a05e1c918e6e2ddcd3d33cfc5b531449c0e4617da1a0ac75 |


