Package for processing and plotting echem data from cyclers

Project description
navani
Module for processing and plotting electrochemical data from battery cyclers, combining other open source libraries to create pandas dataframes with a normalized schema across multiple cycler brands. Contains functions to compute dQ/dV and dV/dQ.
Full documentation can be found here.
Currently supports:
- BioLogic MPR (
.mpr) - Arbin res files (
.res) - Simple
.txtand Excel.xls/.xlsxformats produced by e.g., Arbin, Ivium and Lanhe/Lande - Neware NDA and NDAX (
.nda,.ndax)
The main dependencies are :
- pandas
- galvani (BioLogic MPR)
- mdbtools (for reading Arbin's .res files with galvani).
- NewareNDA (for reading Neware's NDA and NDAx formats).
Installation
It is stronly recommended to use a fresh Python environment to install navani, using e.g., conda create or python -m venv <chosen directory.
To install navani, either clone this repository and install from your local copy:
git clone git@github.com/BenSmithGreyGroup/navani
cd navani
pip install .
or install directly from GitHub with pip:
pip install git+https://github.com/BenSmithGreyGroup/navani
The additional non-Python mdbtools dependency to galvani that is required to read Arbin's .res format can be installed on Ubuntu via sudo apt install mdbtools, with similar instructions available for other Linux distributions.
Usage
The main entry point to navani is the navani.echem.echem_file_loader function, which will do file type detection and return a pandas dataframe.
Many different plot types are then available, as shown below:
import pandas as pd
import navani.echem as ec
df = ec.echem_file_loader(filepath)
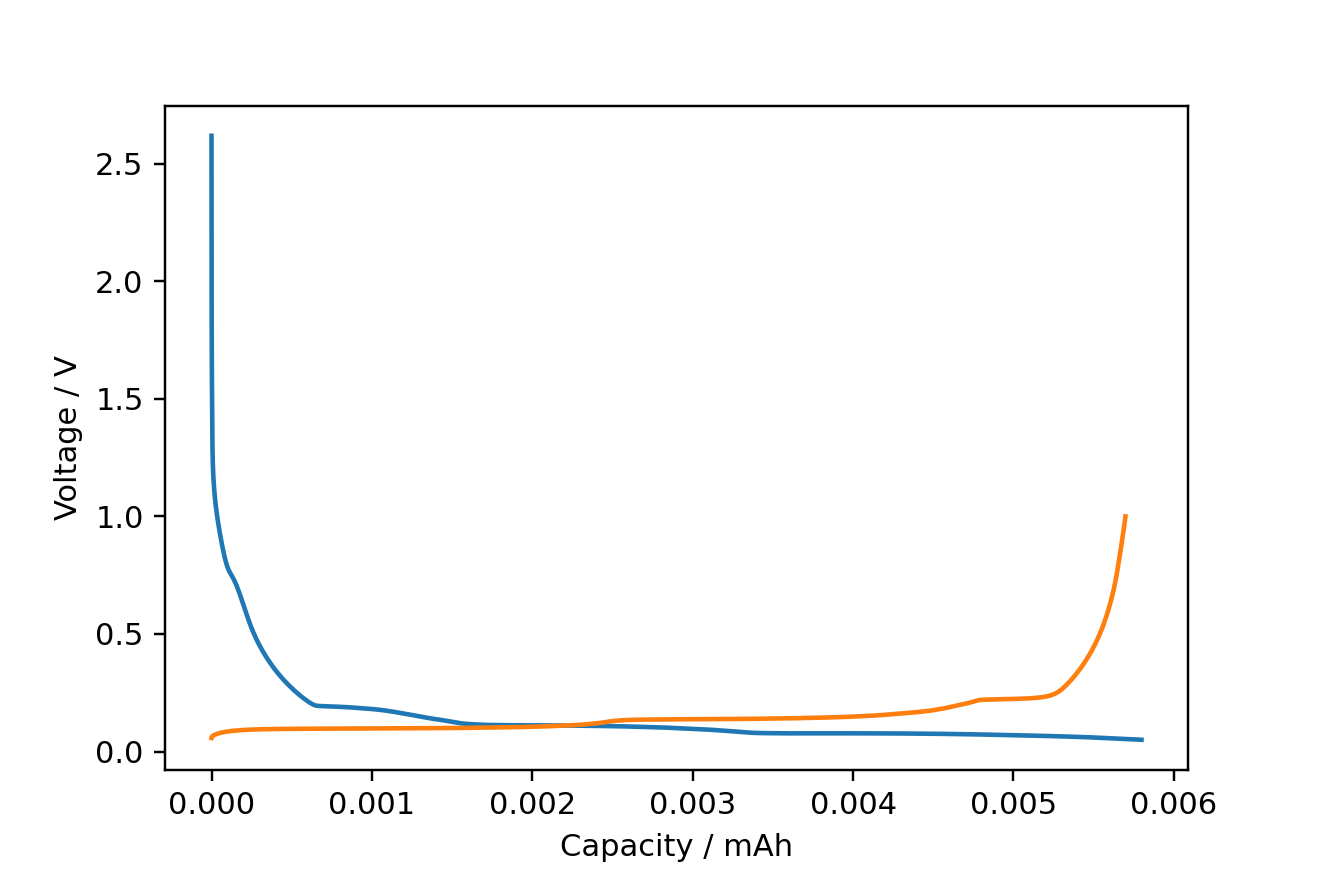
fig, ax = ec.charge_discharge_plot(df, 1)
for cycle in [1, 2]:
mask = df['half cycle'] == cycle
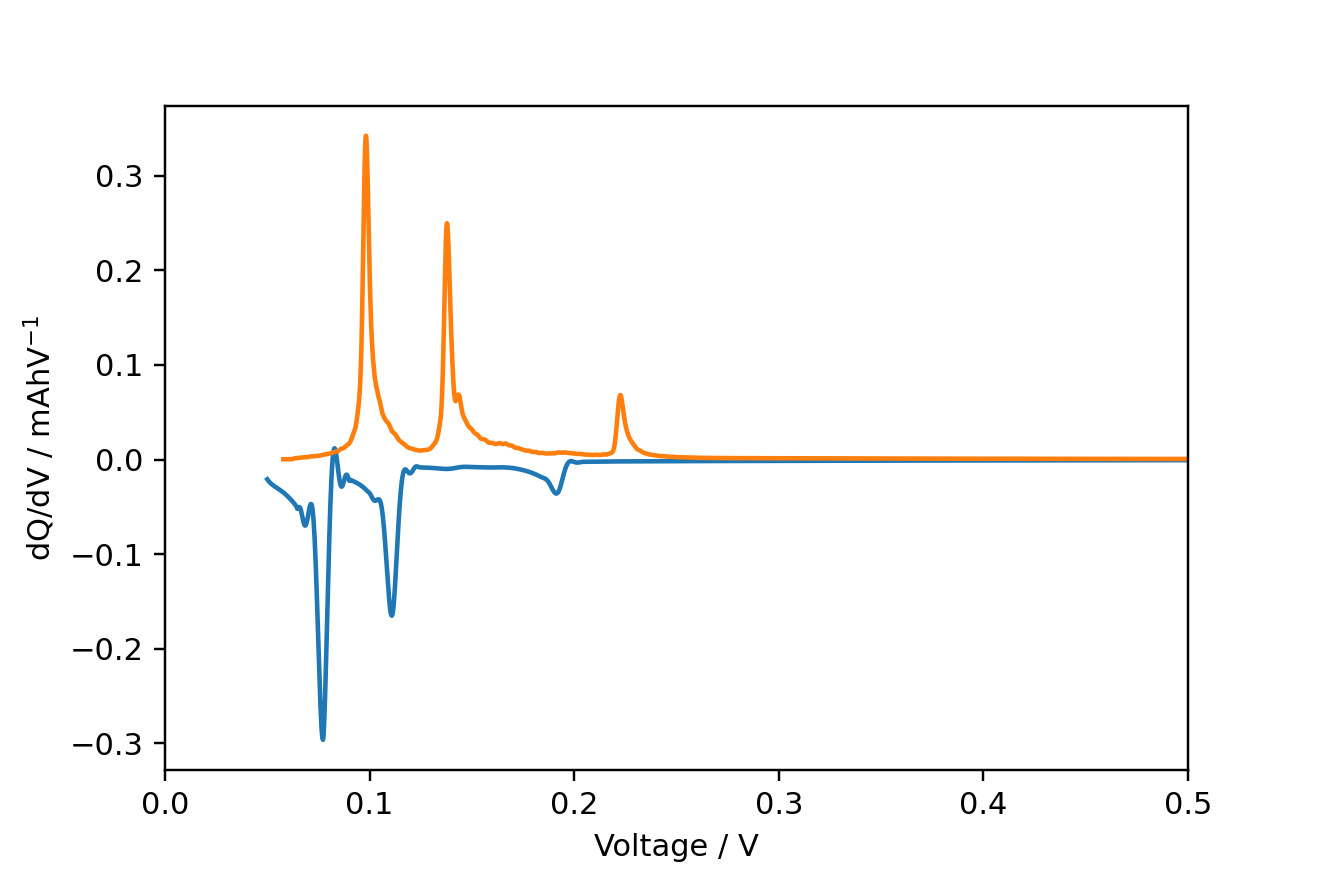
voltage, dqdv, capacity = ec.dqdv_single_cycle(df['Capacity'][mask], df['Voltage'][mask],
window_size_1=51,
polyorder_1=5,
s_spline=0.0,
window_size_2=51,
polyorder_2=5,
final_smooth=True)
plt.plot(voltage, dqdv)
plt.xlim(0, 0.5)
plt.xlabel('Voltage / V')
plt.ylabel('dQ/dV / mAhV$^{-1}$')
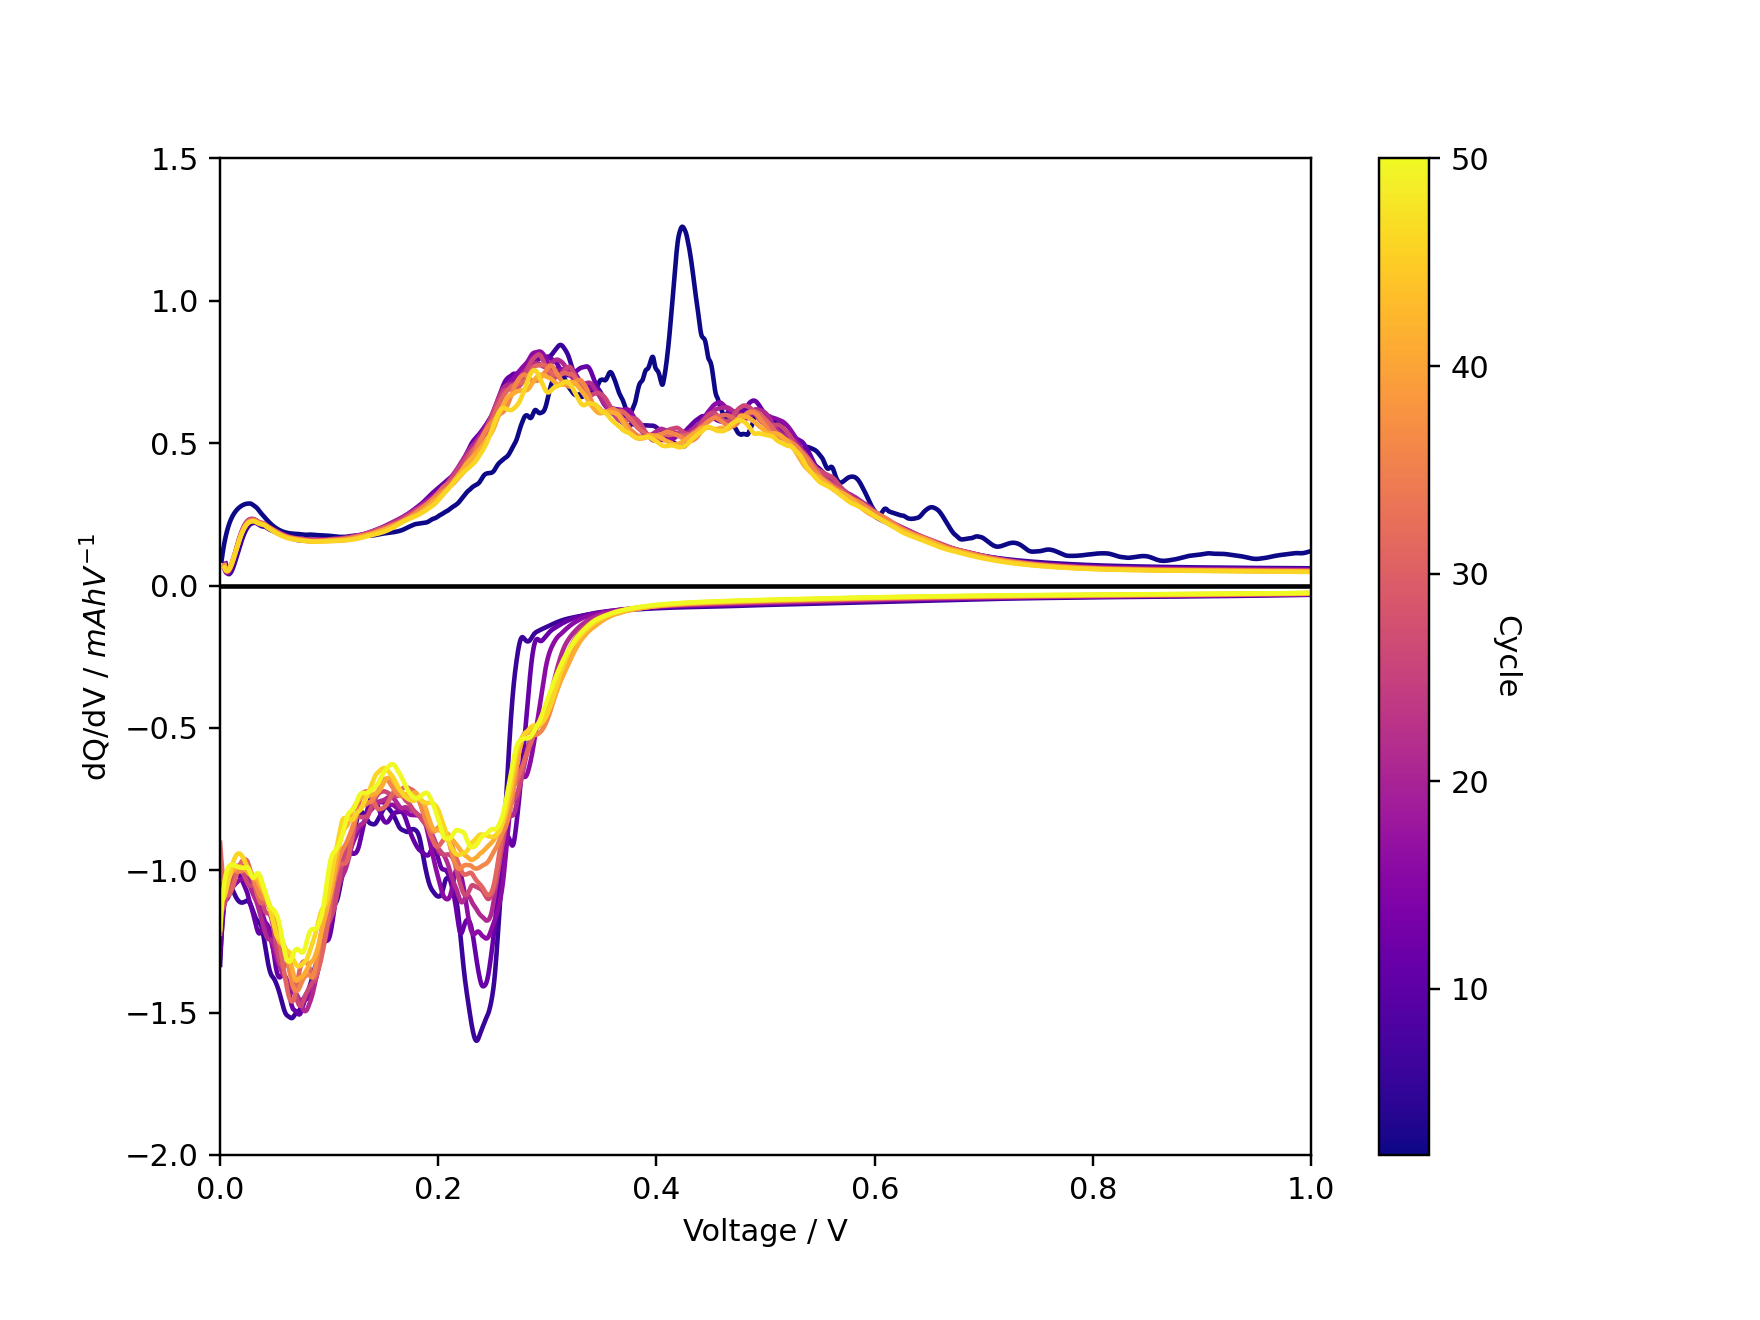
fig, ax = ec.multi_dqdv_plot(df, cycles=cycles,
                    colormap='plasma',
                    window_size_1=51,
                    polyorder_1=5,
                    s_spline=1e-7,
                    window_size_2=251,
                    polyorder_2=5,
                    final_smooth=True)
Release history Release notifications | RSS feed


Download files
Download the file for your platform. If you're not sure which to choose, learn more about installing packages.
Source Distribution
Built Distribution
Filter files by name, interpreter, ABI, and platform.
If you're not sure about the file name format, learn more about wheel file names.
Copy a direct link to the current filters


