ncvue: A minimal GUI for a quick view of netcdf files, aiming to be a drop-in replacement for ncview and panoply
Verified details
These details have been verified by PyPIProject links
GitHub Statistics
Maintainers

Project description
A minimal GUI for a quick view of netCDF files. Aiming to be a drop-in replacement for ncview and panoply.


About ncvue
ncvue is a minimal GUI for a quick view of netCDF files. It is aiming to be a drop-in replacement for ncview and panoply, being slightly more general than ncview targeting maps but providing animations, zooming and panning capabilities unlike panoply. If ncvue is used with maps, it supports mostly structured grids, more precisely the grids supported by cartopy.
ncvue is a Python script that can be called from within Python or as a command line tool. It is not supposed to produce publication-ready plots but rather provide a quick overview of the netCDF file(s).
The complete documentation for ncvue is available from:
Installation
ncvue is an application written in Python. If you have Python installed, then the best is to install ncvue within the Python universe. The easiest way to install ncvue is thence via pip:
python -m pip install ncvueor using Conda:
conda install -c conda-forge ncvuencvue uses CustomTkinter if it is installed. CustomTkinter is not on Conda. ncvue can also use xarray to open netCDF files if it is installed. If you also want to open multiple files with xarray (xarray.open_mfdataset), dask needs to be installed. One can install CustomTkinter with pip on Conda, which works well except for Linux.
python -m pip install dask xarray customtkinteror:
conda install -c conda-forge dask xarray
python -m pip install customtkinter
Sometimes tkinter is not enabled in the system’s Python version. One has to do, for example, sudo apt install python3-tk on Linux or brew install python3 python-tk on macOS with Homebrew.
We also provide standalone applications for macOS and Windows that come with everything needed to run ncvue including Python:
macOS: ncvue 6.4 Intel and ncvue 6.4 ARM for Intel and ARM processors, resp., for macOS 15+ [Sequoia]
Windows: ncvue 6.4
ncvue > 5.0 is either for Intel processors or for Apple Silicon (ARM) chips. The apps > v5.0 are notarized by Apple and might take a short while on first opening.
Quick usage guide
ncvue can be run from the command line:
ncvue
ncvue netcdf_file.nc
ncvue netcdf_file1.nc netcdf_file2.nc
A new netCDF file can be opened from within ncvue using the buttons Open File or Open xarray.
One can also use xarray to open the netCDF file(s) using the command line option -x or the button Open xarray:
ncvue -x netcdf_file.nc
ncvue -x netcdf_file1.nc netcdf_file2.nc
ncvue either analyses the netCDF file itself looking for unlimited dimensions, longitude, latitude, and treats datetime variables; or it let’s xarray do the job. The real difference between using or not using xarray is in case of several input files: the files will be opened as a single dataset with xarray.open_mfdataset if xarray is used. The files will be combined by xarray’s coordinates. This requires dask to be installed. The files are treated like groups of a single netCDF file if xarray is not used. This allows the comparison of different files in scatter plots, for example.
One can set another missing value on the command line on top of the _FillValue and missing_value attributes:
ncvue -m '-9999' netcdf_file.ncThe command line option -h gives a quick usage message.
ncvue can be called from within Python; the filenames have to be given in a list then:
from ncvue import ncvue
ncvue(['netcdf_file.nc'])
Note, ncvue uses the TkAgg backend of matplotlib. It must be called before any other call to matplotlib. This also means that you cannot launch it from ipython –pylab. It can be called from within a standard iPython, though, or using ipython –gui tk.
General layout
On opening, ncvue presents three panels for different plotting types: Scatter or Line plots, Contour plots, and Maps. This is the look in macOS light mode:
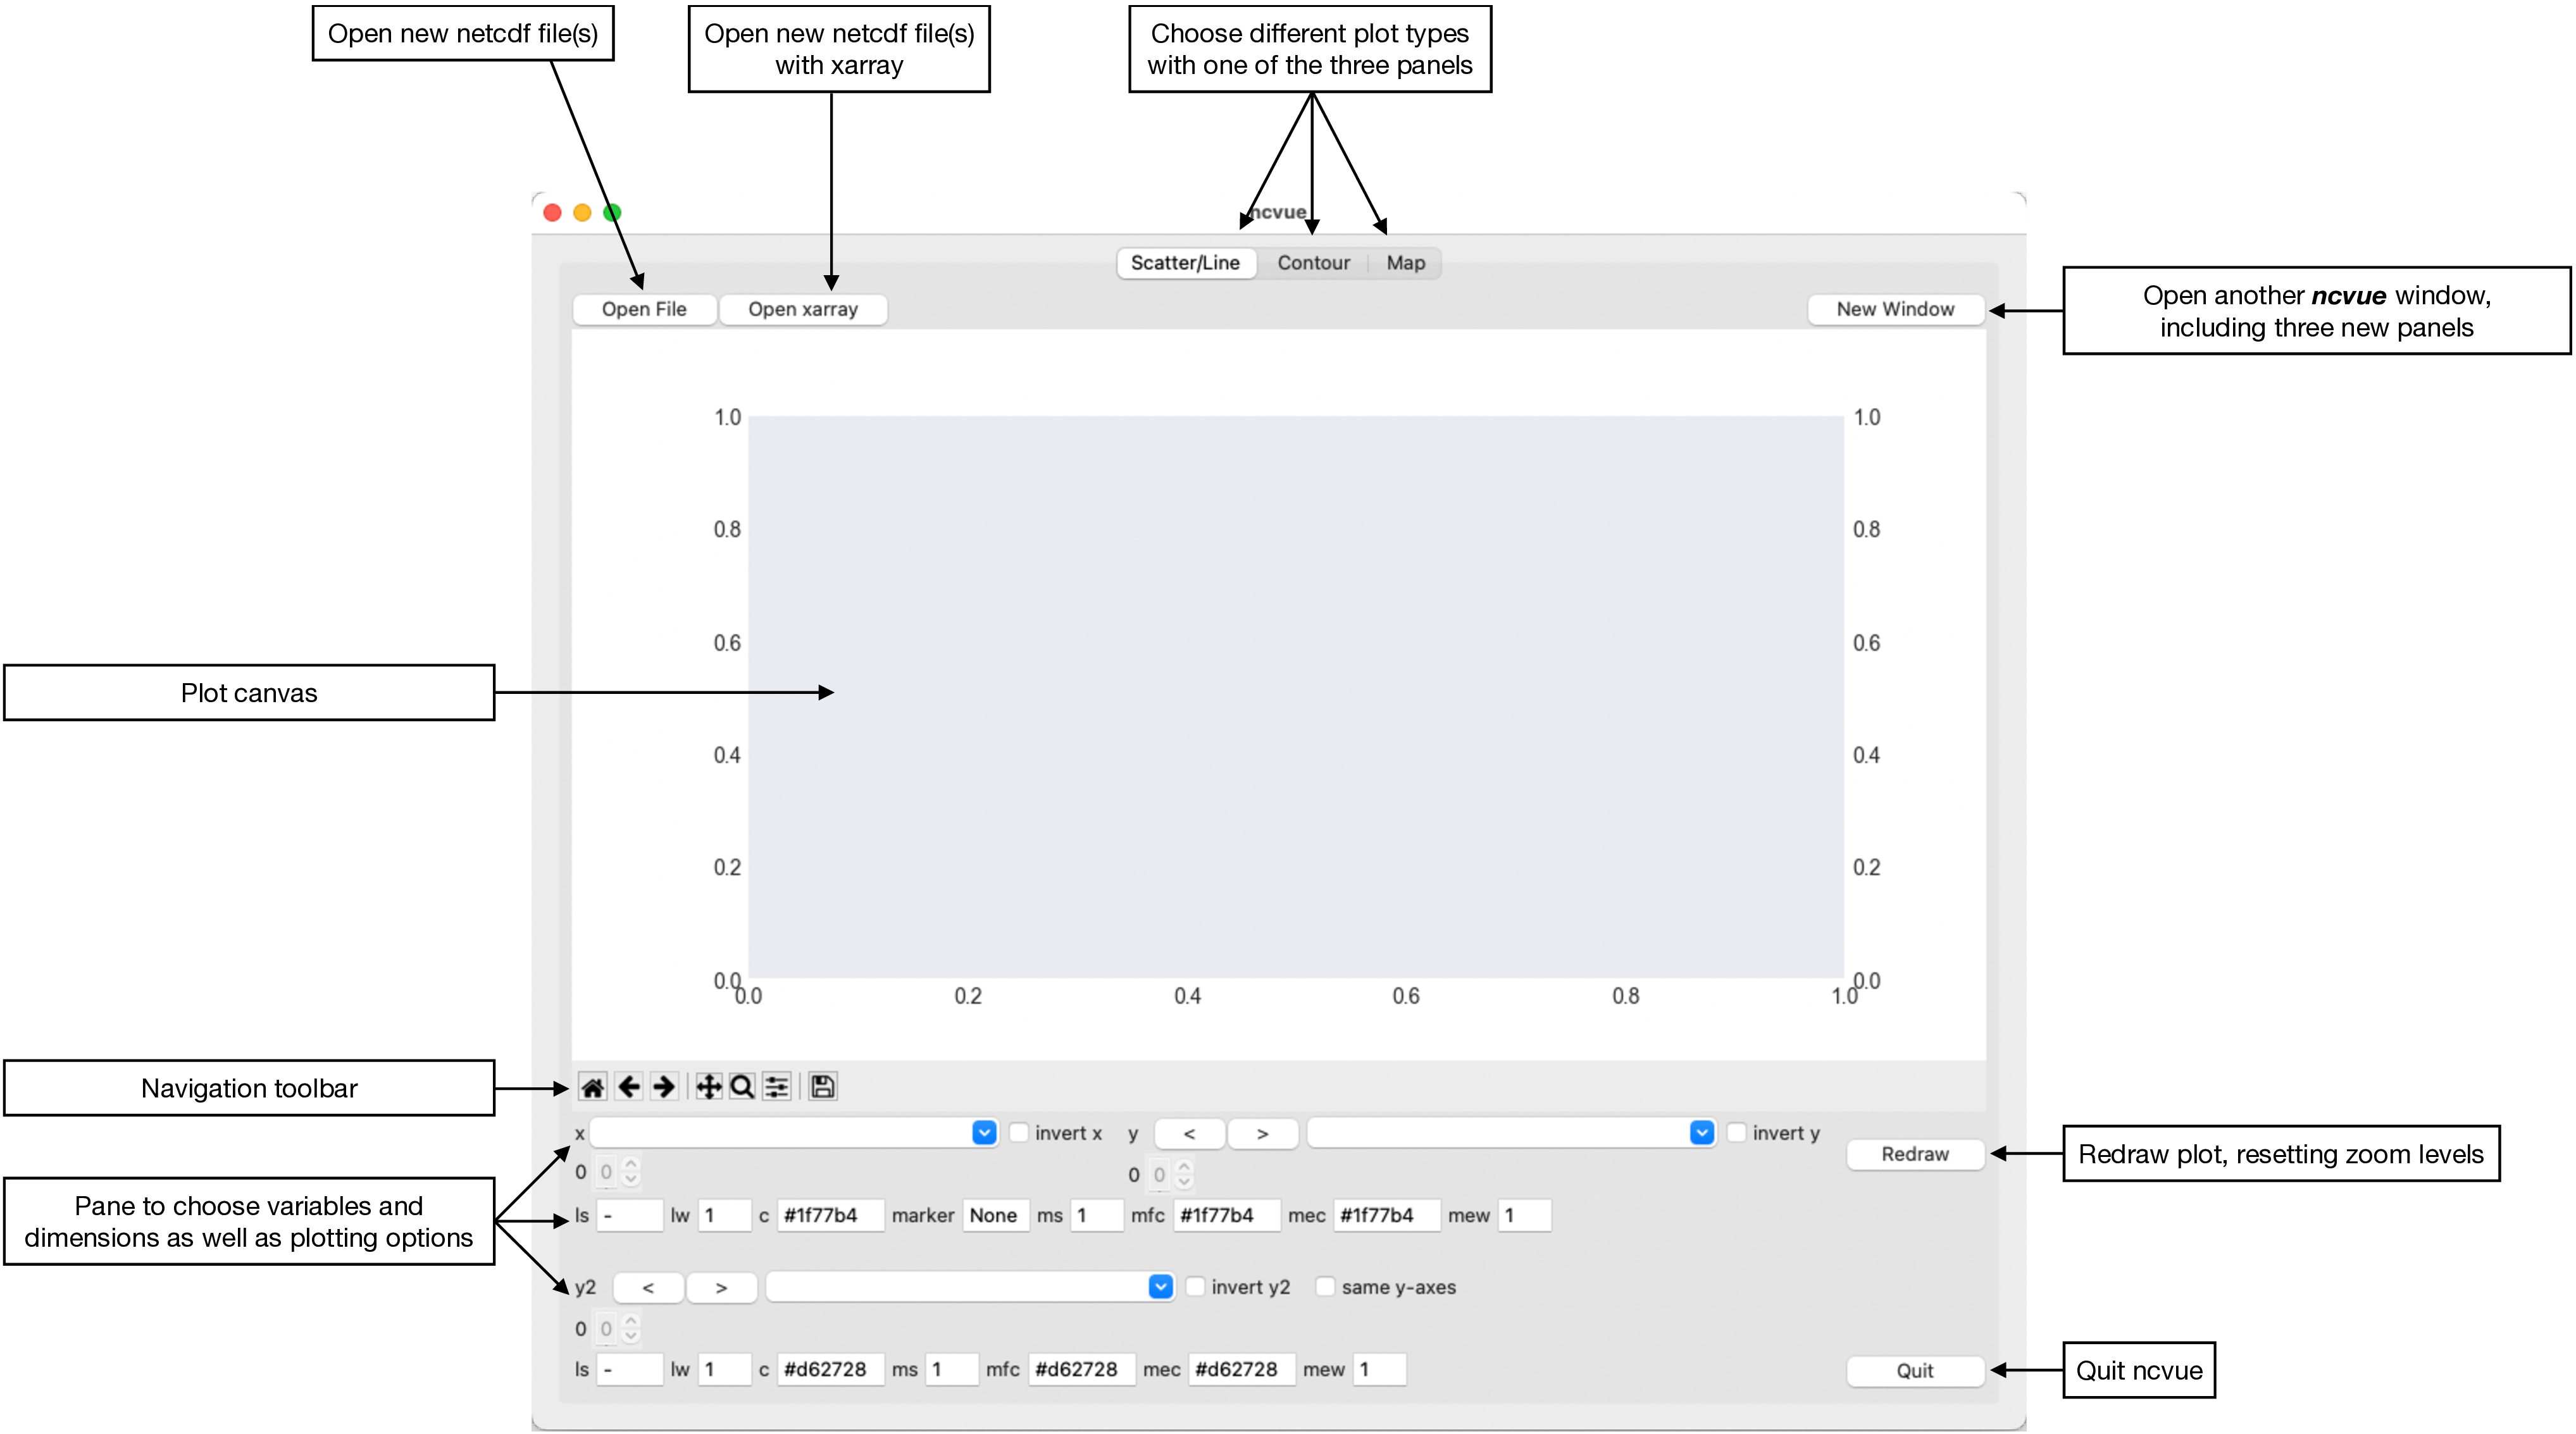
All three panes are organised in this fashion: the plotting canvas, the Matplotlib navigation toolbar and the pane, where one can choose the plotting variables and dimensions, as well as plotting options. You can always choose another panel on top, and open another, identical window for the same netCDF file(s) with the button “New Window” on the top right.
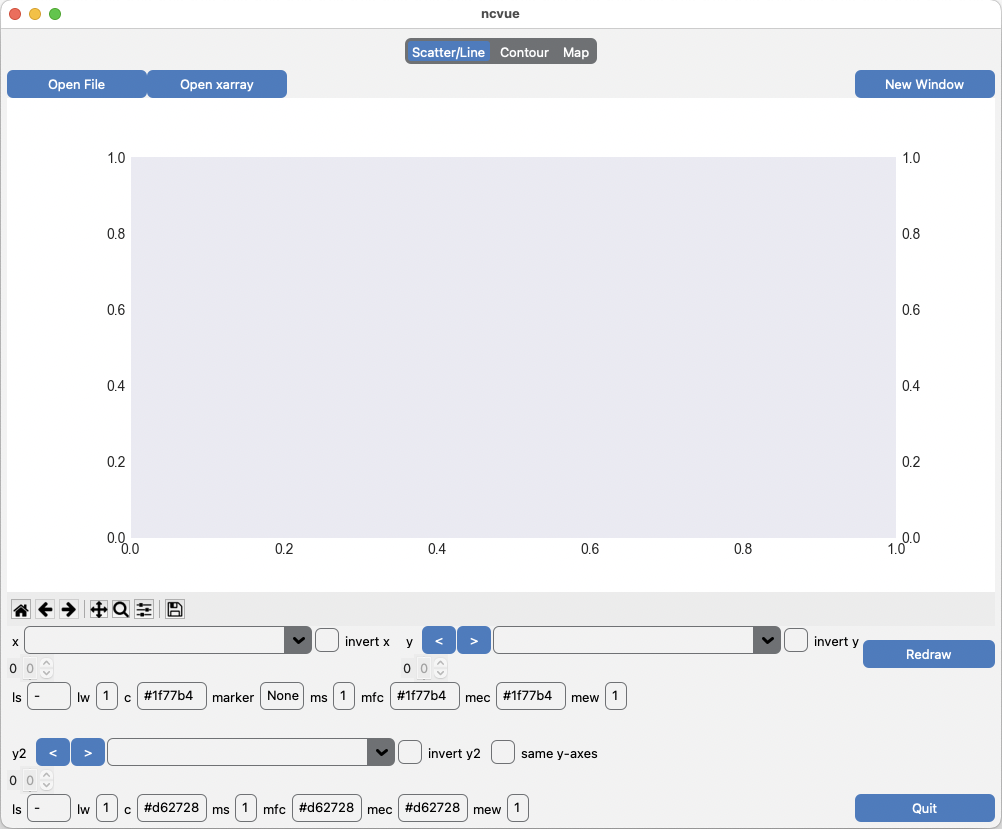
If CustomTkinter is installed, then the general layout looks like:
or in dark mode:
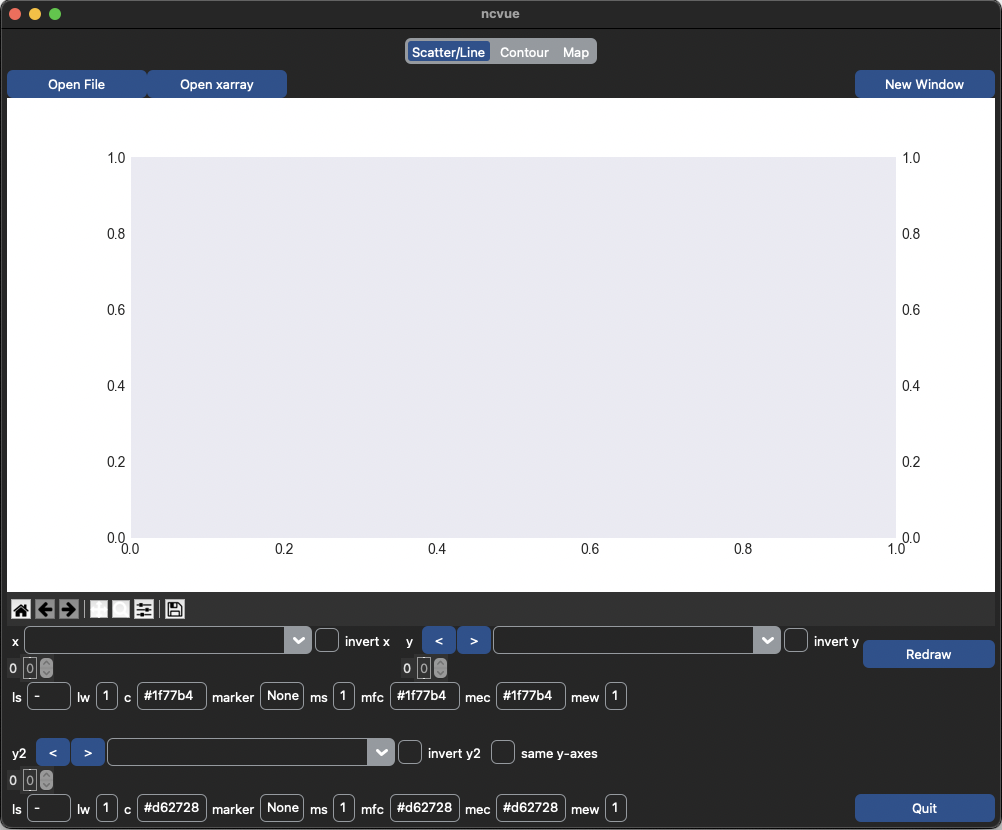
CustomTkinter does not work well with Conda.
Map panel
If ncvue detects latitude and longitude variables with a size greater than 1, it opens the Map panel by default. This is the Map panel on macOS, describing all buttons, sliders, entry boxes, spinboxes, and menus:
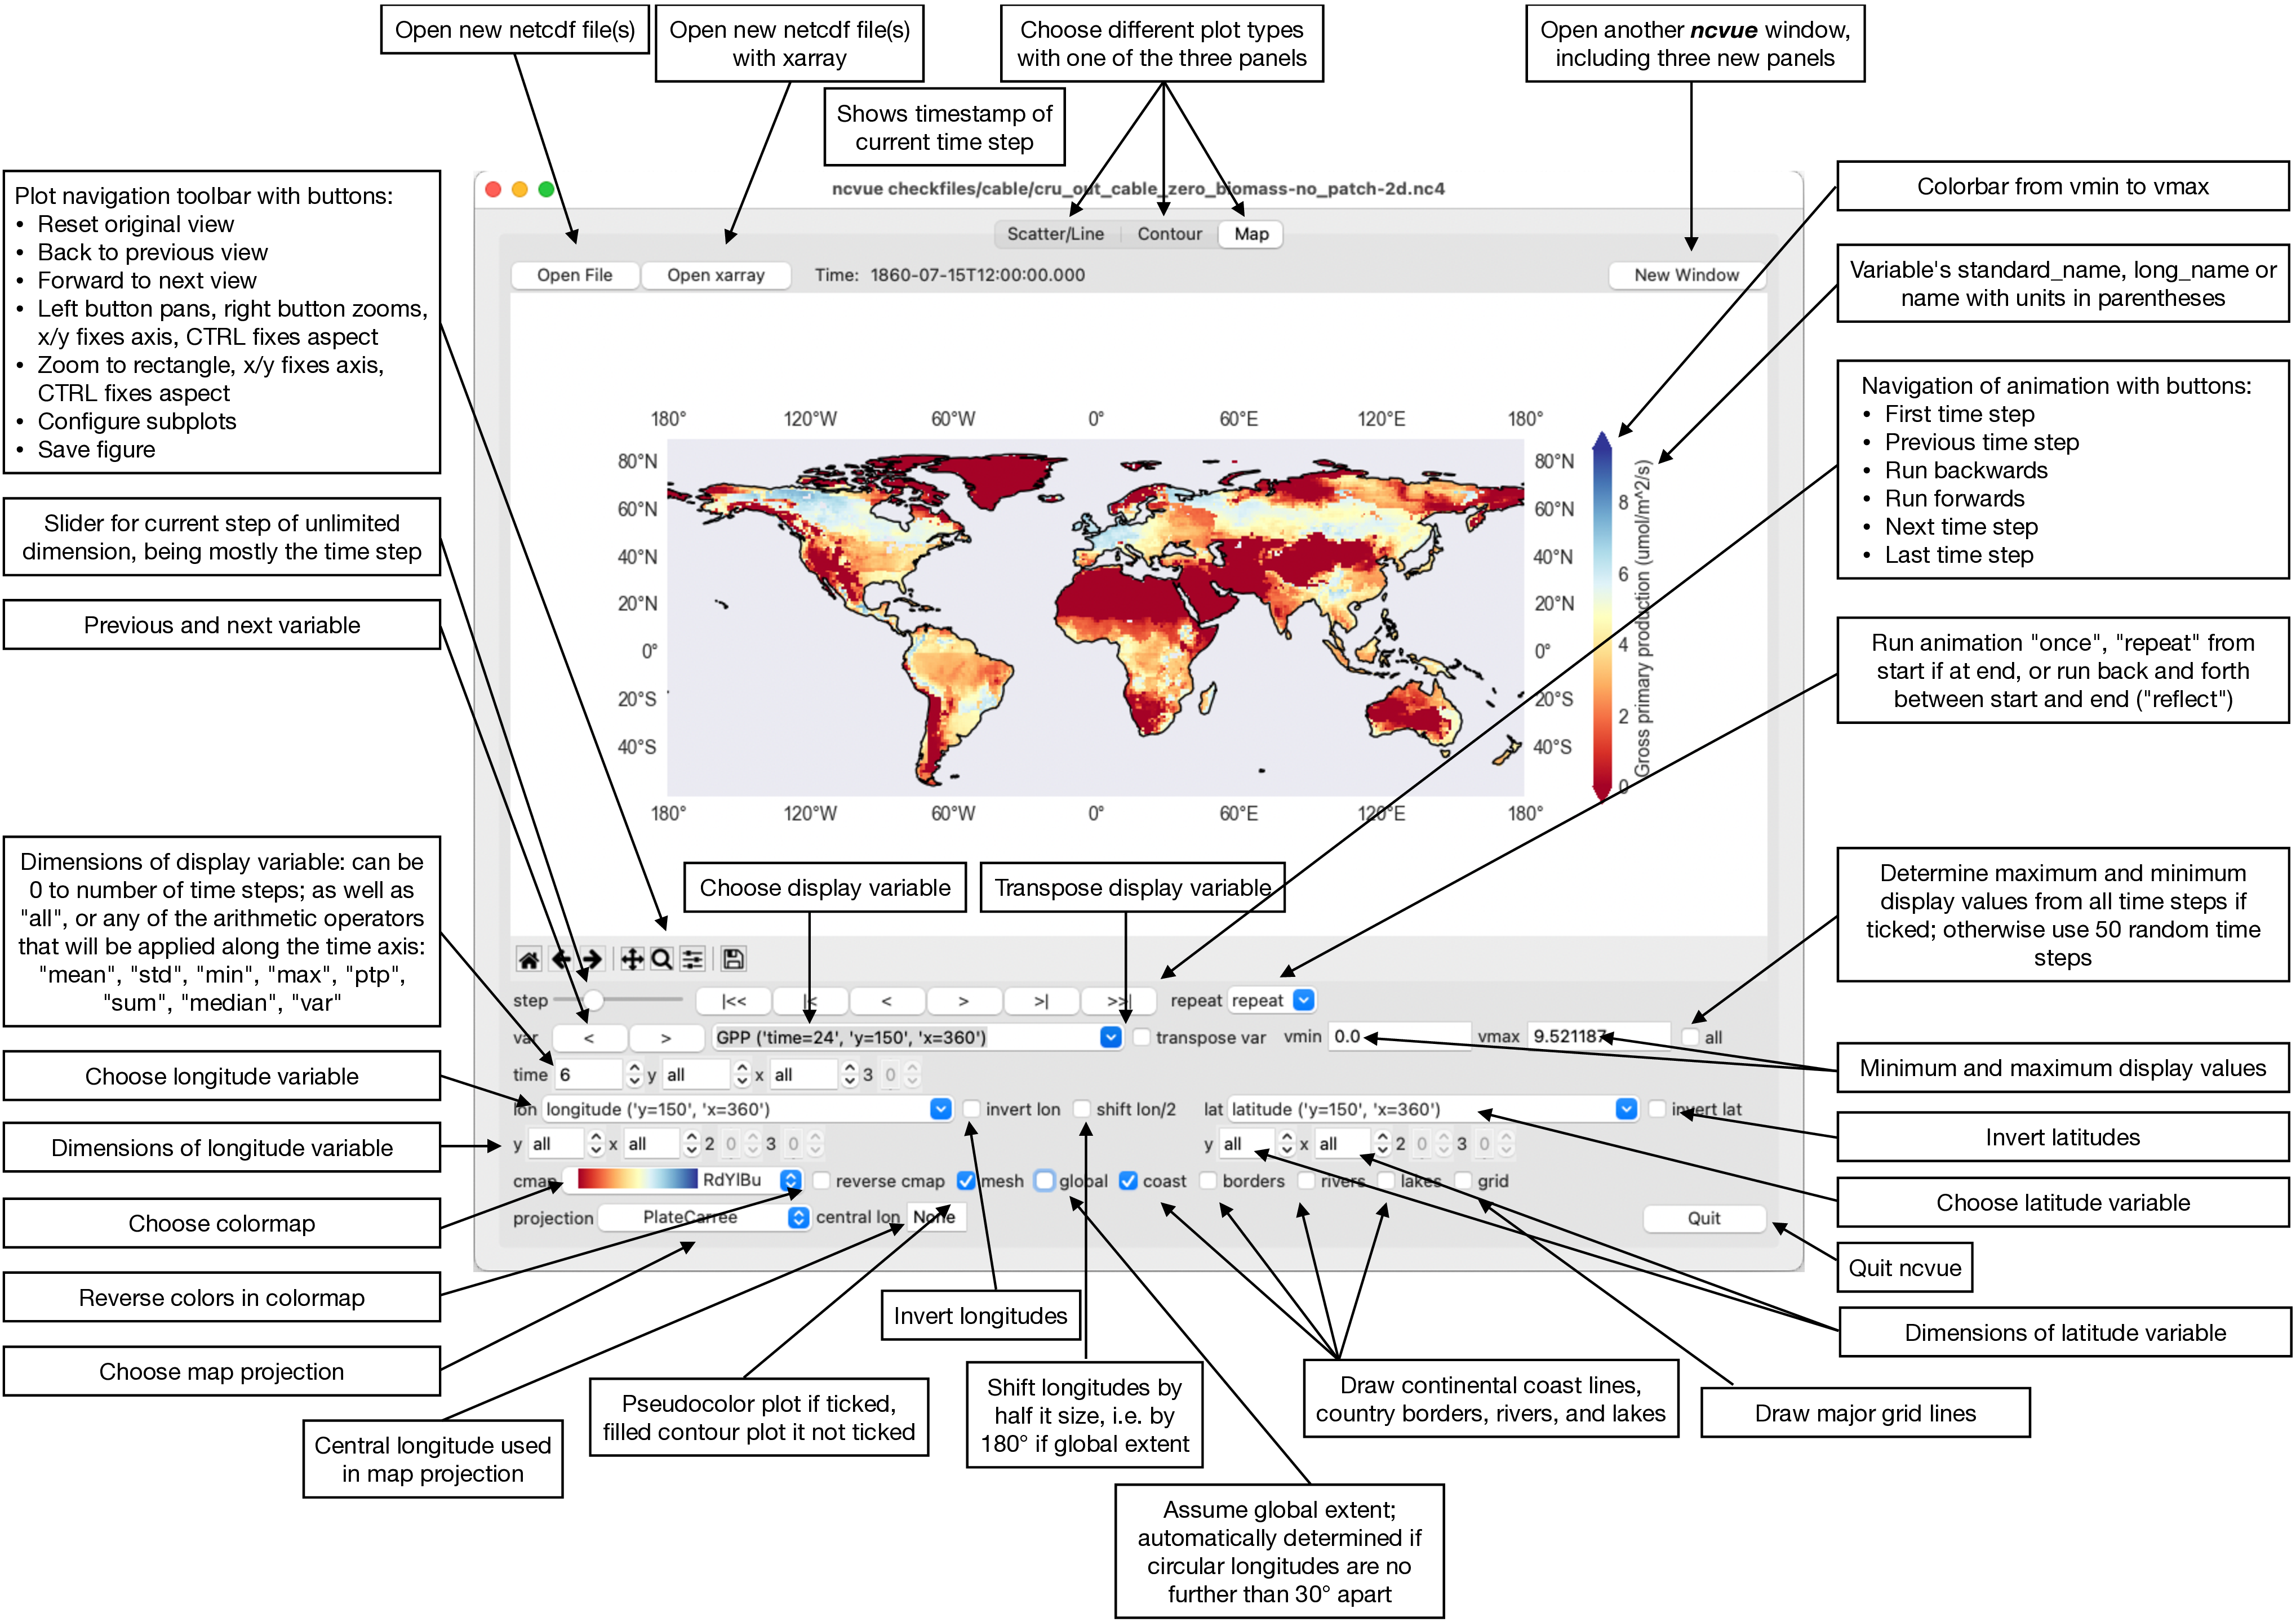
If it happens that the detection of latitudes and longitudes did not work automatically, you can choose the correct variables manually. Or you might also leave the latitudes and longitudes empty, which uses then the indexes, and one can hence display the matrix within the netCDF file(s). You might want to switch off the coastlines in this case.
You might want to switch off the automatically detected “global” option sometimes if your data is on a rotated grid, or if you want to exclude some regions such as below minus -60 °S.
All dimensions can be set from 0 to the size of the dimension-1, to “all”, or to any of the arithmetic operators “mean”, “std” (standard deviation), “min”, “max”, “ptp” (point-to-point amplitude, i.e. max-min), “sum”, “median”, “var” (variance).
Be aware that the underlying cartopy/matplotlib may (or may not) need a long time to plot the data (with the pseudocolor ‘mesh’ option) if you change the central longitude of the projection to anything else than the central longitude of your data, which is automatically detected if “central lon” is set to None. Setting “central lon” to the central longitude of the input data normally eliminates the problem.
Scatter/Line panel
If ncvue does not detect latitude and longitude variables with a size greater than 1, it opens the Scatter/Line panel by default. This is the Scatter/Line panel in macOS dark mode (Aqua look), describing all buttons, sliders, entry boxes, spinboxes, and menus:
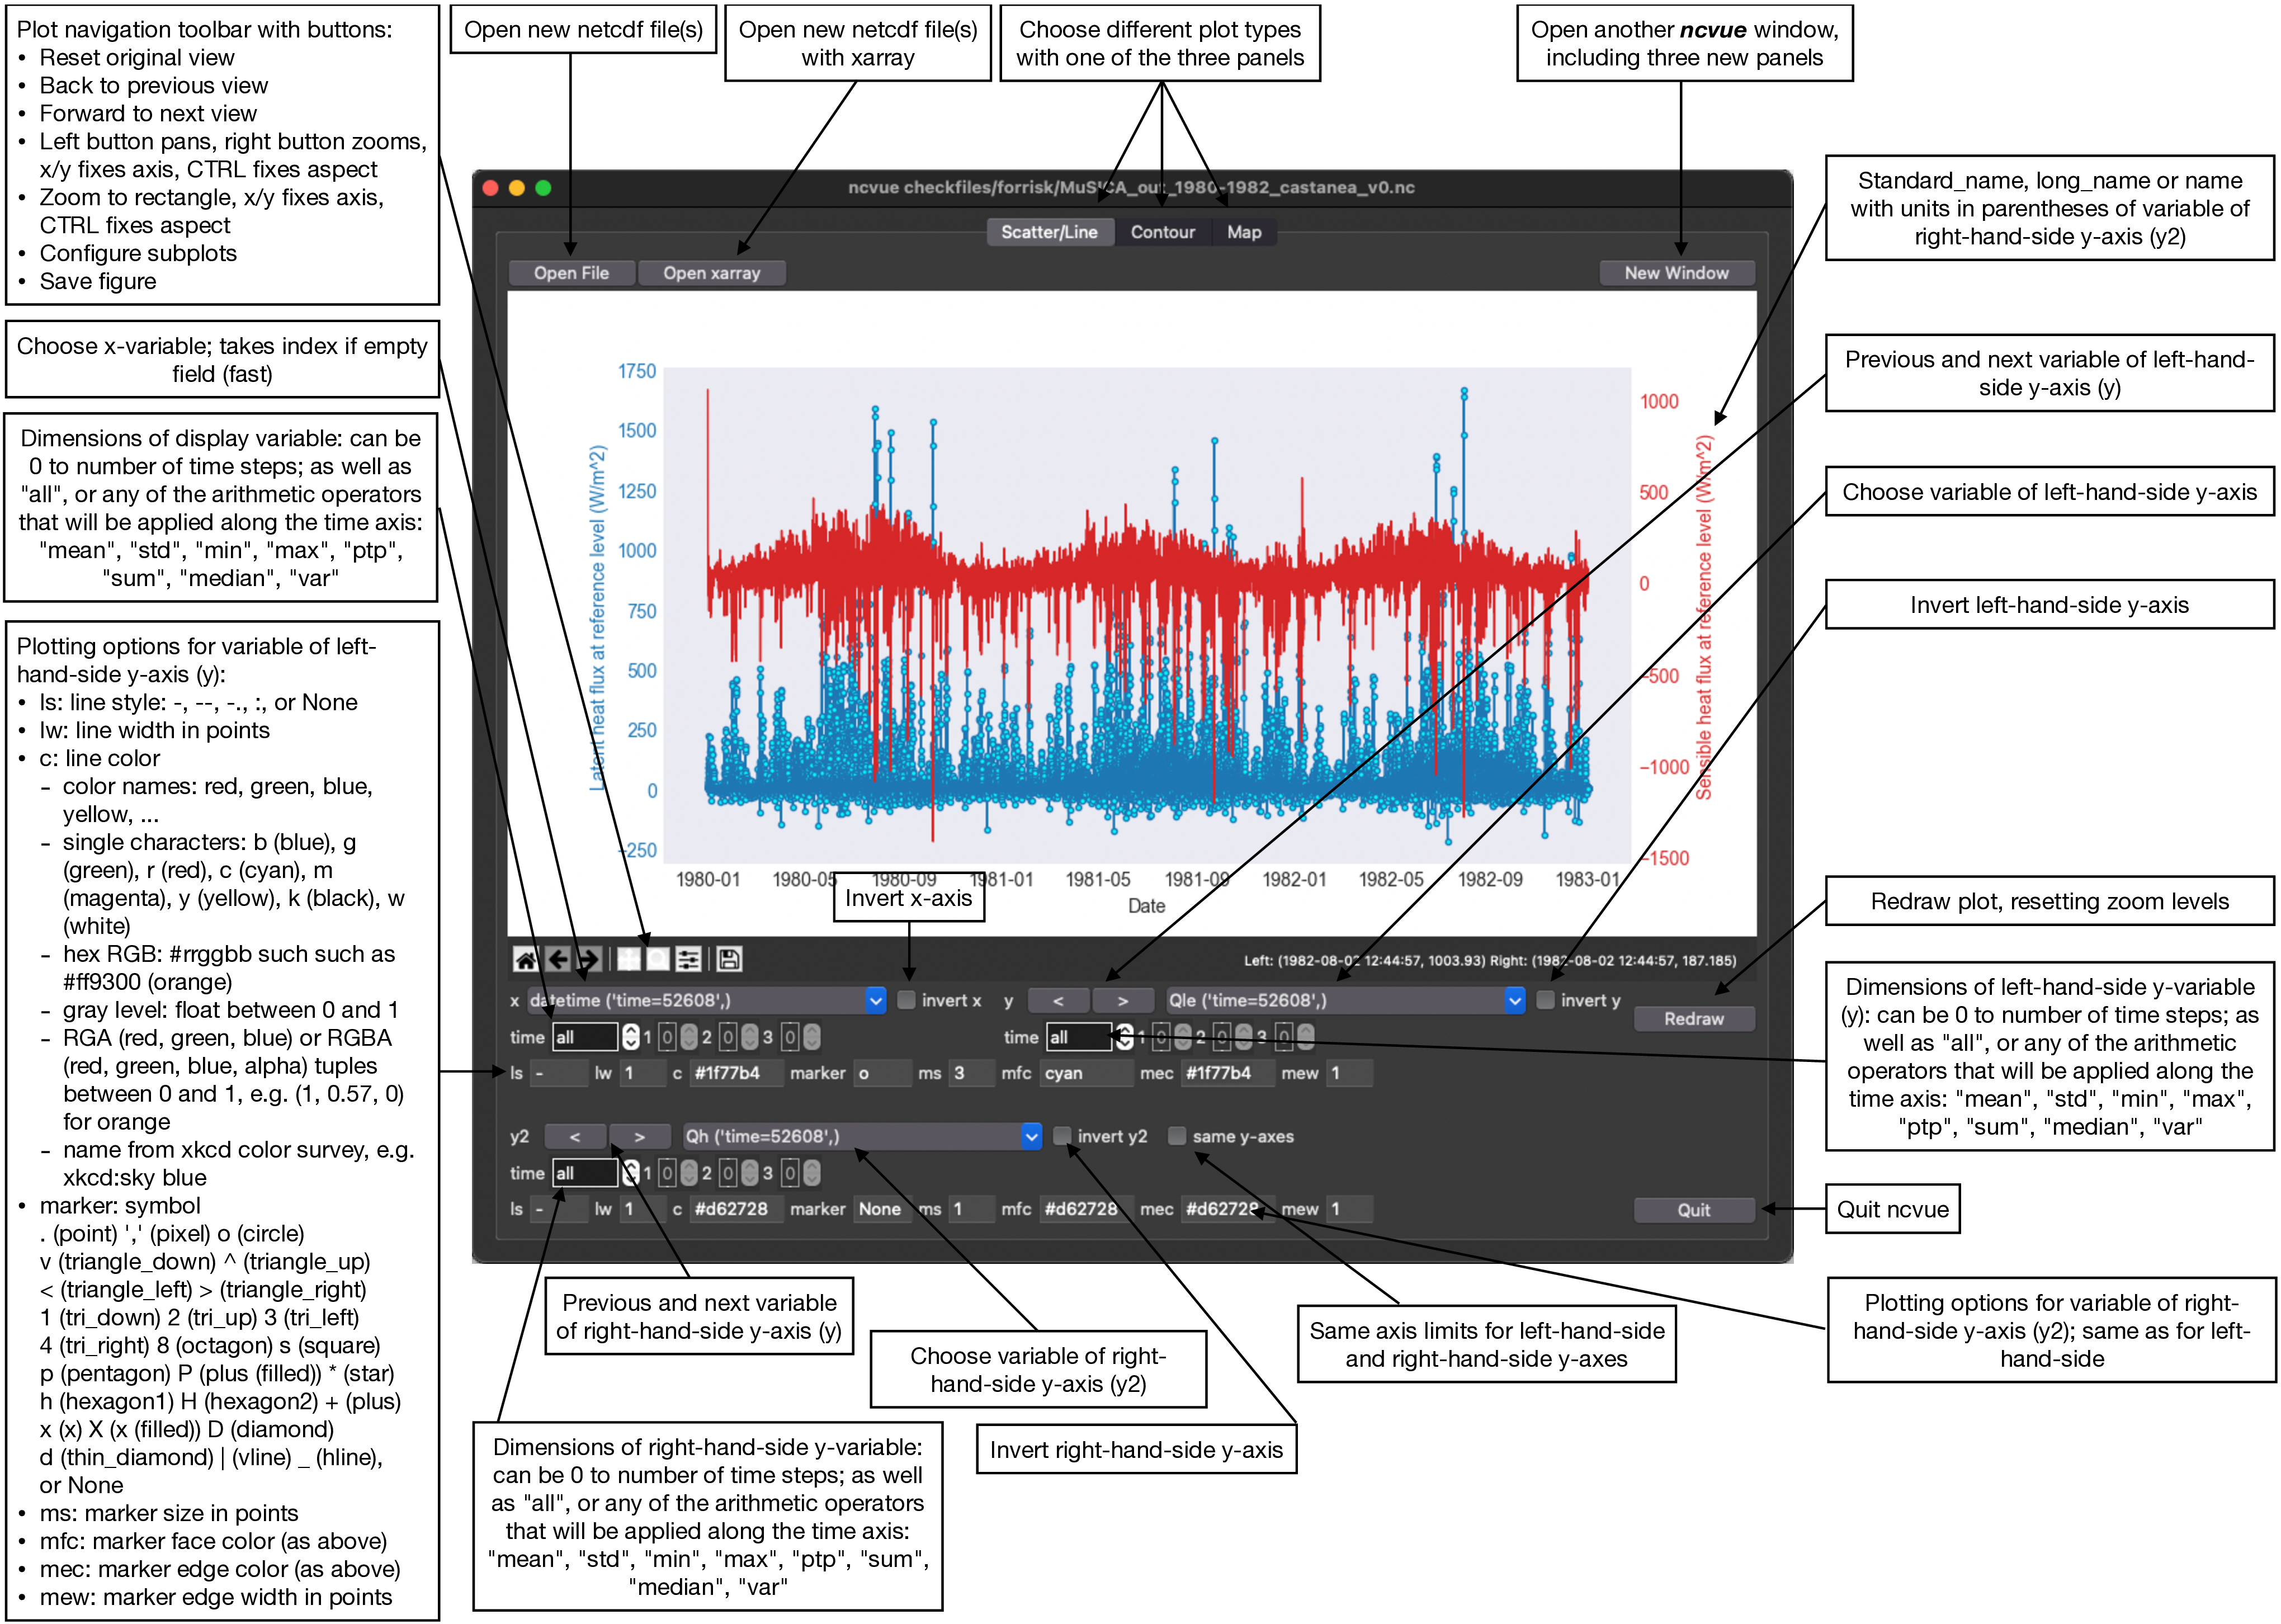
The default plot is a line plot with solid lines (line style ‘ls’ is ‘-‘). One can set line style ‘ls’ to None and set a marker symbol (marker), e.g. ‘o’ for circles, to get a scatter plot. A large variety of line styles, marker symbols, and color notations are supported. They are listed in the tooltips that appear if you hove longer than 0.5 s above an entry field.
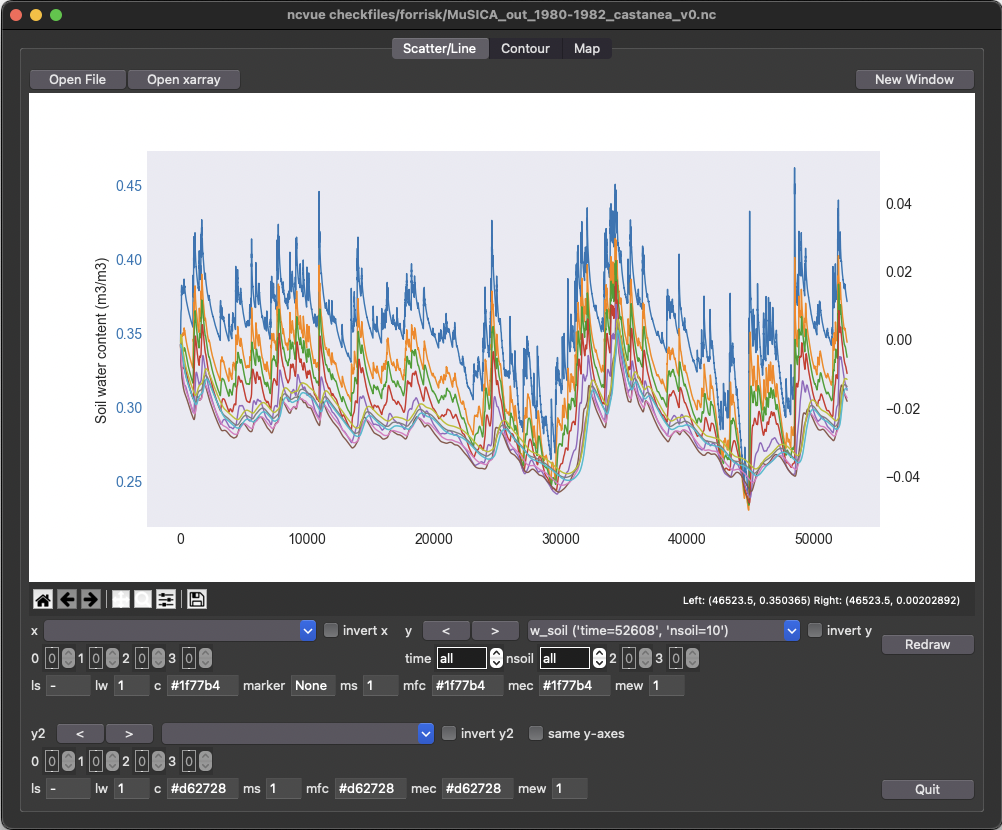
ncvue builds automatically a datetime variable from the time axis. This is correctly interpreted by the underlying matplotlib also when zooming or panning the axes. But it is also much slower than using the index. Leaving x empty uses the index for the x-axis and is very fast. Plotting a line plot with 52608 time points takes about 2.2 s on my MacBook Pro using the datetime variable and about 0.3 s using the index (i.e. empty x-variable). This is especially true if one plots multiple lines with ‘all’ entries from a specific dimension. Plotting all 10 depths of soil water content for the 52608 time points, as in the example below, takes also about 0.3 s if using the index as x-variable but more than 11.1 s when using the datetime variable.
Contour panel
The last panel provide by ncvue draws contour plots. This is the Contour panel in macOS dark mode, describing all buttons, sliders, entry boxes, spinboxes, and menus:
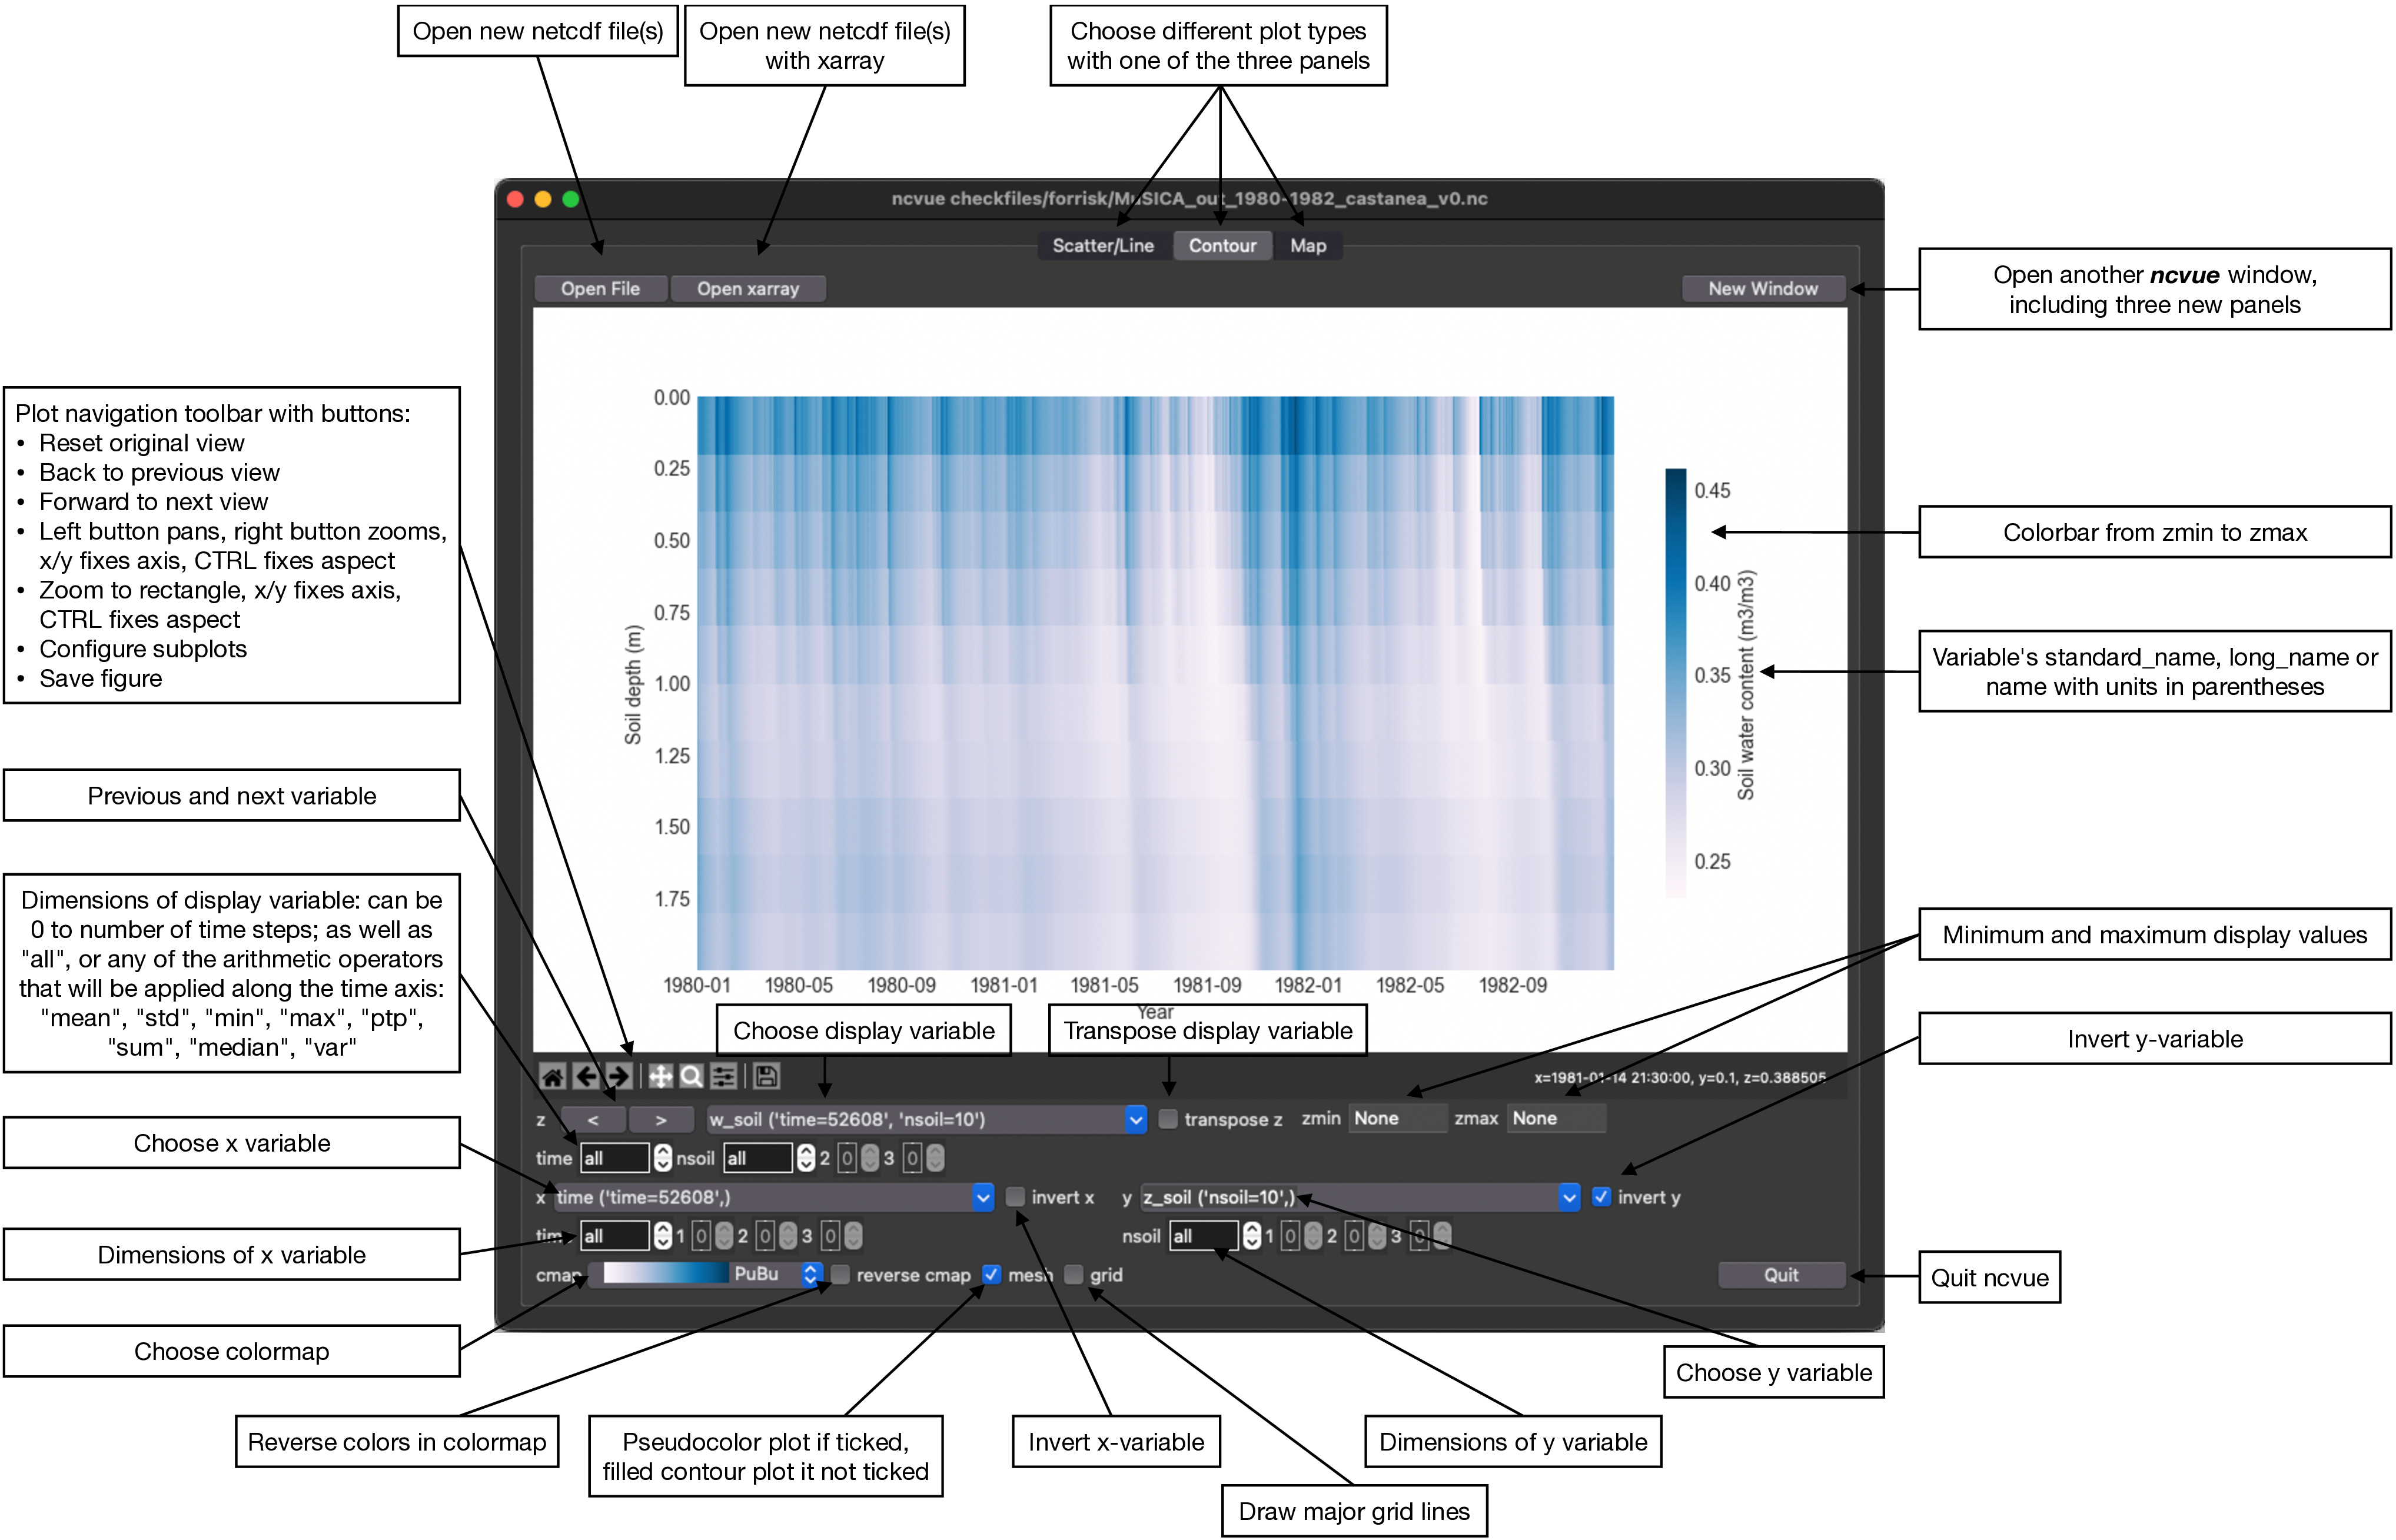
This produces also either pseudocolor plots (‘mesh’ ticked) or filled contour plots (‘mesh’ unticked) just as the Map panel but without any map projection.
License
ncvue is distributed under the MIT License. See the LICENSE file for details.
Copyright (c) 2020-2025 Matthias Cuntz
ncvue uses CustomTkinter if installed. Otherwise it uses the Azure 2.0 theme by rdbende on Linux and Windows.
Standalone applications are produced with cx_Freeze, currently maintained by Marcelo Duarte.
The project structure of ncvue was very originally based on a template provided by Sebastian Müller but has evolved considerably since.
Different netCDF test files were provided by Juliane Mai.
Project details
Verified details
These details have been verified by PyPIProject links
GitHub Statistics
Maintainers
Release history Release notifications | RSS feed


Download files
Download the file for your platform. If you're not sure which to choose, learn more about installing packages.
Source Distribution
Built Distribution
Filter files by name, interpreter, ABI, and platform.
If you're not sure about the file name format, learn more about wheel file names.
Copy a direct link to the current filters
File details
Details for the file ncvue-6.4.1.tar.gz.
File metadata
- Download URL: ncvue-6.4.1.tar.gz
- Upload date:
- Size: 1.1 MB
- Tags: Source
- Uploaded using Trusted Publishing? Yes
- Uploaded via: twine/6.1.0 CPython/3.13.7
File hashes
| Algorithm | Hash digest | |
|---|---|---|
| SHA256 |
ad3484f03a77c1954d50e33f882ffe396cfaa46c635fe0653219cdff3cd92792
|
|
| MD5 |
c4fbf3067b062f24d29be804fcfec2f7
|
|
| BLAKE2b-256 |
1efd2350257a2235a29e3fd723a4a6d5f470c66d117f31c574a8bb5cc854e171
|
Provenance
The following attestation bundles were made for ncvue-6.4.1.tar.gz:
Publisher:
main.yml on mcuntz/ncvue
-
Statement:
-
Statement type:
https://in-toto.io/Statement/v1 -
Predicate type:
https://docs.pypi.org/attestations/publish/v1 -
Subject name:
ncvue-6.4.1.tar.gz -
Subject digest:
ad3484f03a77c1954d50e33f882ffe396cfaa46c635fe0653219cdff3cd92792 - Sigstore transparency entry: 748756930
- Sigstore integration time:
-
Permalink:
mcuntz/ncvue@4a3d688946185186ef1d9e81d88bc063ac16698a -
Branch / Tag:
refs/tags/v6.4.1 - Owner: https://github.com/mcuntz
-
Access:
public
-
Token Issuer:
https://token.actions.githubusercontent.com -
Runner Environment:
github-hosted -
Publication workflow:
main.yml@4a3d688946185186ef1d9e81d88bc063ac16698a -
Trigger Event:
push
-
Statement type:
File details
Details for the file ncvue-6.4.1-py3-none-any.whl.
File metadata
- Download URL: ncvue-6.4.1-py3-none-any.whl
- Upload date:
- Size: 1.2 MB
- Tags: Python 3
- Uploaded using Trusted Publishing? Yes
- Uploaded via: twine/6.1.0 CPython/3.13.7
File hashes
| Algorithm | Hash digest | |
|---|---|---|
| SHA256 |
0b5b17104fd97f0f4003ddca92a878d5f23a68d1504975269894a8828028ac96
|
|
| MD5 |
5063ea3f8b15b6f618f58d33fdcdb845
|
|
| BLAKE2b-256 |
e9dde55def15b28b912aebf48efb4b663969965683c5613a0dd2108c70c81a9d
|
Provenance
The following attestation bundles were made for ncvue-6.4.1-py3-none-any.whl:
Publisher:
main.yml on mcuntz/ncvue
-
Statement:
-
Statement type:
https://in-toto.io/Statement/v1 -
Predicate type:
https://docs.pypi.org/attestations/publish/v1 -
Subject name:
ncvue-6.4.1-py3-none-any.whl -
Subject digest:
0b5b17104fd97f0f4003ddca92a878d5f23a68d1504975269894a8828028ac96 - Sigstore transparency entry: 748756946
- Sigstore integration time:
-
Permalink:
mcuntz/ncvue@4a3d688946185186ef1d9e81d88bc063ac16698a -
Branch / Tag:
refs/tags/v6.4.1 - Owner: https://github.com/mcuntz
-
Access:
public
-
Token Issuer:
https://token.actions.githubusercontent.com -
Runner Environment:
github-hosted -
Publication workflow:
main.yml@4a3d688946185186ef1d9e81d88bc063ac16698a -
Trigger Event:
push
-
Statement type:


