Multi-seasonal remote sensing analysis suite: composites, SAR preprocessing, time series analytics, and land cover classification with Google Earth Engine

Project description
Ndvi2Gif: Multi-Seasonal Remote Sensing Index Composites


Ndvi2Gif is a Python library designed to simplify access to global satellite data through the Google Earth Engine platform. While its name highlights the ability to create seasonal GIF animations, the true power of this tool lies in its capability to compute and export pixel-wise statistics for any region on Earth, across any time span covered by supported remote sensing datasets.
Built on top of Google Earth Engine and Geemap, it allows you to:
- Generate annual or multi-annual composited rasters (e.g., median NDVI per season between 2001 and 2020),
- Apply multiple statistics (mean, max, flexible percentiles) across space and time,
- Export results as GeoTIFFs for further analysis,
- Retrieve zonal statistics over user-defined geometries,
- Monitor vegetation structure with advanced SAR indices,
- Handle incomplete years automatically for real-time monitoring,
- NEW in v0.6.0: Perform supervised and unsupervised land cover classification with integrated machine learning,
- NEW in v0.6.0: Export directly to Google Drive and Earth Engine Assets,
- And yes — also create colorful GIFs for easy visualization.
Whether you're monitoring crop phenology, detecting harvest events, assessing drought trends, classifying land cover, or preparing input layers for further ecological modeling, ndvi2gif makes it easier to extract reliable, multi-temporal remote sensing information at scale.
Ndvi2Gif was updated and extended as part of its integration into the eLTER and SUMHAL projects, which also enabled the use of eLTER site boundaries (via deimsPy) as one of its input sources.

📚 Documentation
Complete documentation is now available as an interactive Jupyter Book:
🔗 https://digdgeo.github.io/Ndvi2Gif/
- Getting Started Guide - Installation and authentication
- API Reference - Complete class and method documentation
- Datasets Guide - Detailed specs for all 7 platforms
- Indices Catalog - Reference for all 88 variables
- Climate Analysis Tutorial - ERA5 & CHIRPS workflows
✨ What's New in v1.0.0 / v1.1.0
- FAI (Floating Algae Index) — multi-sensor cyanobacterial bloom detection (Sentinel-2, Landsat, MODIS)
- ERA5-Land & CHIRPS climate reanalysis support (47 variables + precipitation, 1950–present)
- LandCoverClassifier — supervised and unsupervised land cover classification (RF, SVM, K-means…)
- Enhanced statistics (
sum,min), direct export to Google Drive and Earth Engine Assets - Complete Jupyter Book documentation
Why use Ndvi2Gif?
Unlike many visualization-oriented tools, Ndvi2Gif is designed as a remote sensing analytics suite that abstracts much of the complexity of working directly with Google Earth Engine, while giving you the flexibility to go far beyond GIF creation.
You can:
-
Access pixel-wise statistics over any Earth location, at any scale and time span.
- Example: Obtain the monthly median of the 85th NDVI percentile per pixel from 1984 to 2024 using Landsat data.
- Example: Calculate the maximum of the seasonal NDWI maximums between 2017 and 2023 using Sentinel-2.
- Example: Monitor crop harvest timing with bi-monthly VV/VH ratio analysis using Sentinel-1.
- Example: Track daily algal blooms with Sentinel-3 OLCI turbidity indices.
-
Perform advanced machine learning classification (NEW in v0.6.0):
- Multi-temporal land cover mapping with Random Forest
- Crop type classification with SVM
- Unsupervised clustering with K-means
- Feature importance analysis for ecological insights
-
Perform nested aggregations:
First compute temporal summaries (e.g., per-season percentiles or means), then apply a second statistical reduction across years (e.g., median, min, max). -
Run advanced time series analysis with the
TimeSeriesAnalyzer:- Trend detection (Mann-Kendall, Sen's slope, linear regression)
- Multi-panel dashboards (seasonal patterns, autocorrelation, data quality)
- Phenology metrics such as Start/End of Season, Peak, Length, amplitude, and rates of change
-
Preprocess Sentinel-1 SAR like a pro with the
S1ARDProcessor:- Radiometric terrain correction for mountainous regions
- Multiple speckle filtering options (Boxcar, Lee, Refined Lee, Gamma-MAP, Lee Sigma)
- Flexible DEM support (Copernicus and SRTM)
-
Target any ecological or phenological metric by choosing the appropriate index and analysis pipeline.
-
Work globally, without needing to download or preprocess raw satellite data — all computations are handled via Earth Engine's cloud infrastructure.
-
Handle real-time monitoring with automatic detection of available data periods for incomplete years.
In other words: if you can describe a temporal range, a spatial region, an index, and a chain of statistics — ndvi2gif can not only generate it, but now also help you classify, analyze and interpret the changes over time.
Yes, it makes nice GIFs — but it's much more than that.
Supported Input Formats for ROI
| Input Type | Description | Example / Notes |
|---|---|---|
| Drawn Geometry | Use geemap to draw a polygon directly on a map | Works in Jupyter Notebooks |
| Shapefile / GeoJSON | Provide a file path to a vector dataset | EPSG:4326 recommended |
| eLTER site ID | Use deimsPy to fetch site boundaries by DEIMS ID |
e.g., deimsid:ab8278e6-0b71-4b36-a6d2-e8f34aa3df30 |
| Sentinel-2 Tile | Specify MGRS tile code (e.g., T30TYN) |
Automatically fetches tile geometry |
| Landsat Path/Row | Provide WRS-2 path and row codes (e.g., 198/034) |
Covers full Landsat archive |
Included Statistics
- Maximum - Peak values for cloud-free compositing
- Mean - Average values across time period
- Median - Robust central tendency, excellent for noisy data
- Sum - Total accumulation (ideal for precipitation, runoff, radiation)
- Flexible Percentiles - Any percentile from 1 to 99
- Custom percentiles like 75th, 85th, or 99th for specific applications
- Perfect for handling varying cloud contamination levels
Available Indices
🌱 Basic Optical Indices (S2, Landsat, MODIS, S3)
- NDVI - Normalized Difference Vegetation Index
- EVI - Enhanced Vegetation Index
- GNDVI - Green Normalized Difference Vegetation Index
- SAVI - Soil Adjusted Vegetation Index
- NDWI - Normalized Difference Water Index
- MNDWI - Modified Normalized Difference Water Index
- AWEI - Automated Water Extraction Index
- AEWINSH - AWEI No Shadow
- NDSI - Normalized Difference Snow Index
- NBRI - Normalized Burn Ratio Index
- NDMI - Normalized Difference Moisture Index
🌾 Advanced Optical Indices (S2, Landsat, MODIS, S3)
- MSI - Moisture Stress Index (drought monitoring)
- NMI - Normalized Multi-band Drought Index
- NDTI - Normalized Difference Tillage Index
- CRI1/CRI2 - Carotenoid Reflectance Indices
- LAI - Leaf Area Index approximation
- PRI - Photochemical Reflectance Index
- WDRVI - Wide Dynamic Range Vegetation Index
🔬 Sentinel-2 Exclusive (Red Edge B5-B7)
- IRECI - Inverted Red-Edge Chlorophyll Index (high sensitivity chlorophyll)
- MCARI - Modified Chlorophyll Absorption Ratio Index
- NDRE - Normalized Difference Red Edge (chlorophyll content)
- REIP - Red Edge Inflection Point (vegetation stress)
- PSRI - Plant Senescence Reflectance Index (crop maturity)
- CIRE - Chlorophyll Index Red Edge
- MTCI - MERIS Terrestrial Chlorophyll Index
- S2REP - Sentinel-2 Red Edge Position
- NDCI - Normalized Difference Chlorophyll Index (cyanobacteria/water quality) 🆕
- CIG - Chlorophyll Index Green
💧 Water Quality Indices (S2, Landsat, MODIS)
- FAI - Floating Algae Index (Hu 2009) — cyanobacterial bloom and floating algae detection using NIR baseline interpolation with sensor-specific wavelengths 🆕
🌊 Sentinel-3 Exclusive (OLCI 21-band)
- OCI - OLCI Chlorophyll Index (optimized for S3)
- TSI - Trophic State Index (water quality assessment)
- CDOM - Colored Dissolved Organic Matter Index
- Turbidity - Water Turbidity Index (sediment monitoring)
- SPM - Suspended Particulate Matter Index
- KD490 - Diffuse Attenuation Coefficient at 490nm
- Floating Algae - Floating Algae Index variant for OLCI (NIR-based, no SWIR)
- Red Edge Position - OLCI-optimized red edge position
- Fluorescence Height - Chlorophyll fluorescence detection
- Water Leaving Reflectance - Aquatic reflectance analysis
🛰️ SAR Indices (Sentinel-1)
- RVI - Radar Vegetation Index (recommended for vegetation monitoring)
- VV/VH Ratio - Polarization ratio (excellent for structural change detection)
- VH - Cross-polarization (sensitive to volume scattering from vegetation)
- VV - Co-polarization (sensitive to surface roughness)
- DPSVI - Dual-pol SAR Vegetation Index (optimized for dense vegetation)
- RFDI - Radar Forest Degradation Index (deforestation monitoring) 🆕
- VSDI - Vegetation Scattering Diversity Index (structural diversity) 🆕
🌡️ Climate Reanalysis Datasets 🆕
ERA5-Land Climate Variables (ECMWF)
Temperature:
- temperature_2m - Air temperature at 2m height (K)
- dewpoint_temperature_2m - Dewpoint temperature (K)
- skin_temperature - Earth surface temperature (K)
- soil_temperature_level_1 - Soil temperature 0-7cm depth (K)
Precipitation & Water Balance:
- total_precipitation_sum - Daily precipitation (m)
- total_evaporation_sum - Total evapotranspiration (m)
- potential_evaporation_sum - Potential ET (m)
- runoff_sum - Total runoff (m)
- surface_runoff_sum - Surface runoff only (m)
Soil Moisture:
- volumetric_soil_water_layer_1-4 - Soil water content at 4 depth layers (m³/m³)
Radiation & Energy:
- surface_solar_radiation_downwards_sum - Incoming solar radiation (J/m²)
- surface_net_solar_radiation_sum - Net solar radiation (J/m²)
- surface_latent_heat_flux_sum - Latent heat flux (J/m²)
Wind & Pressure:
- u_component_of_wind_10m - Eastward wind at 10m (m/s)
- v_component_of_wind_10m - Northward wind at 10m (m/s)
- surface_pressure - Atmospheric pressure (Pa)
Snow:
- snow_depth_water_equivalent - Snow water equivalent (m)
- snowfall_sum - Daily snowfall (m)
Note: All temperature variables also available in Celsius (add _celsius suffix). Precipitation variables available in L/m² (add _lm2 suffix). Daily min/max available for temperature variables (add _min or _max suffix).
CHIRPS Precipitation (UCSB Climate Hazards Center)
Daily Precipitation:
- precipitation - Daily rainfall from satellite + station data (mm/day)
- Temporal coverage: 1981-present
- Spatial resolution: ~5.5 km (0.05°)
- Geographic extent: 50°S to 50°N
- Use
key='sum'for monthly/seasonal totals - Use
key='mean'for average daily rates
Ideal for drought monitoring, trend analysis, and precipitation climatology in tropical/subtropical regions.
🧠 Machine Learning Classification (NEW in v0.6.0)
Supervised Classification Algorithms
- Random Forest - With feature importance analysis
- Support Vector Machine (SVM) - For complex decision boundaries
- CART - Classification and Regression Trees
- Naive Bayes - Probabilistic classification
- Gradient Tree Boost - Advanced ensemble method
Unsupervised Clustering
- K-means - Classic clustering algorithm
- Cascade K-means - Hierarchical clustering approach
- LDA - Latent Dirichlet Allocation for pattern discovery
Classification Workflow
from ndvi2gif import NdviSeasonality, LandCoverClassifier

# Create multi-temporal features
processor = NdviSeasonality(
    roi='study_area.shp',
    sat='S2',
    periods=12,
    start_year=2022,
    end_year=2024
)

# Initialize classifier
classifier = LandCoverClassifier(processor)

# Create feature stack with multiple indices
features = classifier.create_feature_stack(
    indices=['ndvi', 'evi', 'ndwi', 'ndre'],
    include_statistics=True,
    normalize=True
)

# Add training data
classifier.add_training_data('training_samples.shp')

# Classify with Random Forest
classification = classifier.classify_supervised('random_forest')

# Assess accuracy
classifier.assess_accuracy()

# Export results
processor.export_to_drive(
    image=classification,
    description="landcover_2024",
    folder="classifications"
)
Supported Datasets
Sentinel:
- Sentinel-1 (SAR) - Enhanced with dual polarization (VV+VH), speckle filtering, and orbit control
- Sentinel-2 (Surface Reflectance) - High resolution optical imagery with Red Edge bands
- Sentinel-3 OLCI (Level-1B TOA) - 21-band ocean and land color instrument with daily global coverage 🆕
Landsat (Surface Reflectance):
MODIS (Surface Reflectance):
Climate Reanalysis:
- ERA5-Land (Daily Aggregated) - ECMWF climate reanalysis with 47 variables (temperature, precipitation, evapotranspiration, soil moisture, radiation, wind, pressure, snow) from 1950-present at ~11km resolution 🆕
- CHIRPS (Daily) - High-resolution daily precipitation combining satellite imagery with station data (1981-present, ~5.5km, 50°S-50°N) 🆕
You can combine any of the supported indices, datasets, and statistical methods. By default, the tool uses NDVI with the maximum statistic to avoid cloud contamination. However, median and custom percentiles are often visually better for Landsat datasets and specific applications.
Note: Sentinel-2 uses Surface Reflectance, Sentinel-3 uses Level-1B TOA radiance (optimized for aquatic applications), while Landsat and MODIS use Surface Reflectance (SR) for superior atmospheric correction and scientific quality.
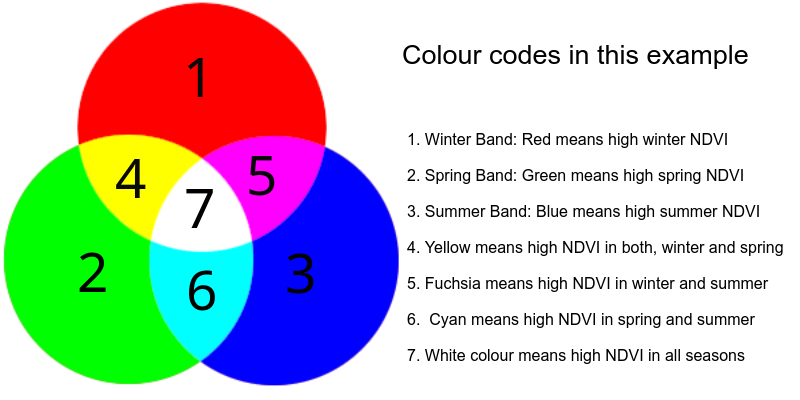
The tool generates rasters with 4 (seasons), 12 (months), or 24 (custom periods) bands per year.
Beyond creating a nice-looking animated GIF, this multi-seasonal compositing method provides insights into vegetation dynamics, phenology, land cover, and more. High values in all seasons (white tones) typically mean perennial vegetation, while low values (dark tones) might represent water, soil, or impervious surfaces.
GeoTIFF Export
You can also export seasonal composites as GeoTIFF files for further analysis. Multi-year composites are supported as well. For example, you can export median NDVI per season for all of Africa between 2001–2020, bi-monthly VV/VH ratios for crop monitoring, or daily Sentinel-3 turbidity indices for water quality assessment.
📤 Enhanced Export Capabilities (NEW in v0.6.0)
Google Drive Export
Export any image or classification directly to your Google Drive:
processor.export_to_drive(
    image=classified_map,
    description="landcover_2023",
    folder="ndvi2gif_results",
    scale=30,
    crs="EPSG:4326",
    maxPixels=1e13
)
Earth Engine Asset Export
Save results as Earth Engine Assets for further processing:
processor.export_to_asset(
    image=classification,
    asset_id="users/yourname/landcover_2023",
    pyramiding_policy={"class": "mode"},
    overwrite=True
)
Automatic Scale Detection
The library now automatically selects the appropriate scale based on the sensor:
- Sentinel-2: 10m
- Sentinel-3: 300m
- Landsat: 30m
- MODIS: 500m
- Sentinel-1: 10m
Installation
You can install ndvi2gif using either pip or conda:
Using pip:
pip install ndvi2gif
Using conda:
conda install -c conda-forge ndvi2gif
Quick Usage Example
import ee
from ndvi2gif import NdviSeasonality, TimeSeriesAnalyzer

ee.Authenticate()
ee.Initialize()

# Monthly NDVI composites (2018–2024) from Sentinel-2
ndvi = NdviSeasonality(
    roi=your_roi, sat='S2', periods=12,
    start_year=2018, end_year=2024,
    key='percentile', percentile=85, index='ndvi'
)
composite = ndvi.get_year_composite()
ndvi.get_gif(name='ndvi_evolution.gif')

# Trend detection and phenology analysis
ts = TimeSeriesAnalyzer(ndvi)
df = ts.extract_time_series()
ts.analyze_trend(df)
ts.plot_comprehensive_analysis()
For more examples see the example notebooks or the documentation.
Use Cases
🤖 Land Cover Classification (NEW in v0.6.0)
- Multi-temporal crop type mapping
- Urban expansion monitoring
- Forest change detection
- Wetland classification
- Feature importance analysis for ecological studies
🌾 Agricultural Monitoring
- Crop phenology tracking with optical indices
- Crop type classification with Random Forest
- Harvest timing detection with SAR VV/VH ratios
- Irrigation monitoring with NDWI
- Yield prediction with multi-temporal NDVI
- Precision agriculture with Red Edge indices (S2 exclusive)
🌊 Water Quality & Environmental Monitoring
- Daily algal bloom detection with Sentinel-3
- Cyanobacteria monitoring with NDCI (S2 Red Edge)
- Lake and coastal water quality assessment
- Turbidity and sediment tracking
- Harmful algal bloom early warning systems
🌍 Environmental Research
- Drought assessment with flexible percentile analysis
- Vegetation change detection combining optical and SAR
- Snow cover analysis with NDSI
- Multi-sensor ecosystem monitoring
- Land cover change with machine learning classification
📊 Operational Applications
- Real-time monitoring with incomplete year support
- Multi-year trend analysis for climate studies
- Automated reporting with GeoTIFF exports
- Quality assessment with robust statistics
- Geometric consistency with SAR orbit control
- Direct export to Google Drive and Earth Engine Assets
- Generate reference rasters for pseudo-invariant feature normalization (ProtocoloV2)
Contributing
We welcome contributions from the community! Whether you're a developer, researcher, or just curious about remote sensing, your input can help improve Ndvi2Gif.
🐛 Bug reports: GitHub Issues
💡 Feature requests: GitHub Discussions
🤝 Pull requests: Always welcome!
📚 Example contributions: Share your use cases in the examples_notebooks/ folder
📖 Citation
JOSS Manuscript in preparation. For now, please cite this software as:
@software{garcia_diaz_ndvi2gif_2024,
  author = {García Díaz, Diego},
  title = {ndvi2gif: Multi-Seasonal Remote Sensing Analysis Suite},
  url = {https://github.com/Digdgeo/Ndvi2Gif},
  version = {0.7.0},
  year = {2025}
}
Project Statistics
- Current Version: 1.1.0
- Supported Sensors: 7 (S1, S2, S3, Landsat, MODIS, ERA5-Land, CHIRPS)
- Available Indices/Variables: 89 (40+ vegetation/water indices + 47 ERA5 climate variables + 1 CHIRPS precipitation)
- ML Algorithms: 8 (5 supervised, 3 unsupervised)
- Lines of Code: ~4,800
- Documentation Coverage: 95%+
- Test Coverage: Growing with each release
License
This project is licensed under the MIT License - see the LICENSE.txt file for details.
Acknowledgments
- Built on Google Earth Engine and geemap
- Special thanks to Qiusheng Wu and to the Google Earth Engine team and the open-source remote sensing community
Release history Release notifications | RSS feed


Download files
Download the file for your platform. If you're not sure which to choose, learn more about installing packages.
Source Distribution
Built Distribution
Filter files by name, interpreter, ABI, and platform.
If you're not sure about the file name format, learn more about wheel file names.
Copy a direct link to the current filters
File details
Details for the file ndvi2gif-1.2.0.tar.gz.
File metadata
- Download URL: ndvi2gif-1.2.0.tar.gz
- Upload date:
- Size: 117.7 kB
- Tags: Source
- Uploaded using Trusted Publishing? No
- Uploaded via: twine/6.2.0 CPython/3.10.20
File hashes
| Algorithm | Hash digest | |
|---|---|---|
| SHA256 |
4d25ceda571d2d15715cc29d60e1180095af78d8c7330a6ff4d4fabb6816a80a
|
|
| MD5 |
51fa81b700d2a48ac6aaa771e402e209
|
|
| BLAKE2b-256 |
e782115aba39ee31b1a1c7d61cfd0f7e94a703a57cffacd9a640f53140154371
|
File details
Details for the file ndvi2gif-1.2.0-py3-none-any.whl.
File metadata
- Download URL: ndvi2gif-1.2.0-py3-none-any.whl
- Upload date:
- Size: 100.9 kB
- Tags: Python 3
- Uploaded using Trusted Publishing? No
- Uploaded via: twine/6.2.0 CPython/3.10.20
File hashes
| Algorithm | Hash digest | |
|---|---|---|
| SHA256 |
915369314c1822672369e190edf060d322f5918811eec1a434bff42f4a698c33
|
|
| MD5 |
f7f0921cf8e84ac9d1d2ef7744b3c997
|
|
| BLAKE2b-256 |
a616005dc2396fe1d102abc2e5ccff1b51bfab36b75e9c70d23ad8cb95ef459f
|


