A matplotlib wrapper; It may help you to write plotting code briefly.

Project description
necoplot
necoplot is a matplotlib wrapper.
It may help you to write plotting code briefly.
Installation
pip install necoplot
Usage examples
import necoplot as neco
import numpy as np
xx = np.linspace(-5,5,20)
yy = xx*xx
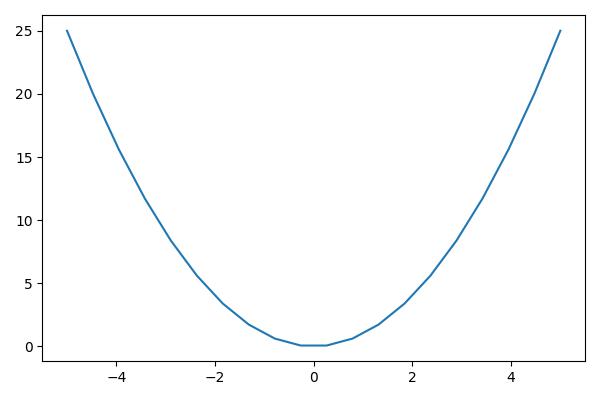
# Basic
with neco.plot() as ax:
ax.plot(xx, yy)
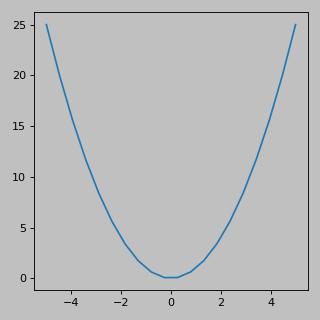
# Config figiure
with neco.plot(figsize=(4,4), dpi=80, facecolor='silver') as ax:
    ax.plot(xx, yy)
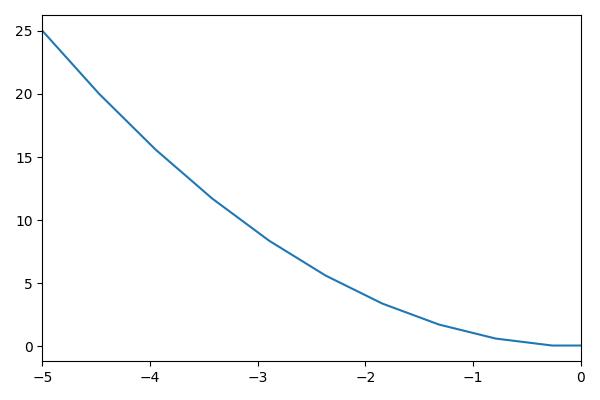
# Config ax by plot()
with neco.plot(figsize=(6,4), xlim=(-5,0)) as ax:
    ax.plot(xx, yy)
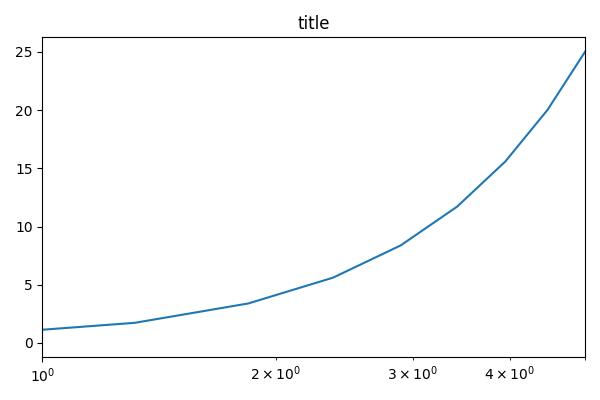
# Config ax by using config_ax()
ax0 = neco.config_ax(xlim=(1,5), title='title', xscale='log')

with neco.plot(ax0, figsize=(6,4)) as ax:
    ax.plot(xx, yy)
# Config ax directry
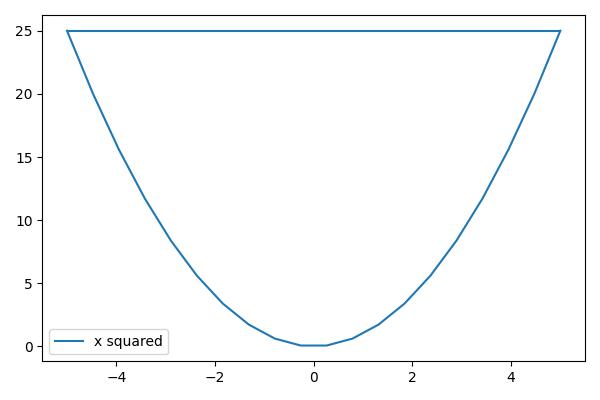
with neco.plot() as ax:
ax.plot(xx, yy, label='x squared')
ax.legend()
ax.hlines(y=25, xmin=-5, xmax=5)
# Save figure
with neco.plot() as ax:
    ax.plot(xx, yy)
    neco.save('sample.png', show=False)
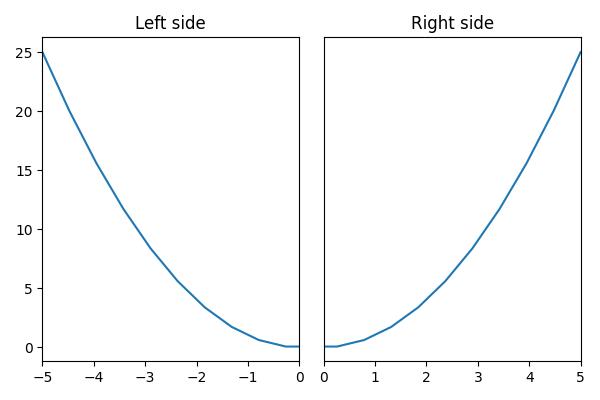
# Plot multiple with mplot()
ax0 = neco.config_ax(121, xlim=(-5, 0),title='Left side')
ax1 = neco.config_ax(122, xlim=(0, 5), title='Right side', yticks=[])

with neco.mplot([ax0, ax1]) as p:
    p.axes[0].plot(xx, yy)
    p.axes[1].plot(xx, yy)
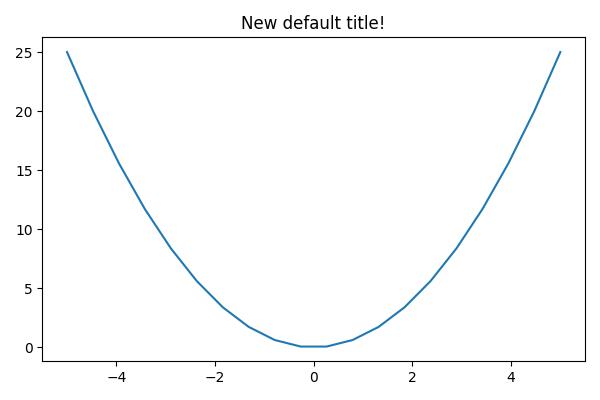
# Config default values
neco.config_user_parameters(title='New default title!')

with neco.plot() as ax:
    ax.plot(xx, yy)
# Reset config
neco.reset()
Adovanced
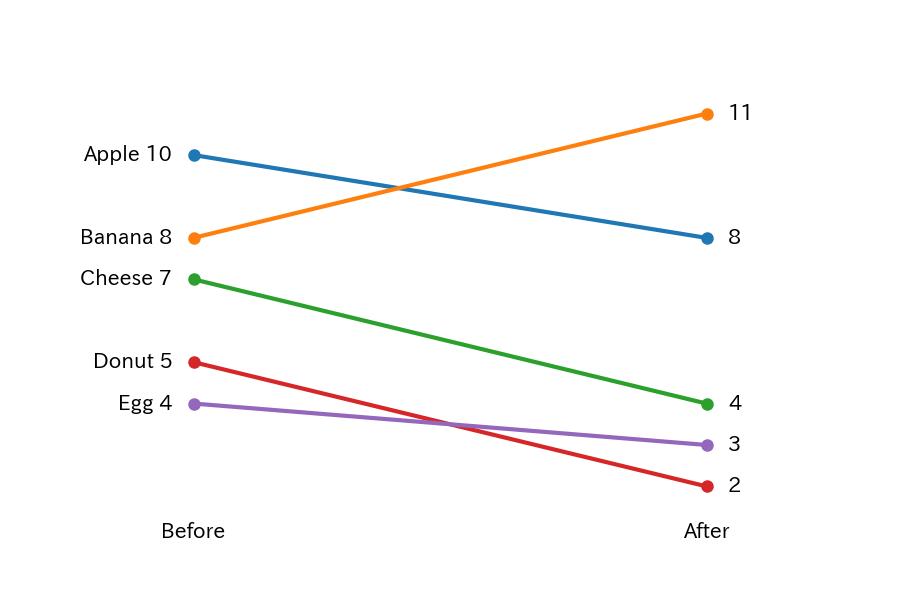
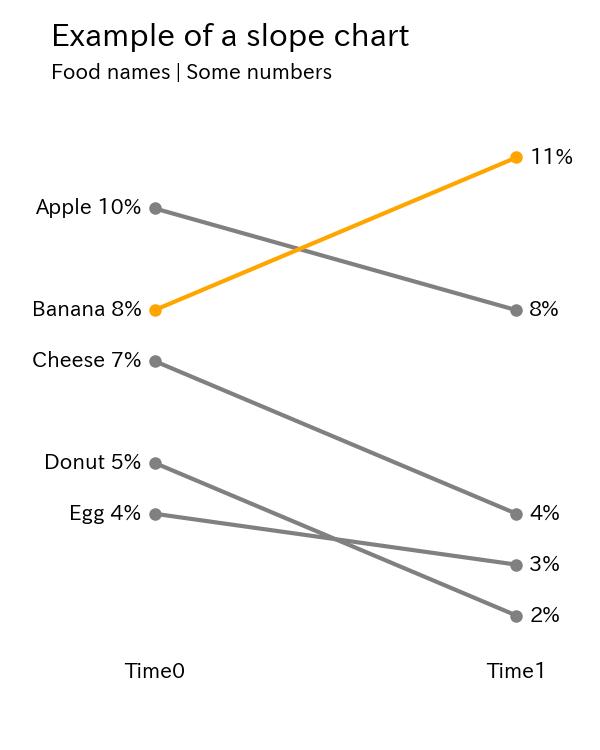
Slope chart
# Make a simple slope chart
names = ['Apple', 'Banana', 'Cheese', 'Donut', 'Egg']
time0 = [10, 8, 7, 5, 4]
time1 = [8, 11, 4, 2, 3]

with neco.slope() as slope:
    slope.plot(time0, time1, names)
# Make another chart which a little more complicated
title = 'Example of a slope chart'
subtitle = 'Food names | Some numbers'

with neco.slope(figsize=(4, 5)) as slope:
    slope.highlight({'Banana':'orange'})
    slope.config(xstart=0.2, xend=0.9, suffix='%')
    slope.plot(time0, time1, names, xticks=('Time0', 'Time1'),
               title=title, subtitle=subtitle)


Download files
Download the file for your platform. If you're not sure which to choose, learn more about installing packages.
Source Distribution
necoplot-0.1.5.tar.gz
(7.7 kB
view details)
Built Distribution
Filter files by name, interpreter, ABI, and platform.
If you're not sure about the file name format, learn more about wheel file names.
Copy a direct link to the current filters
File details
Details for the file necoplot-0.1.5.tar.gz.
File metadata
- Download URL: necoplot-0.1.5.tar.gz
- Upload date:
- Size: 7.7 kB
- Tags: Source
- Uploaded using Trusted Publishing? No
- Uploaded via: poetry/1.1.13 CPython/3.10.4 Darwin/21.4.0
File hashes
| Algorithm | Hash digest | |
|---|---|---|
| SHA256 |
0beaa6b0f42e246d2a40c643ef229e56c50af4254fda625055ab6924b503f138
|
|
| MD5 |
a74eb385527e44bd9df8e6c6287bde21
|
|
| BLAKE2b-256 |
bb8f16d393993f4dbbc42de7aa6a2fc3208a195c600b56f67a30bbf12d16204b
|
File details
Details for the file necoplot-0.1.5-py3-none-any.whl.
File metadata
- Download URL: necoplot-0.1.5-py3-none-any.whl
- Upload date:
- Size: 8.4 kB
- Tags: Python 3
- Uploaded using Trusted Publishing? No
- Uploaded via: poetry/1.1.13 CPython/3.10.4 Darwin/21.4.0
File hashes
| Algorithm | Hash digest | |
|---|---|---|
| SHA256 |
a4275daac06010f623da3d9a49e827bca3d5de66170fc111f4a3d80fabfaf536
|
|
| MD5 |
db137d9c854c813b6f2786895a5354fb
|
|
| BLAKE2b-256 |
5a5552ed98e941b9ef5b7f322f86083035e48ec731384a51d402097ef0883b61
|


