
High-performance profiling and data quality tool built with Polars.

Project description
Netra Profiler







High-performance profiling and data quality tool built with Polars
Netra Profiler is a high-performance data profiling tool and diagnostic engine built on top of Polars. It maximizes single-node hardware utilization by leveraging Polars' Rust-based query optimizer and columnar Apache Arrow memory model.
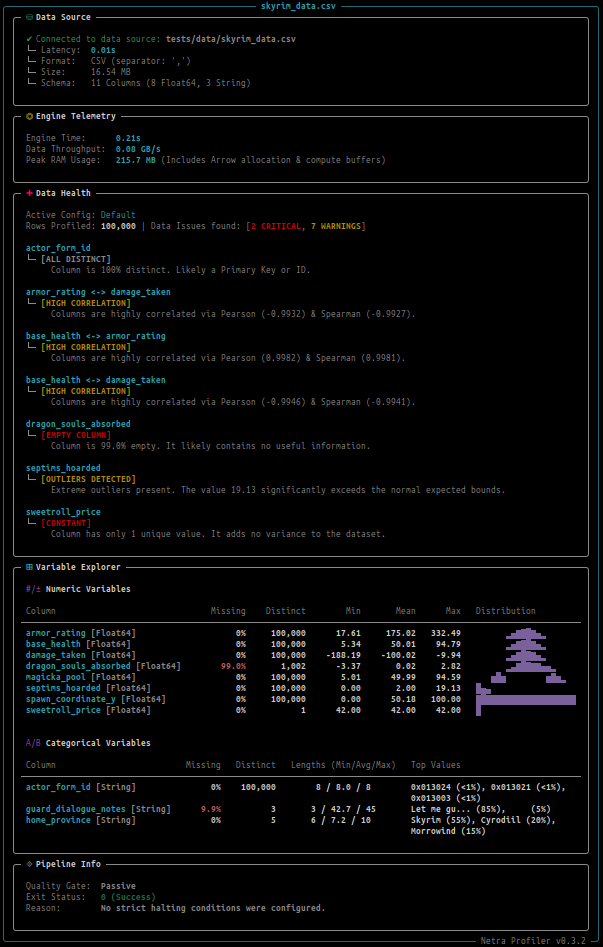
The profiler ships with a configurable diagnostic engine to detect data quality issues in your EDA or ELT workflows. It automatically flags anomalies like extreme zero-inflation, high cardinality, severe data skew, and corrupted primary keys. Netra includes an information-dense, zero-configuration CLI designed to instantly profile your CSV, JSON, IPC/Arrow, and Parquet files directly from the terminal.
Performance Benchmarks
Note: All the scripts used to fetch the dataset, run the benchmarks and generate the results can be found in the 'benchmarks/' directory.
Dataset
To ensure the benchmarks reflect the real-world friction of a typical data workload, we use the New York City TLC Yellow Taxi Trip Records dataset. It contains high-cardinality columns, high-nulls or missing data, and shifting schemas.
When reviewing the metrics below, please keep the following nuances in mind regarding the data:
- Data Organization: The TLC publishes the data as individual
.parquetfiles for every month of the year. To test raw I/O and schema harmonization, we process these files as is, without combining files or pre-processing the data. - The Timeline: We restricted the benchmarks to the years 2018-2024, as the schema remains relatively stable in this interval, and provides sufficient volume for the local benchmarks.
- The COVID-19 Data Cliff: Pre-pandemic files (2018–2019) are significantly larger, containing 8 to 10 million trips per month compared to the 2 to 3 million trips in post-2020 files. For our local tests, we are predominantly using the older files.
- Parquet Compression: All disk sizes referenced in these benchmarks represent the heavily compressed Snappy Parquet files. The actual uncompressed data expanding in-memory is roughly 6x to 10x larger than the on-disk size.
The Data Envelope
Data Envelope is the maximum size and complexity of data your data pipeline can process within your hardware limitations or cloud budget ceiling. Netra Profiler is designed to be a value multiplier for your existing hardware. This allows you to:
- Stay Local Longer: Process larger workloads directly on your laptop or workstation without needing to migrate to an HPC or cloud platform.
- Scale Vertically: Fully saturate a single heavy compute node (like an AWS EC2 instance) to bypass the overhead of complex, multi-node distributed frameworks like Apache Spark.
- Preserve Productivity: Near-interactive profiling at Polars speed leaves no time to get up and grab a coffee while your profiler is spinning up!
A. Single-Node Workstation
All local benchmarks were executed on a consumer laptop machine with the following specifications:
- CPU: Intel(R) Core(TM) i7-10750H CPU @ 2.60GHz (12 Cores)
- RAM: 32 GB
- OS: Ubuntu 24.04.4 LTS
- Storage: 512GB NVMe SSD
We begin the benchmarks by determining the Data Envelope for this machine. To find the exact hardware redline, we tested both tools by incrementally feeding them months/files of data until an Out-Of-Memory (OOM) crash happened.
1. The Local Envelope
| Profiler | Execution Mode | Maximum Safe Envelope |
|---|---|---|
| ydata-profiling | Standard | 359.2 MB (~26.7 Million rows / 3 Months) |
| ydata-profiling | minimal‡ |
728.0 MB (~54 Million rows / 6 Months) |
| netra-profiler | Standard | 3.58 GB (~255.6 Million rows / 52 Months) |
| netra-profiler | low-memory† |
3.58 GB (~255.6 Million rows / 52 Months) |
‡ minimal (ydata-profiling): Turns off the most expensive computations, including the correlations.
† low-memory (netra-profiler): Replaces exact unique counts with an approximate method (HyperLogLog) and skips global sorts (skew, kurtosis and quantiles). Computes the Pearson/Spearman correlation matrices by using a 100,000-row systematic sample.
Netra expands the local data envelope by nearly 5x, allowing developers to profile roughly 4.5 years of continuous NYC Taxi data directly on their laptop without migrating to the cloud.
2. Head-to-Head Performance
Having established the ~359.2 MB (3 Months) ceiling where both modes of ydata-profiling can successfully execute, we conduct a head-to-head performance comparison of the tools across the standard and efficiency modes.
Results below are averaged over 5 consecutive runs + 1 warmup run.
| Execution Mode | netra-profiler | ydata-profiling |
|---|---|---|
| Standard (Full Stats) | 12.48s (6.1 GB RAM) | 572.39s (28.7 GB RAM) |
low-memory / minimal |
5.14s (4.7 GB RAM) | 75.77s (15.3 GB RAM) |
The standard run of ydata-profiling takes more than 9 minutes because Pandas loads all 26.7 million rows of the dataset into memory at once, exhausting the available physical memory and forcing the operating system to use the swap space on the hard drive to keep the process alive. Polars' lazy execution model and streaming data ingestion allow netra-profiler to profile the same data 45x faster (14x faster for the efficiency mode, with correlations) while using a fraction of the RAM.
B. Cloud Scale-Up (Vertical Scaling)
When scaling up to Cloud or HPC infrastructure to handle larger datasets, netra-profiler enables you to maximize the capacity of a single compute node by minimizing processing time and memory overhead. An expanded single-node data envelope allows your team to avoid complex distributed setups like Apache Spark for routine data profiling.
To demonstrate this, we benchmarked the engine on a standard Enterprise HPC node:
- Machine: AWS EC2 r6id.8xlarge (Memory Optimized)
- CPU: 32 vCPUs
- RAM: 256 GB
- OS: Ubuntu 24.04.4 LTS
- Storage: Attached NVMe SSD
1. The Baseline Run (Full Dataset)
We first process the complete 84-month (7 years) dataset to establish the baseline memory requirement to handle the true cardinality of the data. The total file size on disk is 5.13 GB (362.2 Million Rows).
| Execution Mode | Execution Time | Peak RAM |
|---|---|---|
| Standard | 216.75s | 80.4 GB |
low-memory |
50.75s | 55.7 GB |
2. The Throughput Stress Test
To push the hardware to its limits, we created larger datasets with bounded cardinality by using the Polars' Lazy API to replicate the available data. This simulates contexts like IoT telemetry or server logs, where the volume of data is effectively infinite, but the number of unique identifiers (sensors, IP addresses) is fixed. This benchmark effectively tests the maximum I/O throughput.
| Scale | Compressed Size | Execution Mode | Execution Time | Peak RAM |
|---|---|---|---|---|
| 4x | 20.51 GB (1.45 Billion Rows) |
Standard | 829.68s (~14m) | 158.6 GB |
low-memory |
164.39s (~2.7m) | 105.1 GB | ||
| 10x | 51.28 GB (3.62 Billion Rows) |
Standard | 2029.46s (~34m) | 241.5 GB |
low-memory |
417.27s (~7m) | 171.2 GB |
The 10x Standard run saturated ~94% (241.5 GB) of the instance's 256 GB physical memory to profile 51.28 GB of compressed data without triggering an OOM crash. This establishes the data envelope for this specific node size and dataset. Because compressed Parquet typically expands 5-10x in size in-memory, processing a 51 GB workload normally exceeds the physical limits of a 256 GB machine. By expanding the envelope of a vertically scaled single-node to safely process this volume in 33 minutes (or 7 minutes in low-memory mode), netra-profiler avoids the forced transition to costlier, higher-tier instances or the complexity of a distributed cluster.
C. Distributed Multi-Node (Horizontal Scaling)
Because the core engine of netra-profiler is built entirely on the Polars Lazy API, it is natively compatible with the Polars Distributed Layer out-of-the-box. Moving from a vertically scaled single-node workload to a horizontally scaled multi-node cluster will essentially be a low-friction configuration option.
Note: Native support for Polars Cloud & Distributed, and multi-node benchmarks are currently on the roadmap.
Features
- Multi-Core Streaming Engine: Built on Polars, the profiling engine completely bypasses the Python GIL and utilizes 100% of your CPU cores for maximum performance. Unlike legacy tools that must load the entire dataset into memory for profiling, Netra processes data in streaming batches.
- Comprehensive Profiling: Automatically extracts scalar statistics, distributions, and correlation matrices based on column data types. (See the Metrics Table below).
- Built-in Data Quality Checks: Stop bad data before it enters your pipeline. Netra's diagnostic engine automatically flags anomalies like zero-inflation, corrupted primary keys, and extreme skewness. All detection thresholds can be customized globally or on a per-column basis via YAML (See Data Quality Rules below).
- CI/CD Pipeline Gatekeeper: Use strict exit codes (
--fail-on-criticalor--fail-on-warnings) to automatically act as a Data Firewall, breaking your CI/CD builds (GitHub Actions, Airflow, GitLab CI) if corrupted data enters the pipeline. - Data Drift and Schema Diffing: Compare two profiles (e.g., yesterday's data vs. today's data) to automatically detect dropped columns, mutated data types, volume shifts, and statistical data drift in
O(1)time without rescanning the raw data. - Data Contract Generation (ODCS): Automatically translate profiling results and configuration thresholds into Open Data Contract Standard (v3.1.0) compliant YAML files.
- Universal Configuration: A single netra_config.yaml file manages your pipeline execution state, diagnostic quality rules, and data drift thresholds.
- Low-Memory Mode: Process larger datasets safely. By passing the
--low-memoryflag, the profiler switches to approximate counting and sampling techniques to keep RAM usage low. - Complex Type Support: Automatically flattens nested JSON/Parquet Structs and computes length statistics for Lists and Arrays. Zero configuration required.
- Strictly Typed Profile Output: Access the complete mathematical state of your data via a strictly typed JSON export (
--json) or native Python dictionary. Because the output schema is immutable, you can safely program against it to power custom CI/CD quality gates, feed metadata catalogs, or provide context to LLM data agents. - Terminal UI: Includes an information-dense, highly readable CLI dashboard to profile and check your data health directly in the terminal.
- Python API: Integrate seamlessly into Airflow, Dagster, Marimo/Jupyter Notebooks, and custom pipelines with a clean, expressive programmatic interface.
Supported Metrics & Roadmap
| Metric Category | Feature | Target Data Types | Status |
|---|---|---|---|
| Universal | Null Count | All Types | ✅ Active |
Exact Cardinality (n_unique) |
All Types | ✅ Active | |
| Approximate Cardinality (HyperLogLog) | All Types (--low-memory) |
✅ Active | |
| Numeric | Min, Max, Mean | Integers, Floats | ✅ Active |
| Standard Deviation | Integers, Floats | ✅ Active | |
| Skewness & Kurtosis | Integers, Floats | ✅ Active | |
| Exact Quantiles (p25, p50, p75) | Integers, Floats | ✅ Active | |
| Zero Count Detection | Integers, Floats | ✅ Active | |
| Streaming Histograms | Integers, Floats | ✅ Active | |
| Categorical / Text | Min / Max (Lexicographical) | Strings, Categoricals, Enums | ✅ Active |
| String Lengths (Min, Max, Mean) | Strings, Categoricals, Enums | ✅ Active | |
| Top-K Frequent Values | Strings, Categoricals, Enums | ✅ Active | |
| Regex / Pattern Matching | Strings | 🔮 Future | |
| Temporal | Min, Max, Span | Datetime, Date | 🔮 Future |
| Distribution by Time/Day | Datetime, Date | 🔮 Future | |
| Multivariate | Pearson Correlation Matrix | Integers, Floats | ✅ Active |
| Spearman Rank Correlation | Integers, Floats | ✅ Active | |
| Cramer's V (Categorical) | Strings, Categoricals | 🔮 Future | |
| Complex Types | Automatic Struct Flattening | Structs | ✅ Active |
| Array / List Length Distributions | Lists, Arrays | ✅ Active |
Installation
Netra Profiler is built for speed. We recommend installing it with uv, the blazing-fast Python package installer:
uv pip install netra-profiler
(Or use standard pip install netra-profiler)
Quickstart
1. Command Line
The fastest way to profile your data is right from the command line. netra-profiler natively supports .csv, .parquet, .json, and .arrow files.
netra profile path/to/your/dataset.csv
Advanced Execution Options
You can combine flags to handle massive or messy datasets with ease:
--fail-on-critical: Enables the Active Quality Gate. Breaks the pipeline (exits with code 1) if any CRITICAL anomalies are found.--fail-on-warnings: Stricter Quality Gate. Breaks the pipeline if ANY anomalies (Warning or Critical) are found.--low-memory: Triggers the low-memory execution path (approximate counting and sampled correlations).-i, --ignore <column>: Skip profiling for a specific column (perfect for highly cardinal IDs, hashes, or PII).--full-inference: Forces full-file schema inference. Crucial for messy CSVs where data types might silently change deep in the file.--json: Disables the visual CLI output and generates the raw profile payload as a JSON string. Ideal for piping tojqor redirecting to a file:> profile.json.
2. Python API
Netra Profiler exposes a fully typed Python API that accepts Polars DataFrames natively. The output is a rigidly typed Data Contract, making it perfect for programmatic quality gates.
import polars as pl
from netra_profiler import Profiler

# 1. Load your data using Polars (Eager or Lazy)
df = pl.scan_parquet("sales_data.parquet")

# 2. Initialize the Profiler with the configuration
profiler = Profiler(
    df=df,
    dataset_name="Q3_Sales",
    ignore_columns=["transaction_id", "customer_hash"], # Drop highly cardinal IDs to save RAM
)

# 3. Execute the profiling graph
profile = profiler.run(bins=20, top_k=10)

# 4. Access the strictly typed metrics
print(f"Total Rows Profiled: {profile['dataset']['row_count']:,}")

if "revenue" in profile["columns"]:
    mean_revenue = profile["columns"]["revenue"].get("mean")
    print(f"Revenue Mean: ${mean_revenue:.2f}")

# 5. Programmatic Data Quality Gates
# Alerts are categorized by severity (CRITICAL, WARNING, INFO)
alerts = profile.get("alerts", [])
critical_issues = [a for a in alerts if a["level"] == "CRITICAL"]

if critical_issues:
    print(f"\n[PIPELINE HALTED] Found {len(critical_issues)} critical data issues!")
    for issue in critical_issues:
        print(f" - [{issue['column_name']}] {issue['type']}: {issue['message']}")
    raise ValueError("Data quality checks failed. Upstream data contract violated.")
3. Data Drift & Schema Diffing
Netra Profiler allows you to compare two generated profiles to detect schema changes, volume shifts, and statistical data drift. Because this operation compares the JSON profile rather than the raw data, it executes in O(1) time (milliseconds) regardless of dataset size.
1. Generate the baseline and target profiles:
netra profile yesterday.parquet --json > baseline.json
netra profile today.parquet --json > target.json
2. Run the Diff Operation:
netra diff baseline.json target.json
(You can also pass --fail-on-critical or --fail-on-warnings to halt your CI/CD pipeline if breaking schema changes are detected).
You can also seamlessly integrate the Diff Engine directly into your Python workflows:
import json
from netra_profiler.diff import DiffEngine

# 1. Load the generated profiles
with open("baseline.json", "r") as f:
    reference_profile = json.load(f)
with open("target.json", "r") as f:
    target_profile = json.load(f)

# 2. Run the diff operation (Config can optionally be passed here)
engine = DiffEngine(reference_profile, target_profile)
report = engine.run()

# 3. Handle Drift Alerts
drift_alerts = report.get("alerts", [])
for alert in drift_alerts:
    print(f"[{alert['level']}] {alert['column_name']} ({alert['diff_type']}): {alert['message']}")
4. Universal Configuration (netra_config.yaml)
Netra uses a centralized YAML configuration file to manage your pipeline execution state, data quality diagnostics, and drift detection thresholds. The rules are resolved using a cascading method, where global rules can be overridden by column-specific rules. If a check is too noisy for your dataset or analysis, you can explicitly disable it by setting its threshold to false.
To configure the profiler, use a netra_config.yaml file:
# ---------------------------------------------------------
# PIPELINE: CI/CD Execution State
# ---------------------------------------------------------
pipeline:
  fail_on_critical: true         # Halt the process (exit 1) if CRITICAL alerts are found
  fail_on_warnings: false        # Halt the process if WARNING alerts are found

# ---------------------------------------------------------
# DIAGNOSTICS: Dataset Quality Rules
# ---------------------------------------------------------
diagnostics:
  # GLOBAL THRESHOLDS: Apply to all columns by default
  global_thresholds:
    # Null & Missing Data
    null_critical_threshold: 0.95           # Alert CRITICAL if > 95% null (Empty Column)
    null_warning_threshold: 0.50            # Alert WARNING if > 50% null (High Nulls)

    # Variance & Entropy
    constant_check_enabled: true            # Alert CRITICAL if column has only 1 unique value
    zero_inflated_threshold: 0.10           # Alert WARNING if > 10% of numeric values are zero

    # Statistical Distribution
    skew_threshold: 2.0                     # Alert WARNING if absolute skewness exceeds 2.0
    outlier_iqr_multiplier: 3.0             # Alert WARNING for extreme outliers (Tukey IQR method)

    # Strings & Categoricals
    high_cardinality_threshold: 10000       # Alert WARNING if unique strings > 10,000
    string_length_anomaly_multiplier: 50.0  # Alert WARNING if max/min string length deviates from mean

    # Identifiers & Primary Keys
    id_uniqueness_threshold: 0.99           # Alert INFO if > 99% unique (Likely Primary Key)
    min_rows_for_pk_check: 100              # Skip ID checks for tables smaller than 100 rows

    # Schema & Correlation
    possible_numeric_sample_size: 5         # Top-K sample size to detect Strings acting as Numbers
    high_correlation_threshold: 0.95        # Alert WARNING if two numeric columns are > 95% correlated

  # COLUMN OVERRIDES: Surgical exceptions to global rules
  column_overrides:
    # Example: 'middle_name' is expected to be mostly empty
    middle_name:
      null_critical_threshold: false        # Disable critical null check completely
      null_warning_threshold: 0.99          # Only warn if it's 99% empty

    # Example: 'is_active' is a heavily imbalanced boolean flag
    is_active:
      constant_check_enabled: false         # Prevent alerts if all users happen to be active
      zero_inflated_threshold: false        # Prevent alerts if most values are 0 (False)

    # Example: 'customer_hash' is naturally highly cardinal
    customer_hash:
      high_cardinality_threshold: false     # Disable cardinality warning for this specific ID

# ---------------------------------------------------------
# DIFF: Data Drift & Schema Comparison Rules
# ---------------------------------------------------------
diff:
  global_thresholds:
    schema_change_level: "CRITICAL"         # Alert CRITICAL if columns are added/dropped
    type_change_level: "CRITICAL"           # Alert CRITICAL if data types mutate
    row_count_shift_pct: 0.20               # Alert WARNING if total rows change by > 20%
    mean_shift_pct: 0.10                    # Alert WARNING if the mean shifts by > 10%
    null_count_shift_pct: 0.10              # Alert WARNING if missingness shifts by > 10%

  column_overrides:
    daily_revenue:
      mean_shift_pct: 0.50                  # Revenue fluctuates; relax the shift threshold
    user_id:
      n_unique_shift_pct: false             # Disable cardinality shift alerts for IDs
Netra will automatically look for netra_config.yaml in your current working directory. You can also explicitly pass it to the engine in the following ways:
Using Command Line Flag
netra profile dataset.parquet --config path/to/custom_config.yaml
Environment Variable:
export NETRA_CONFIG="/etc/netra/production_rules.yaml"
netra profile dataset.parquet
Python API:
import yaml
from netra_profiler import Profiler

# Option A: Load from a YAML file
with open("rules.yaml", "r") as f:
    config = yaml.safe_load(f)

# Option B: Pass a dictionary directly
config = {
    "diagnostics": {
        "global_thresholds": {"null_critical_threshold": 0.80},
        "column_overrides": {"status": {"constant_check_enabled": False}}
    }
}

profiler = Profiler(df, config=config)
5. Data Contract Generation (ODCS v3.1.0)
Netra Profiler bridges the gap between data observability and governance by automatically generating Open Data Contract Standard (v3.1.0) YAML documents directly from your profiling results.
Instead of writing massive YAML contracts by hand, Netra translates your empirical profile and custom netra_config.yaml thresholds into a ready-to-deploy Data Contract.
1. Generate the JSON Profile:
netra profile dataset.parquet --json > profile.json
2. Generate the Contract:
netra contract profile.json --config netra_config.yaml > contract.yaml
What the Generator Handles Automatically:
-
Schema Inference: Maps Polars' native memory types (e.g.,
Float64,Int32) to ODCSphysicalTypeandlogicalTypefields. -
Empirical Constraints: Injects actual data boundaries (
maxLength,minimum,maximum) directly into thelogicalTypeOptionsblock. -
Completeness Locking: Automatically tags columns with zero missing values as
required: true. -
Primary Key Auto-Discovery: Leaves YAML comments on highly-unique columns, suggesting them as candidate Primary Keys.
-
Dynamic Quality SLAs: Translates your configuration thresholds (
null_critical_threshold,max_duplicate_percent) into nested ODCSqualitymetrics using percentage-based tolerances (unit: percent), ensuring your contract remains robust regardless of future data volume shifts. -
Native SQL Fallback: Automatically generates valid ODCS
type: sqlqueries (e.g., for DuckDB) to handle variance/constant checks for a column.
Release history Release notifications | RSS feed


Download files
Download the file for your platform. If you're not sure which to choose, learn more about installing packages.
Source Distribution
Built Distribution
Filter files by name, interpreter, ABI, and platform.
If you're not sure about the file name format, learn more about wheel file names.
Copy a direct link to the current filters
File details
Details for the file netra_profiler-0.5.1.tar.gz.
File metadata
- Download URL: netra_profiler-0.5.1.tar.gz
- Upload date:
- Size: 329.1 kB
- Tags: Source
- Uploaded using Trusted Publishing? No
- Uploaded via: uv/0.9.3
File hashes
| Algorithm | Hash digest | |
|---|---|---|
| SHA256 |
0e0a9bece341fd78e33a7fd321f06cb8583e50e74b4b53231405187fe34fffeb
|
|
| MD5 |
769780c0eea85a55e147bb8d5bd54674
|
|
| BLAKE2b-256 |
dca13dc13d0cfe995c565ecdeb4f19d008c3e80b441e9b0204c0c1bd7bd71b65
|
File details
Details for the file netra_profiler-0.5.1-py3-none-any.whl.
File metadata
- Download URL: netra_profiler-0.5.1-py3-none-any.whl
- Upload date:
- Size: 57.7 kB
- Tags: Python 3
- Uploaded using Trusted Publishing? No
- Uploaded via: uv/0.9.3
File hashes
| Algorithm | Hash digest | |
|---|---|---|
| SHA256 |
795a9ee0984e9d28244ad5bf3d76f30378fa81c5185d3db905b7387c338a55bc
|
|
| MD5 |
c80164cabddd912f699751f998f7c4b5
|
|
| BLAKE2b-256 |
167de094eeccd24b057d784dda4703e4fdad64b37c7c5fe7c63fe842a5f2e9c2
|






