The Python Toolbox for Neurophysiological Signal Processing.

Project description


The Python Toolbox for Neurophysiological Signal Processing
NeuroKit2 is a user-friendly package providing easy access to advanced biosignal processing routines. Researchers and clinicians without extensive knowledge of programming or biomedical signal processing can analyze physiological data with only two lines of code.
Quick Example
import neurokit2 as nk

# Download example data
data = nk.data("bio_eventrelated_100hz")

# Preprocess the data (filter, find peaks, etc.)
processed_data, info = nk.bio_process(ecg=data["ECG"], rsp=data["RSP"], eda=data["EDA"], sampling_rate=100)

# Compute relevant features
results = nk.bio_analyze(processed_data, sampling_rate=100)
And boom 💥 your analysis is done 😎
Download
You can download NeuroKit2 from PyPI
pip install neurokit2or conda-forge
conda install -c conda-forge neurokit2If you’re not sure what to do, read our installation guide.
Contributing


NeuroKit2 is the most welcoming project with a large community of contributors with all levels of programming expertise. But the package is still far from being perfect! Thus, if you have some ideas for improvement, new features, or just want to learn Python and do something useful at the same time, do not hesitate and check out the following guide:
Also, if you have developed new signal processing methods or algorithms and you want to increase their usage, popularity, and citations, get in touch with us to eventually add them to NeuroKit. A great opportunity for the users as well as the original developers!
You have spotted a mistake? An error in a formula or code? OR there is just a step that seems strange and you don’t understand? Please let us know! We are human beings, and we’ll appreciate any inquiry.
Documentation


Click on the links above and check out our tutorials:
General
Examples
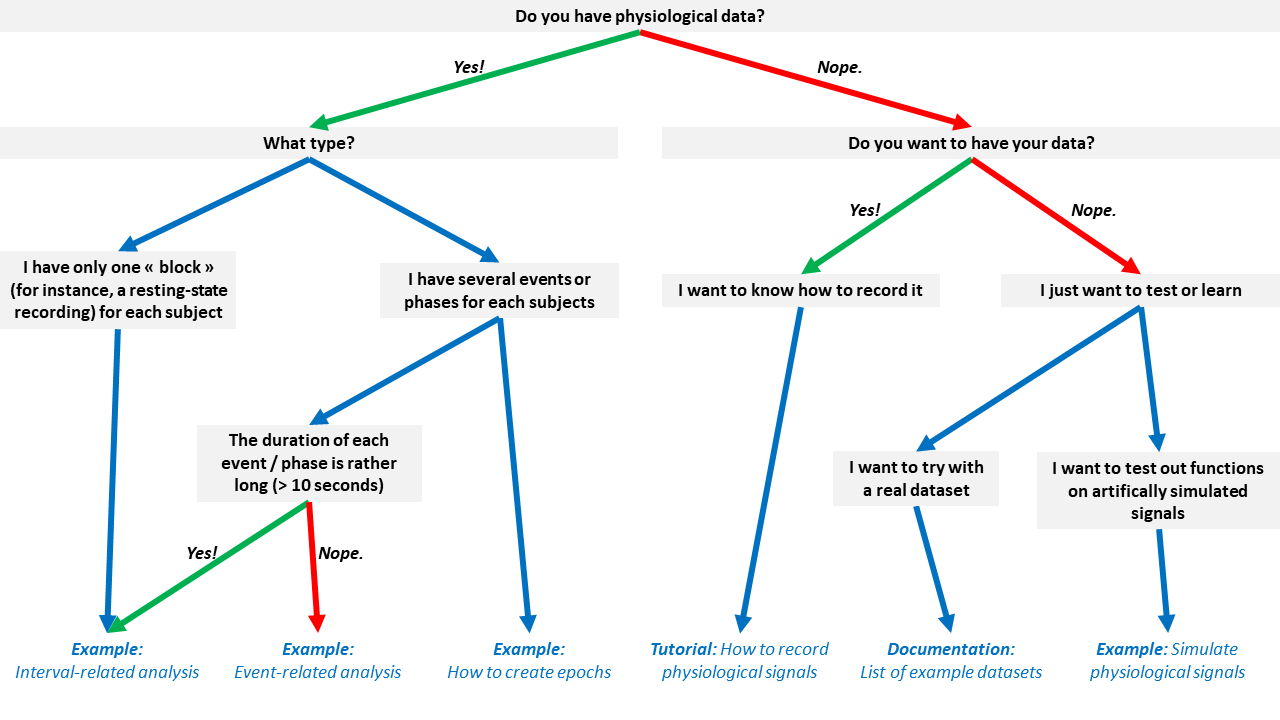
Don’t know which tutorial is suited for your case? Follow this flowchart:
Citation


The NeuroKit2 paper can be found here 🎉 Additionally, you can get the reference directly from Python by running:
nk.cite()You can cite NeuroKit2 as follows:
- Makowski, D., Pham, T., Lau, Z. J., Brammer, J. C., Lespinasse, F., Pham, H.,
Schölzel, C., & Chen, S. A. (2021). NeuroKit2: A Python toolbox for neurophysiological signal processing.
Behavior Research Methods, 53(4), 1689–1696. https://doi.org/10.3758/s13428-020-01516-y
Full bibtex reference:
@article{Makowski2021neurokit,
author = {Dominique Makowski and Tam Pham and Zen J. Lau and Jan C. Brammer and Fran{\c{c}}ois Lespinasse and Hung Pham and Christopher Schölzel and S. H. Annabel Chen},
title = {{NeuroKit}2: A Python toolbox for neurophysiological signal processing},
journal = {Behavior Research Methods},
volume = {53},
number = {4},
pages = {1689--1696},
publisher = {Springer Science and Business Media {LLC}},
doi = {10.3758/s13428-020-01516-y},
url = {https://doi.org/10.3758%2Fs13428-020-01516-y},
year = 2021,
month = {feb}
}Let us know if you used NeuroKit2 in a publication! Open a new discussion (select the NK in publications category) and link the paper. The community would be happy to know about how you used it and learn about your research. We could also feature it once we have a section on the website for papers that used the software.
Physiological Data Preprocessing
Simulate physiological signals
You can easily simulate artificial ECG (also 12-Lead multichannel ECGs), PPG, RSP, EDA, and EMG signals to test your scripts and algorithms.
import numpy as np
import pandas as pd
import neurokit2 as nk

# Generate synthetic signals
ecg = nk.ecg_simulate(duration=10, heart_rate=70)
ppg = nk.ppg_simulate(duration=10, heart_rate=70)
rsp = nk.rsp_simulate(duration=10, respiratory_rate=15)
eda = nk.eda_simulate(duration=10, scr_number=3)
emg = nk.emg_simulate(duration=10, burst_number=2)

# Visualise biosignals
data = pd.DataFrame({"ECG": ecg,
                     "PPG": ppg,
                     "RSP": rsp,
                     "EDA": eda,
                     "EMG": emg})
nk.signal_plot(data, subplots=True)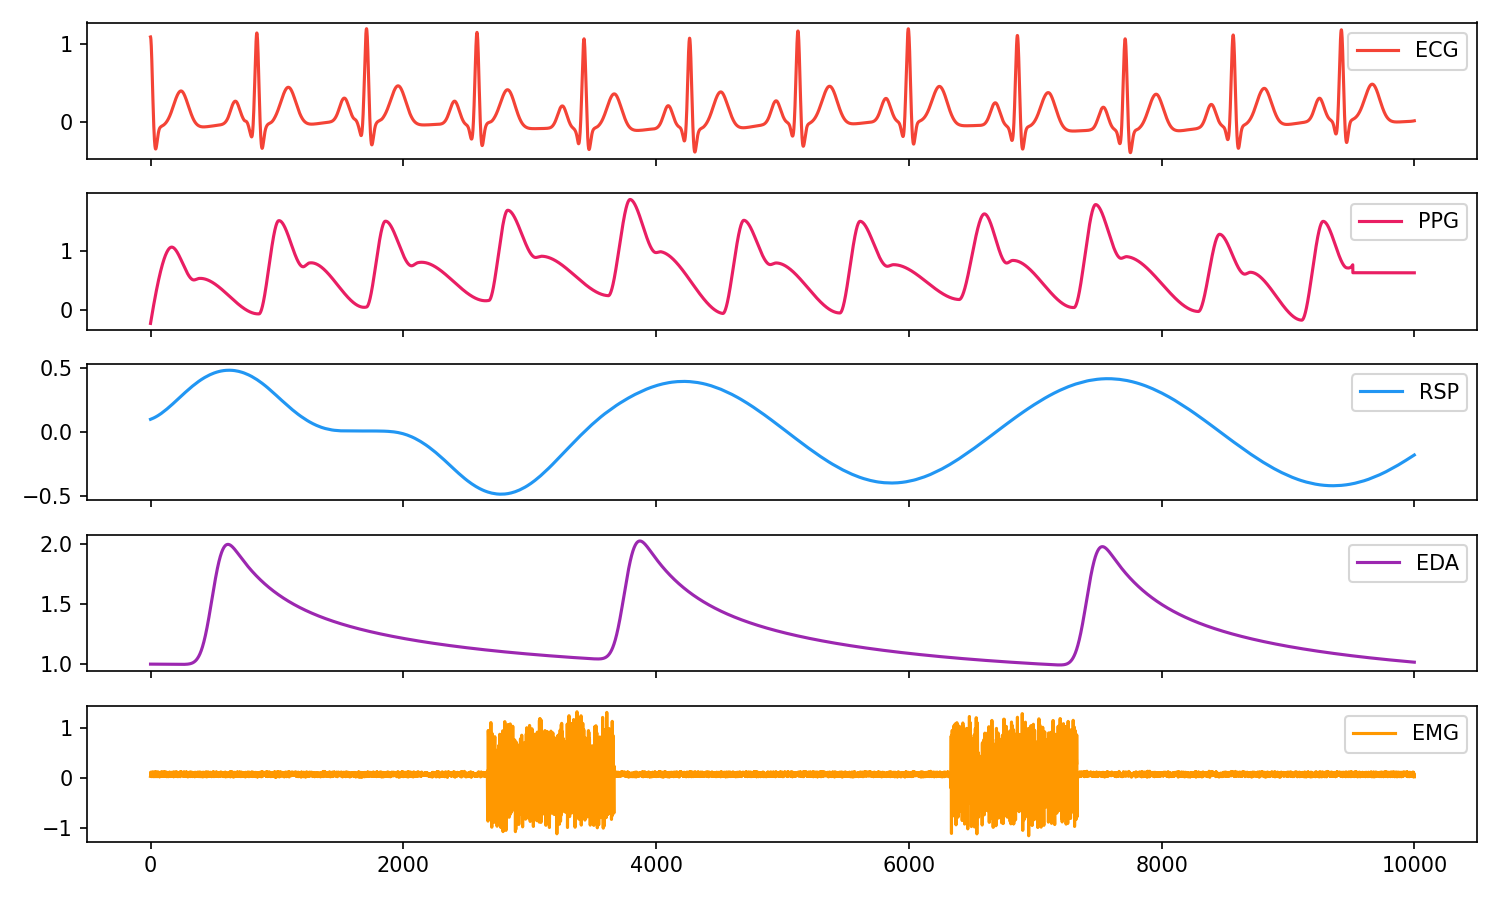
Electrodermal Activity (EDA/GSR)
# Generate 10 seconds of EDA signal (recorded at 250 samples / second) with 2 SCR peaks
eda = nk.eda_simulate(duration=10, sampling_rate=250, scr_number=2, drift=0.01)

# Process it
signals, info = nk.eda_process(eda, sampling_rate=250)

# Visualise the processing
nk.eda_plot(signals, info)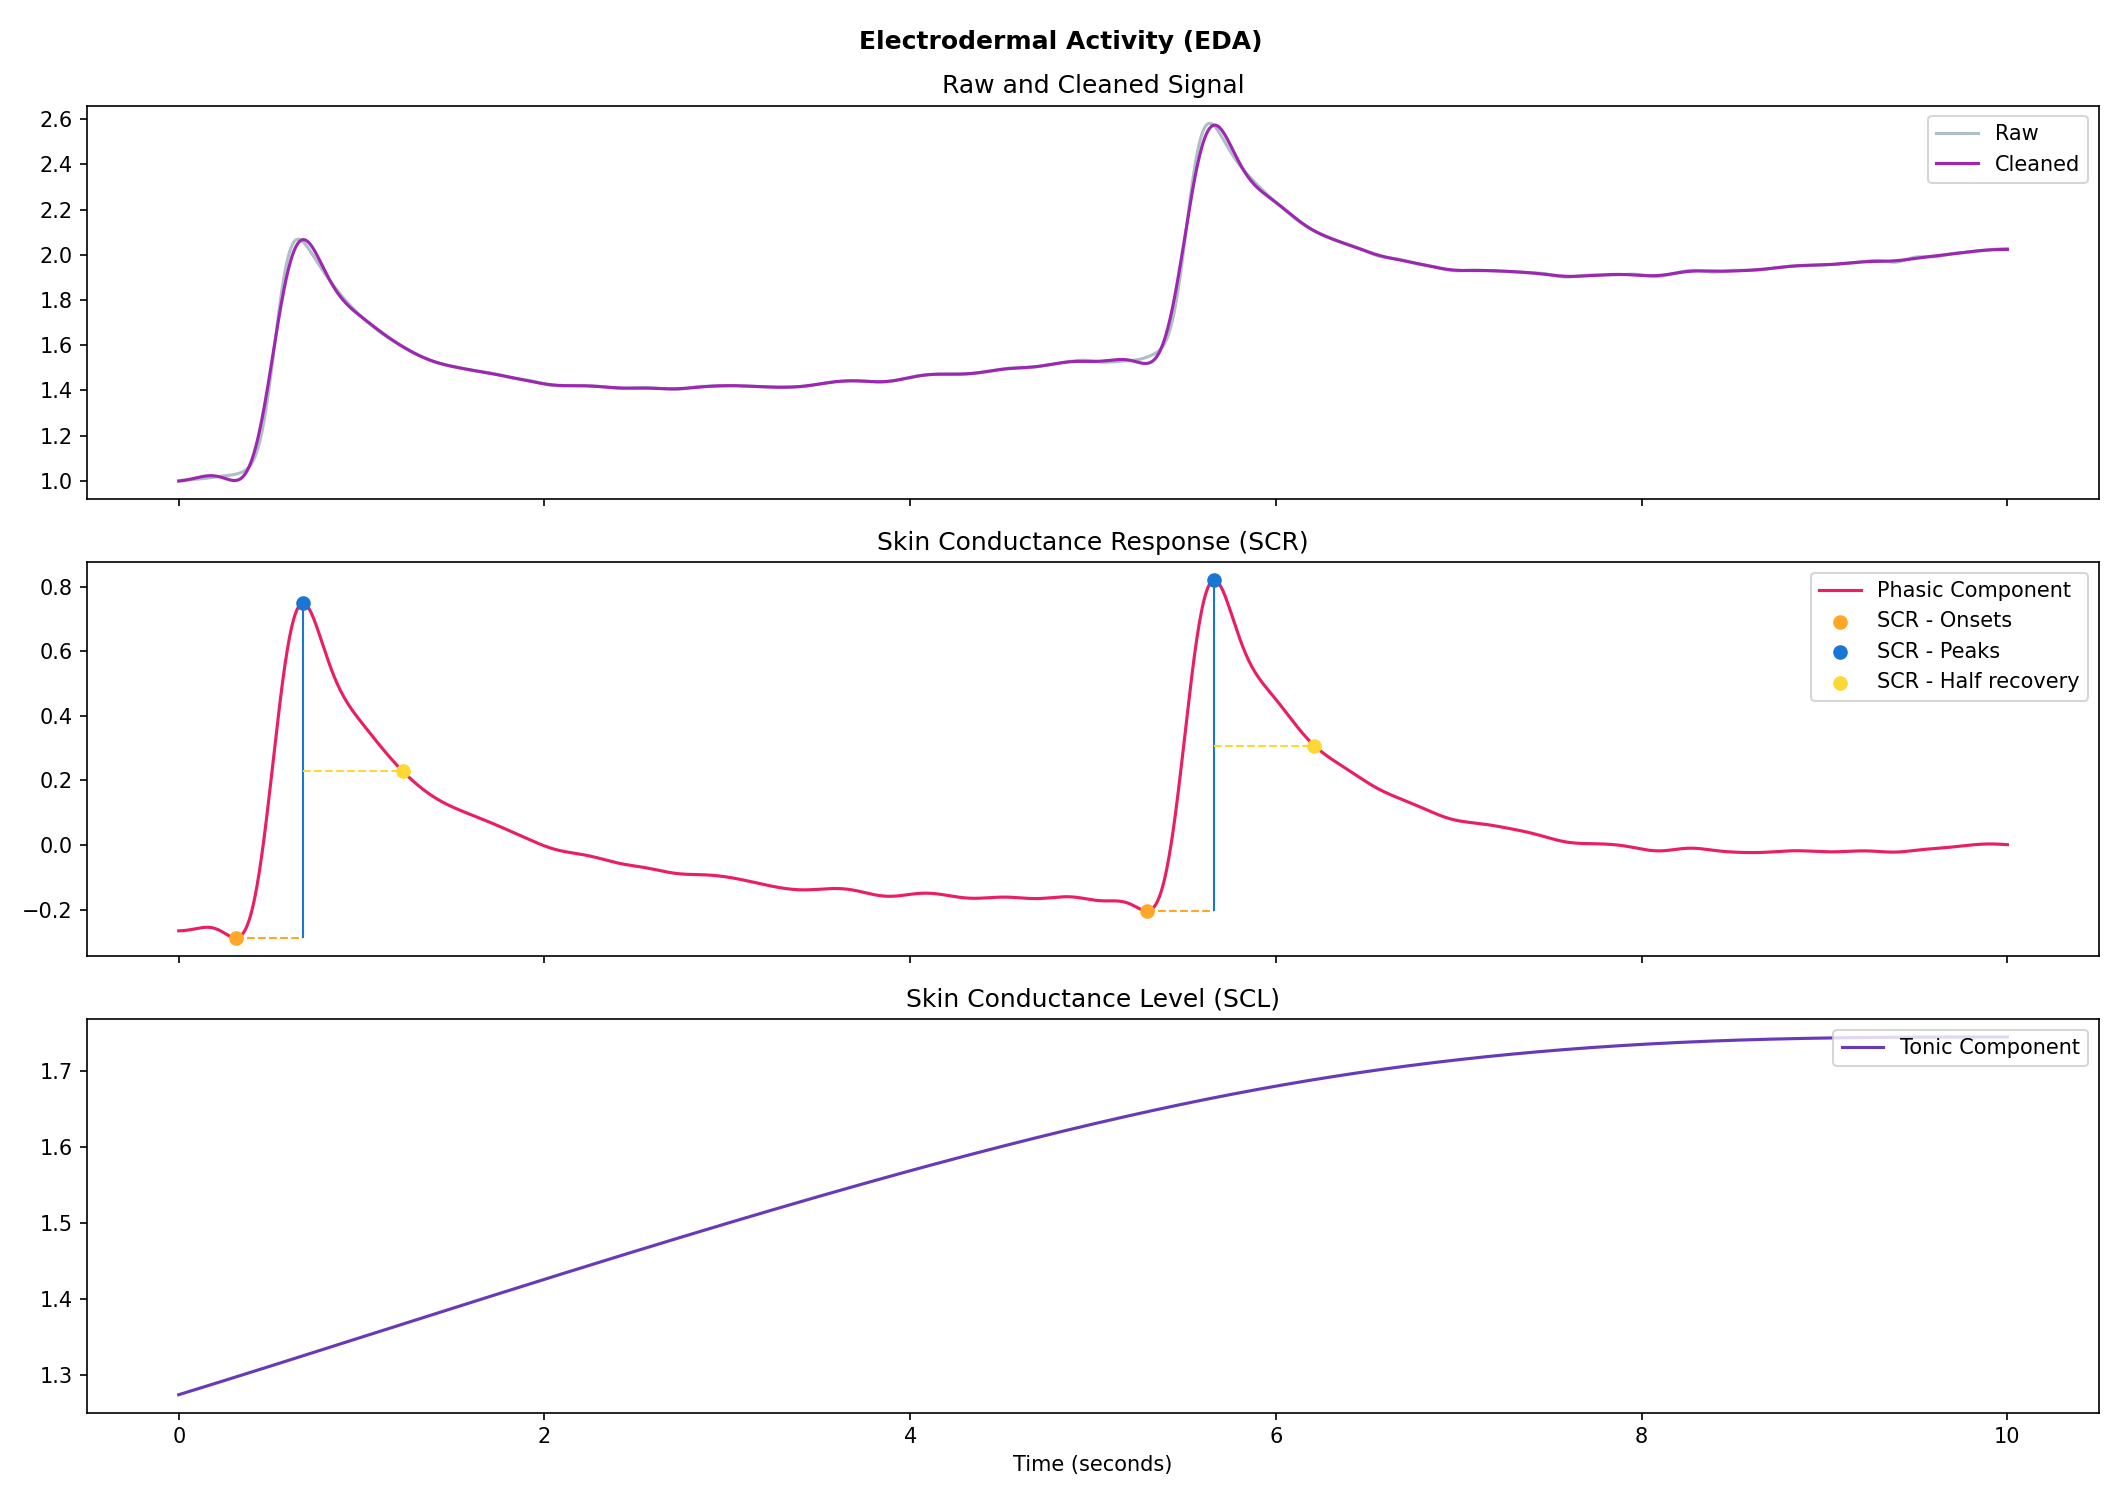
Cardiac activity (ECG)
# Generate 15 seconds of ECG signal (recorded at 250 samples/second)
ecg = nk.ecg_simulate(duration=15, sampling_rate=250, heart_rate=70)

# Process it
signals, info = nk.ecg_process(ecg, sampling_rate=250)

# Visualise the processing
nk.ecg_plot(signals, info)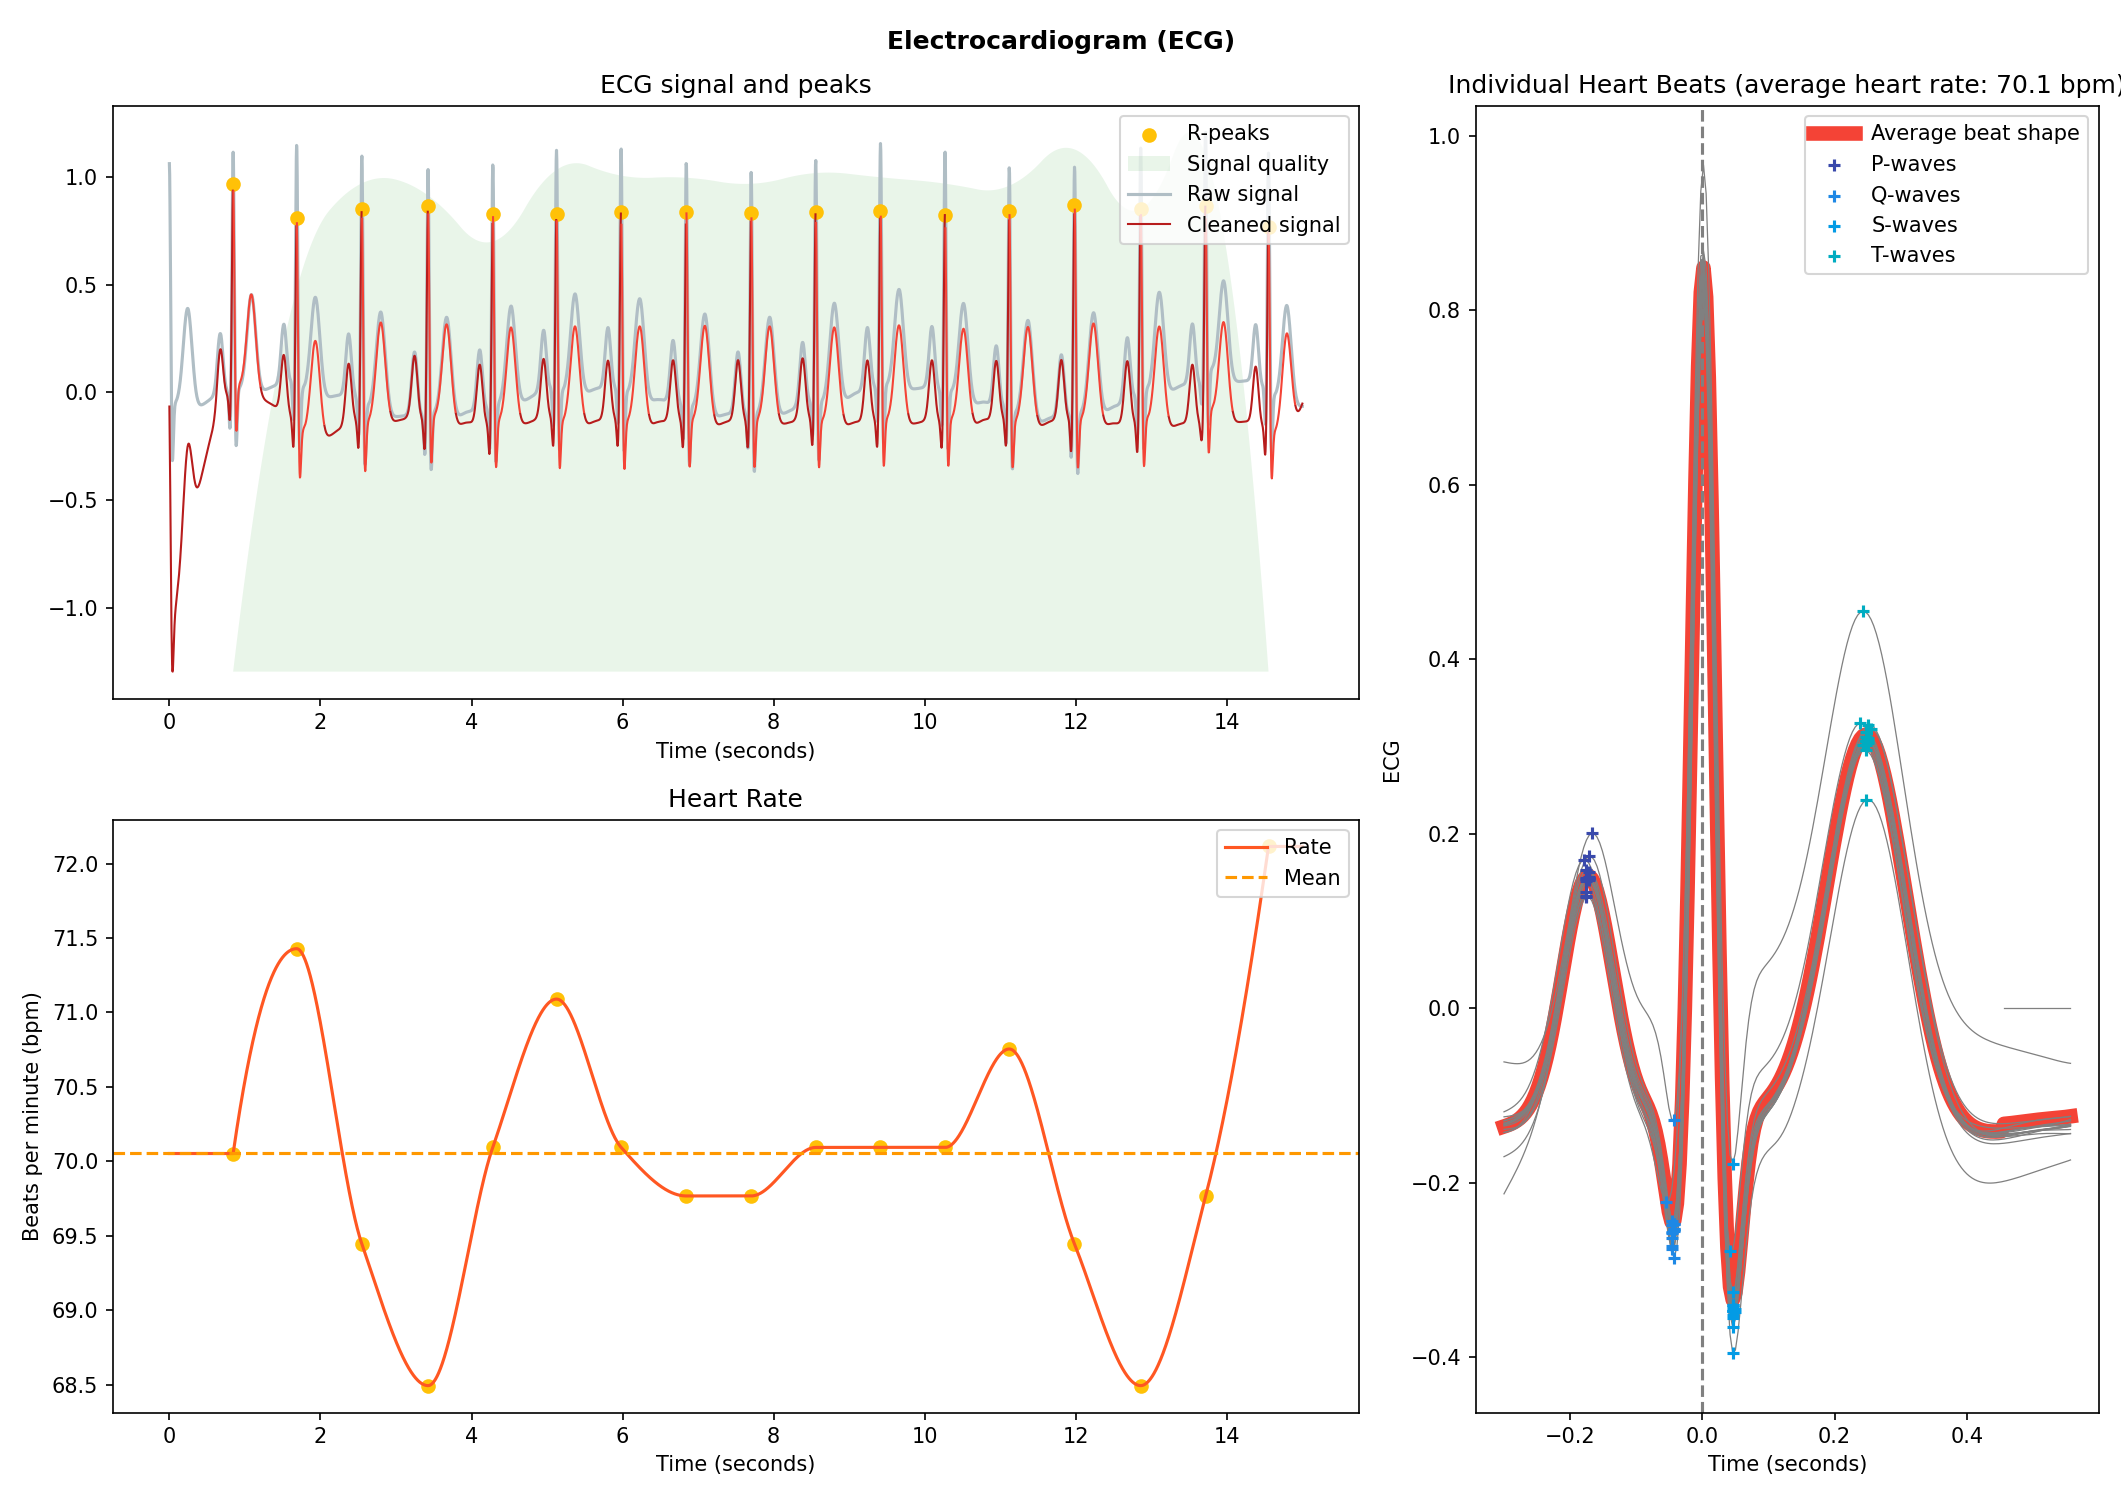
Respiration (RSP)
# Generate one minute of respiratory (RSP) signal (recorded at 250 samples / second)
rsp = nk.rsp_simulate(duration=60, sampling_rate=250, respiratory_rate=15)

# Process it
signals, info = nk.rsp_process(rsp, sampling_rate=250)

# Visualise the processing
nk.rsp_plot(signals, info)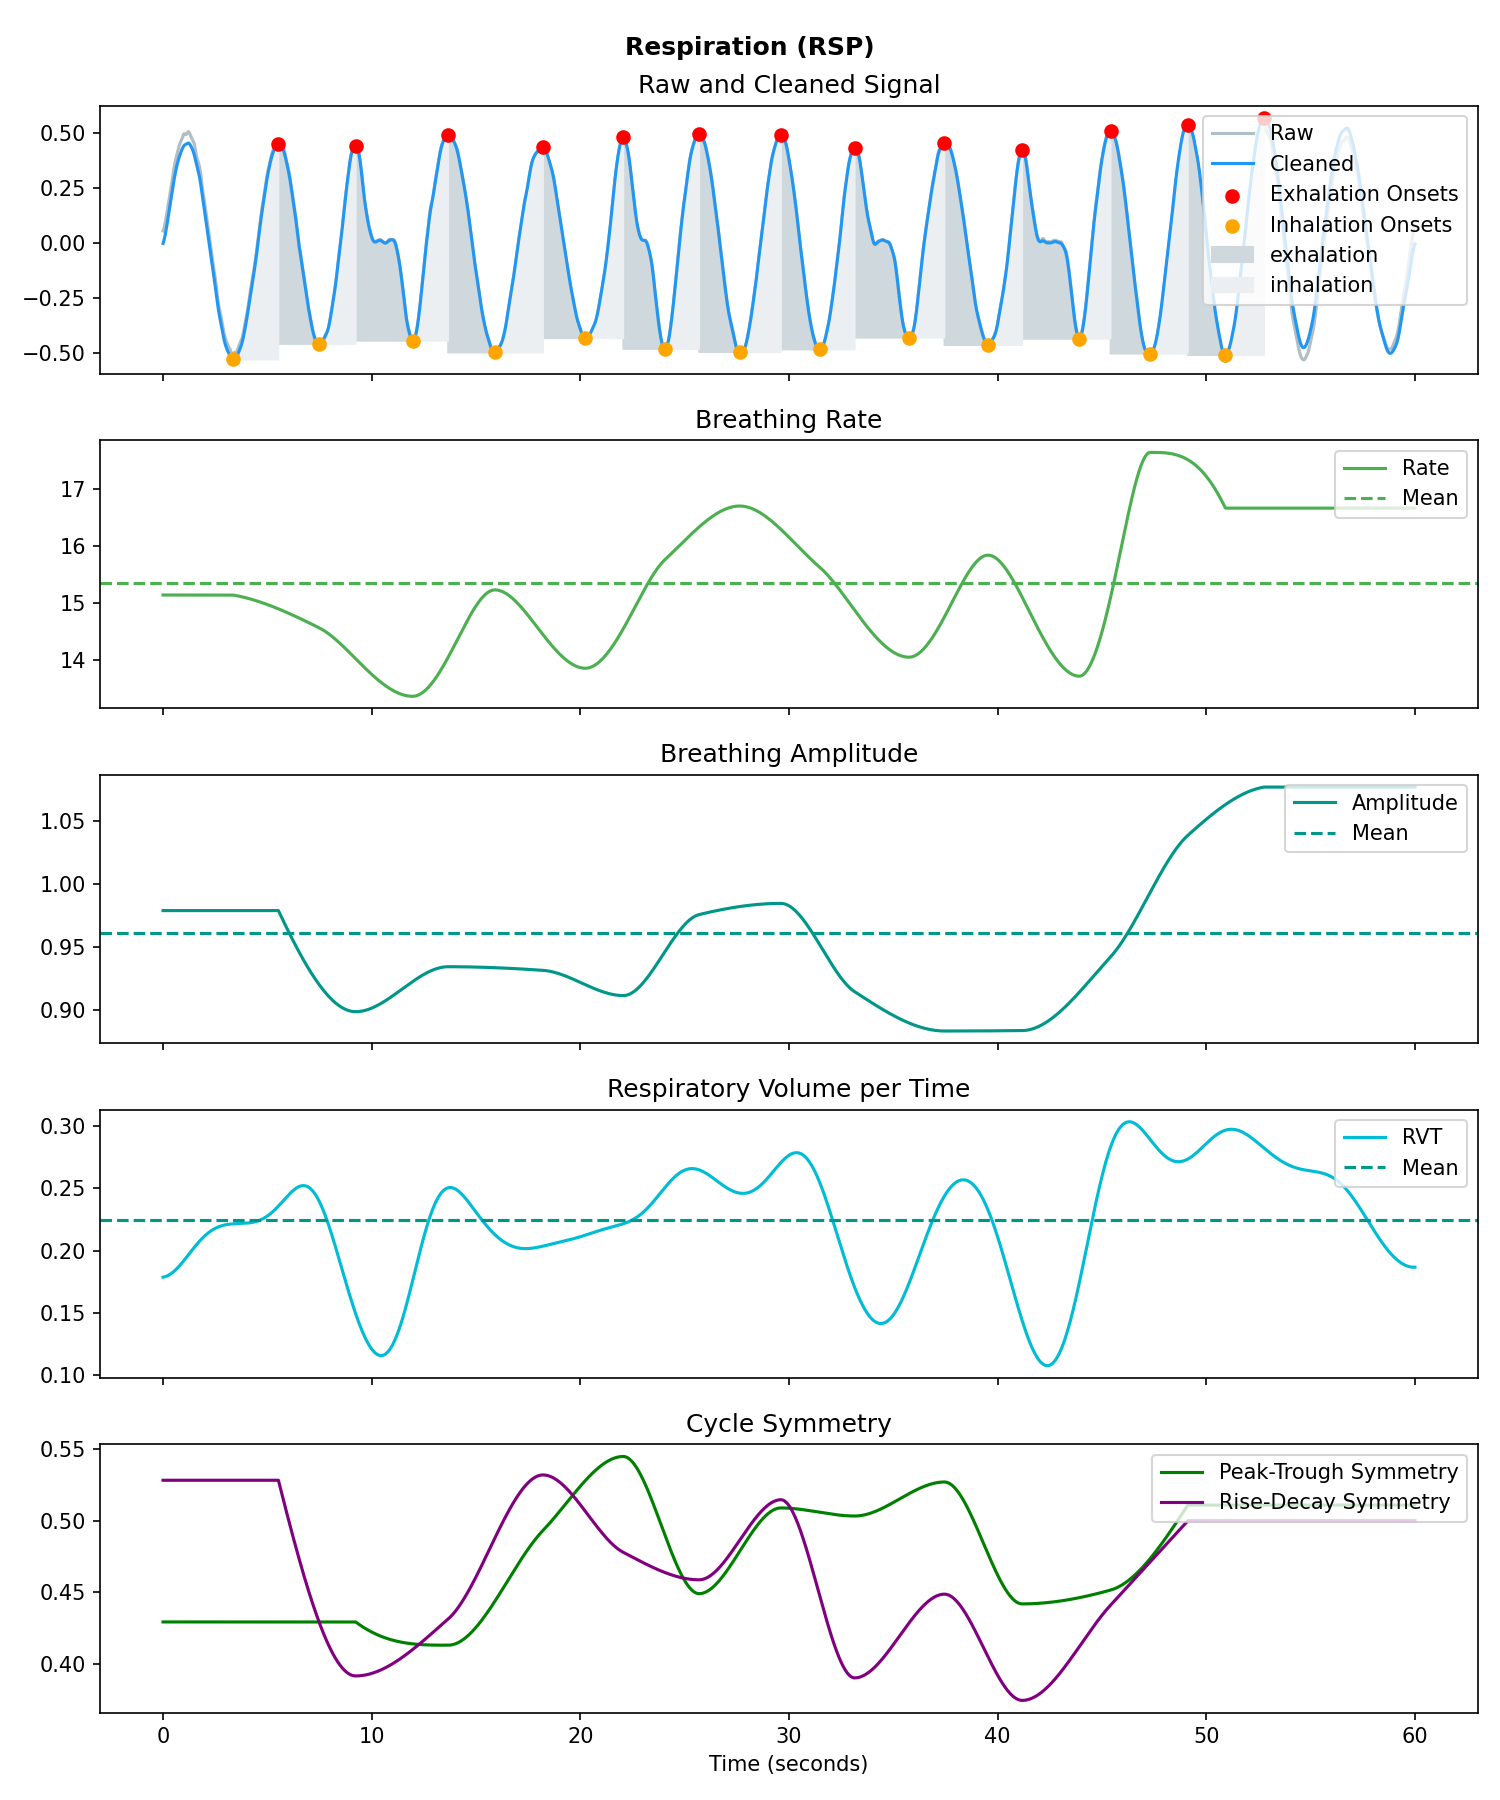
Photoplethysmography (PPG/BVP)
# Generate 15 seconds of PPG signal (recorded at 250 samples/second)
ppg = nk.ppg_simulate(duration=15, sampling_rate=250, heart_rate=70)

# Process it
signals, info = nk.ppg_process(ppg, sampling_rate=250)

# Visualize the processing
nk.ppg_plot(signals, info)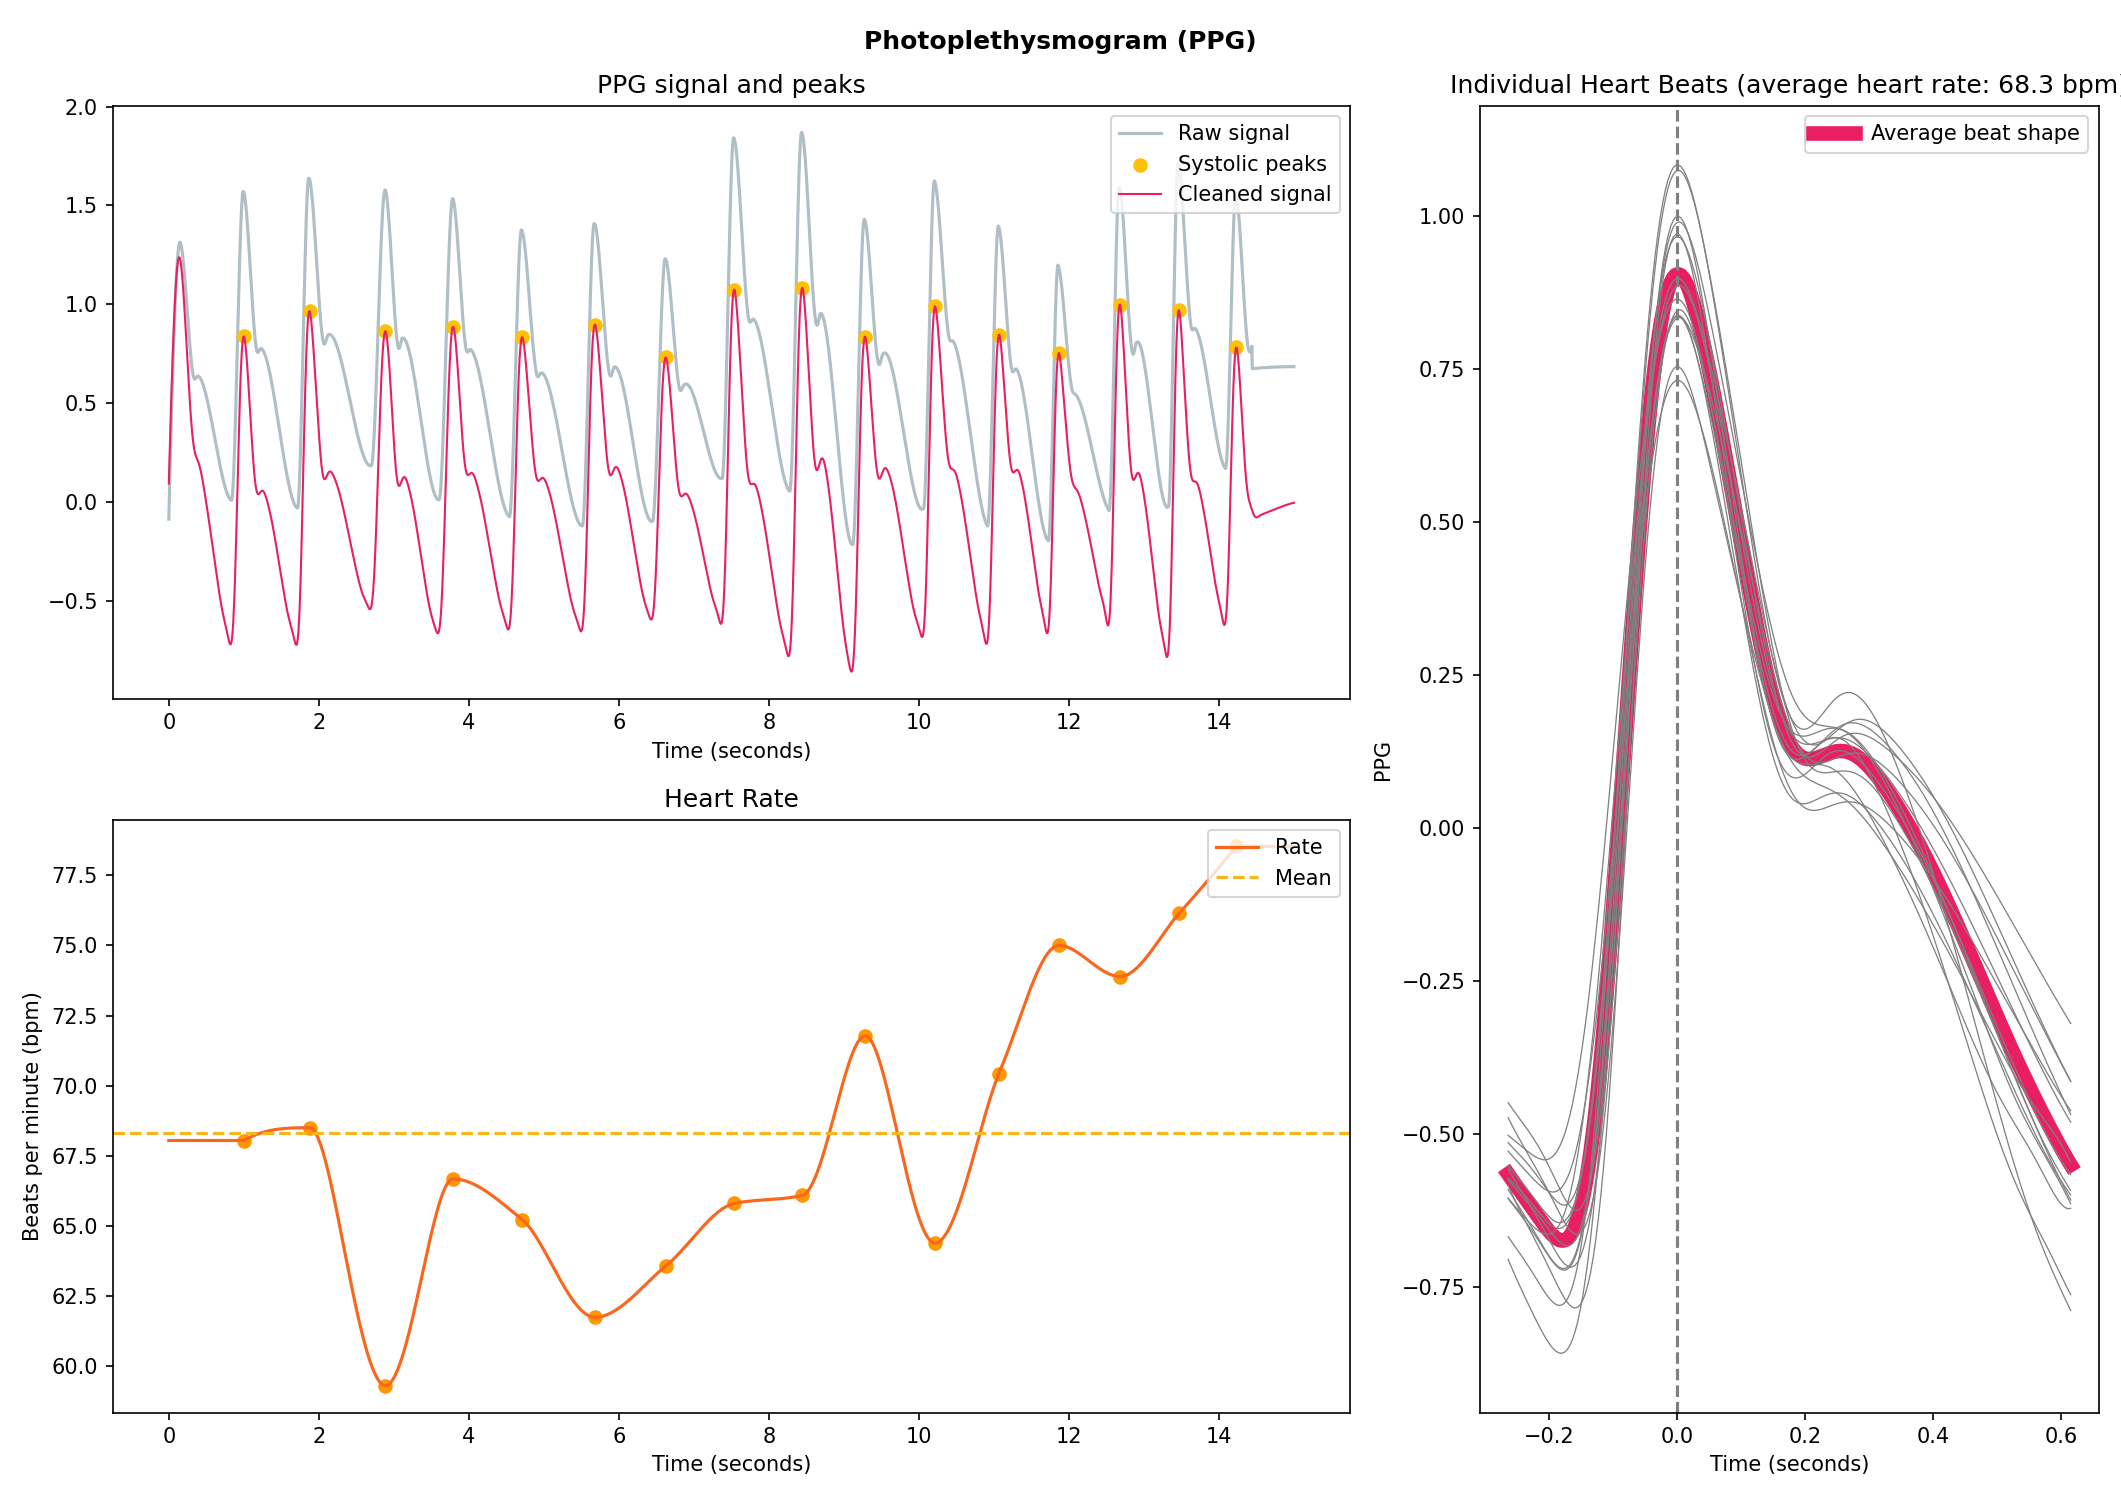
Electromyography (EMG)
# Generate 10 seconds of EMG signal (recorded at 250 samples/second)
emg = nk.emg_simulate(duration=10, sampling_rate=250, burst_number=3)

# Process it
signals, info = nk.emg_process(emg, sampling_rate=250)

# Visualise the processing
nk.emg_plot(signals, info)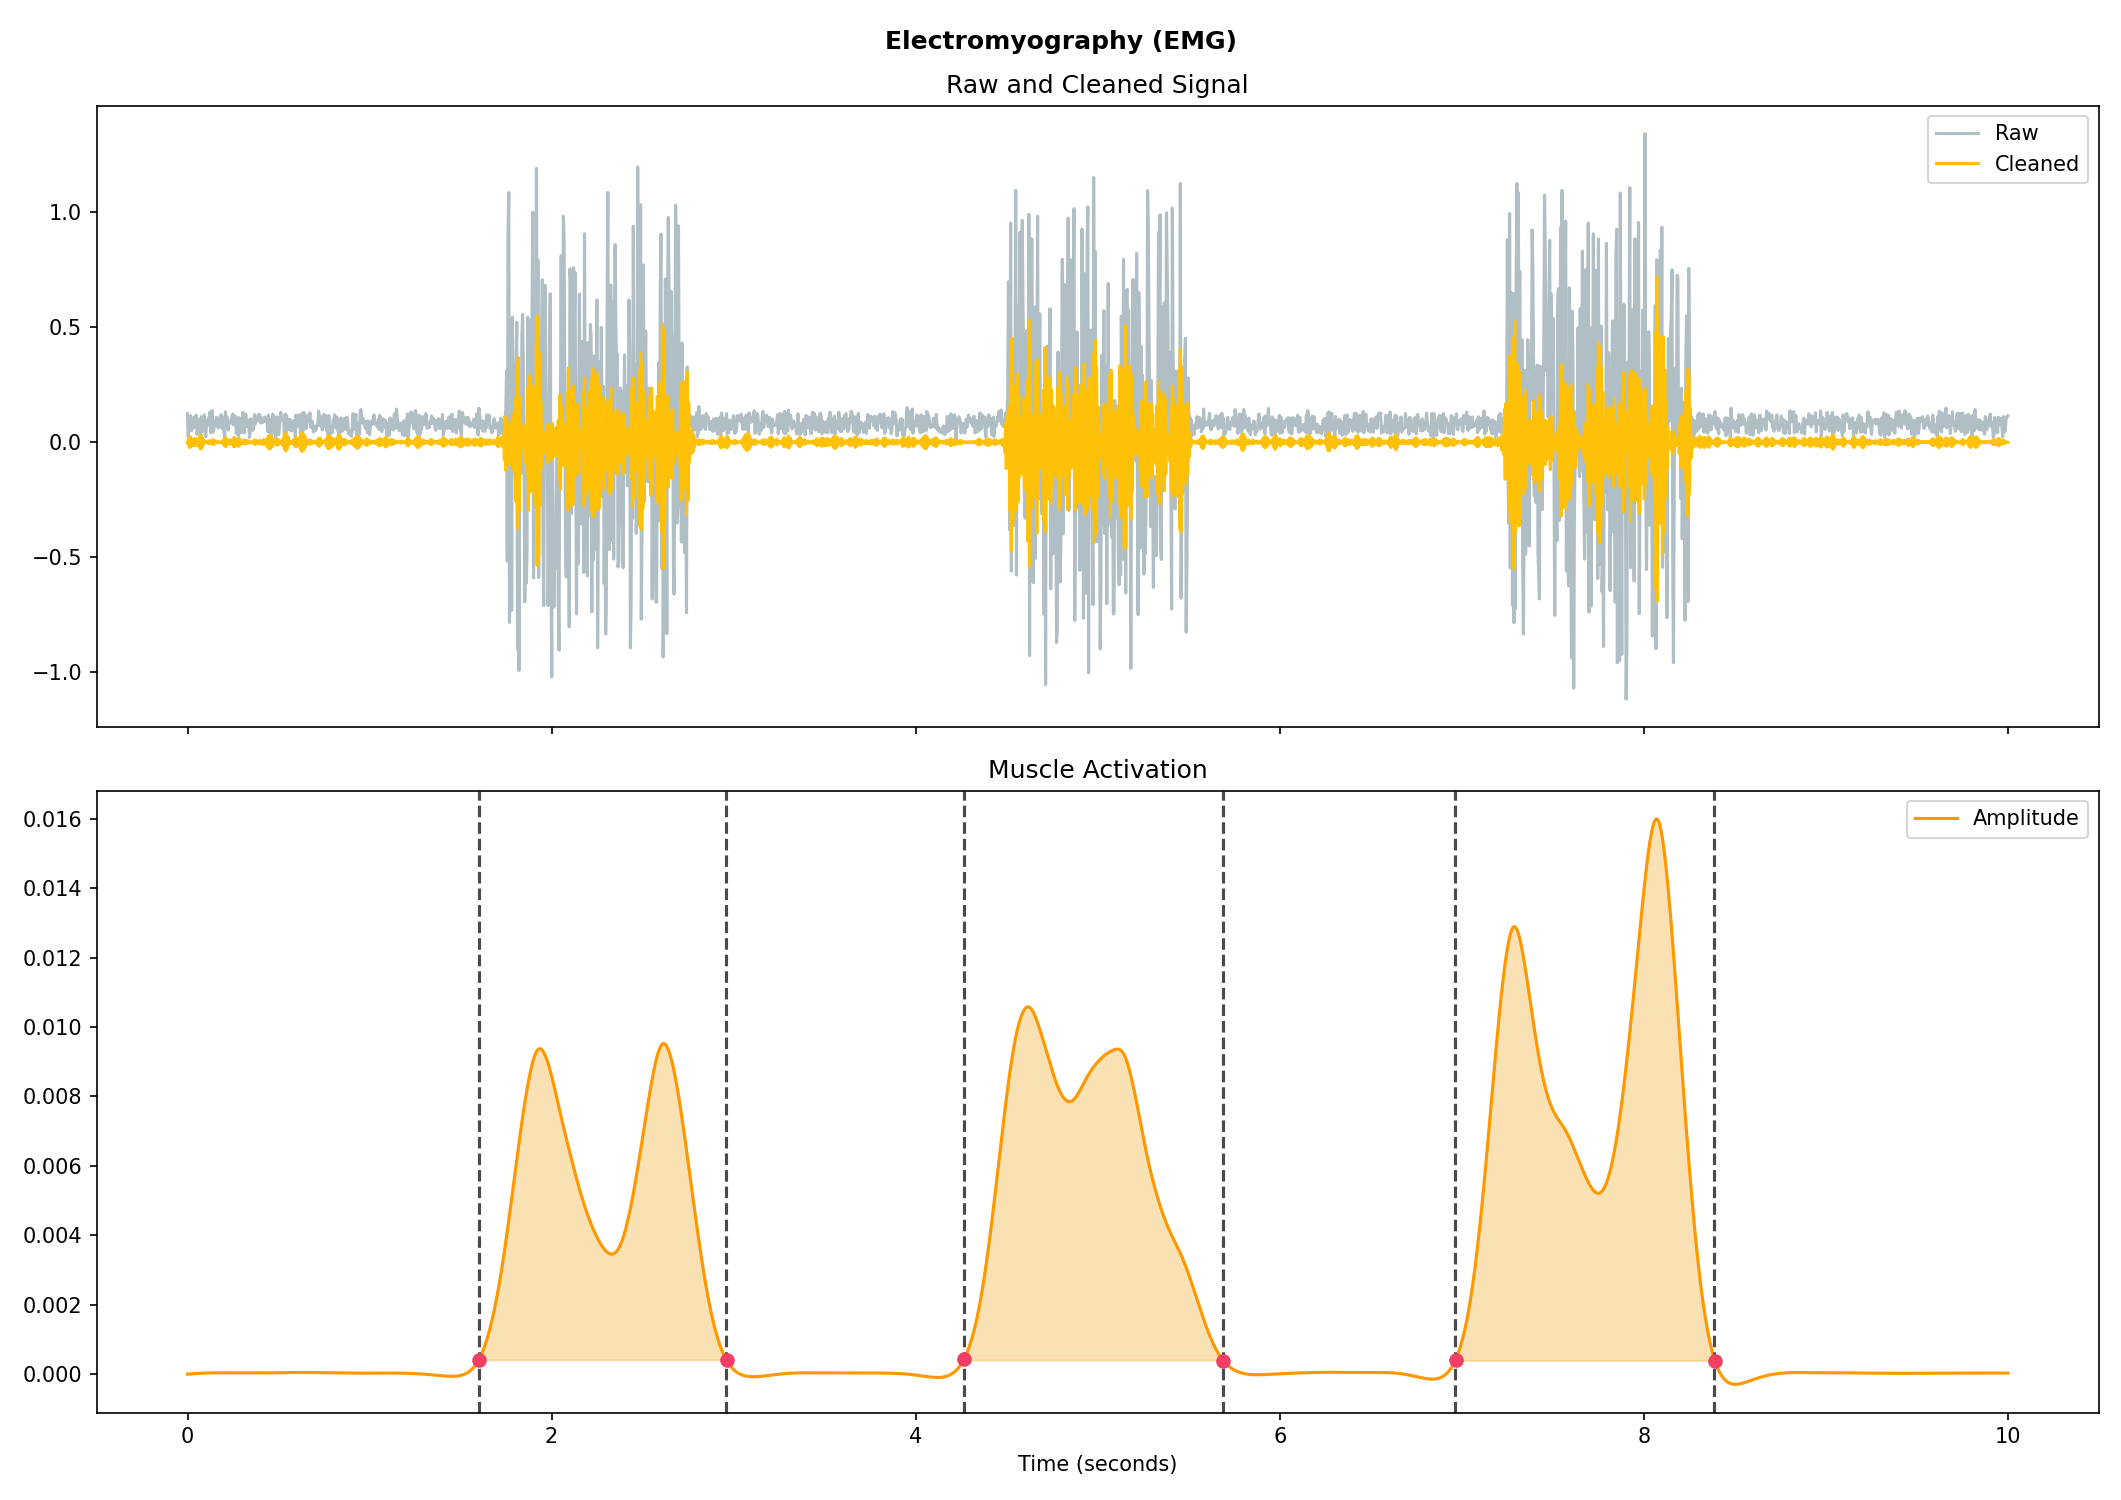
Electrooculography (EOG)
# Import EOG data
eog_signal = nk.data("eog_100hz")

# Process it
signals, info = nk.eog_process(eog_signal, sampling_rate=100)

# Plot
nk.eog_plot(signals, info)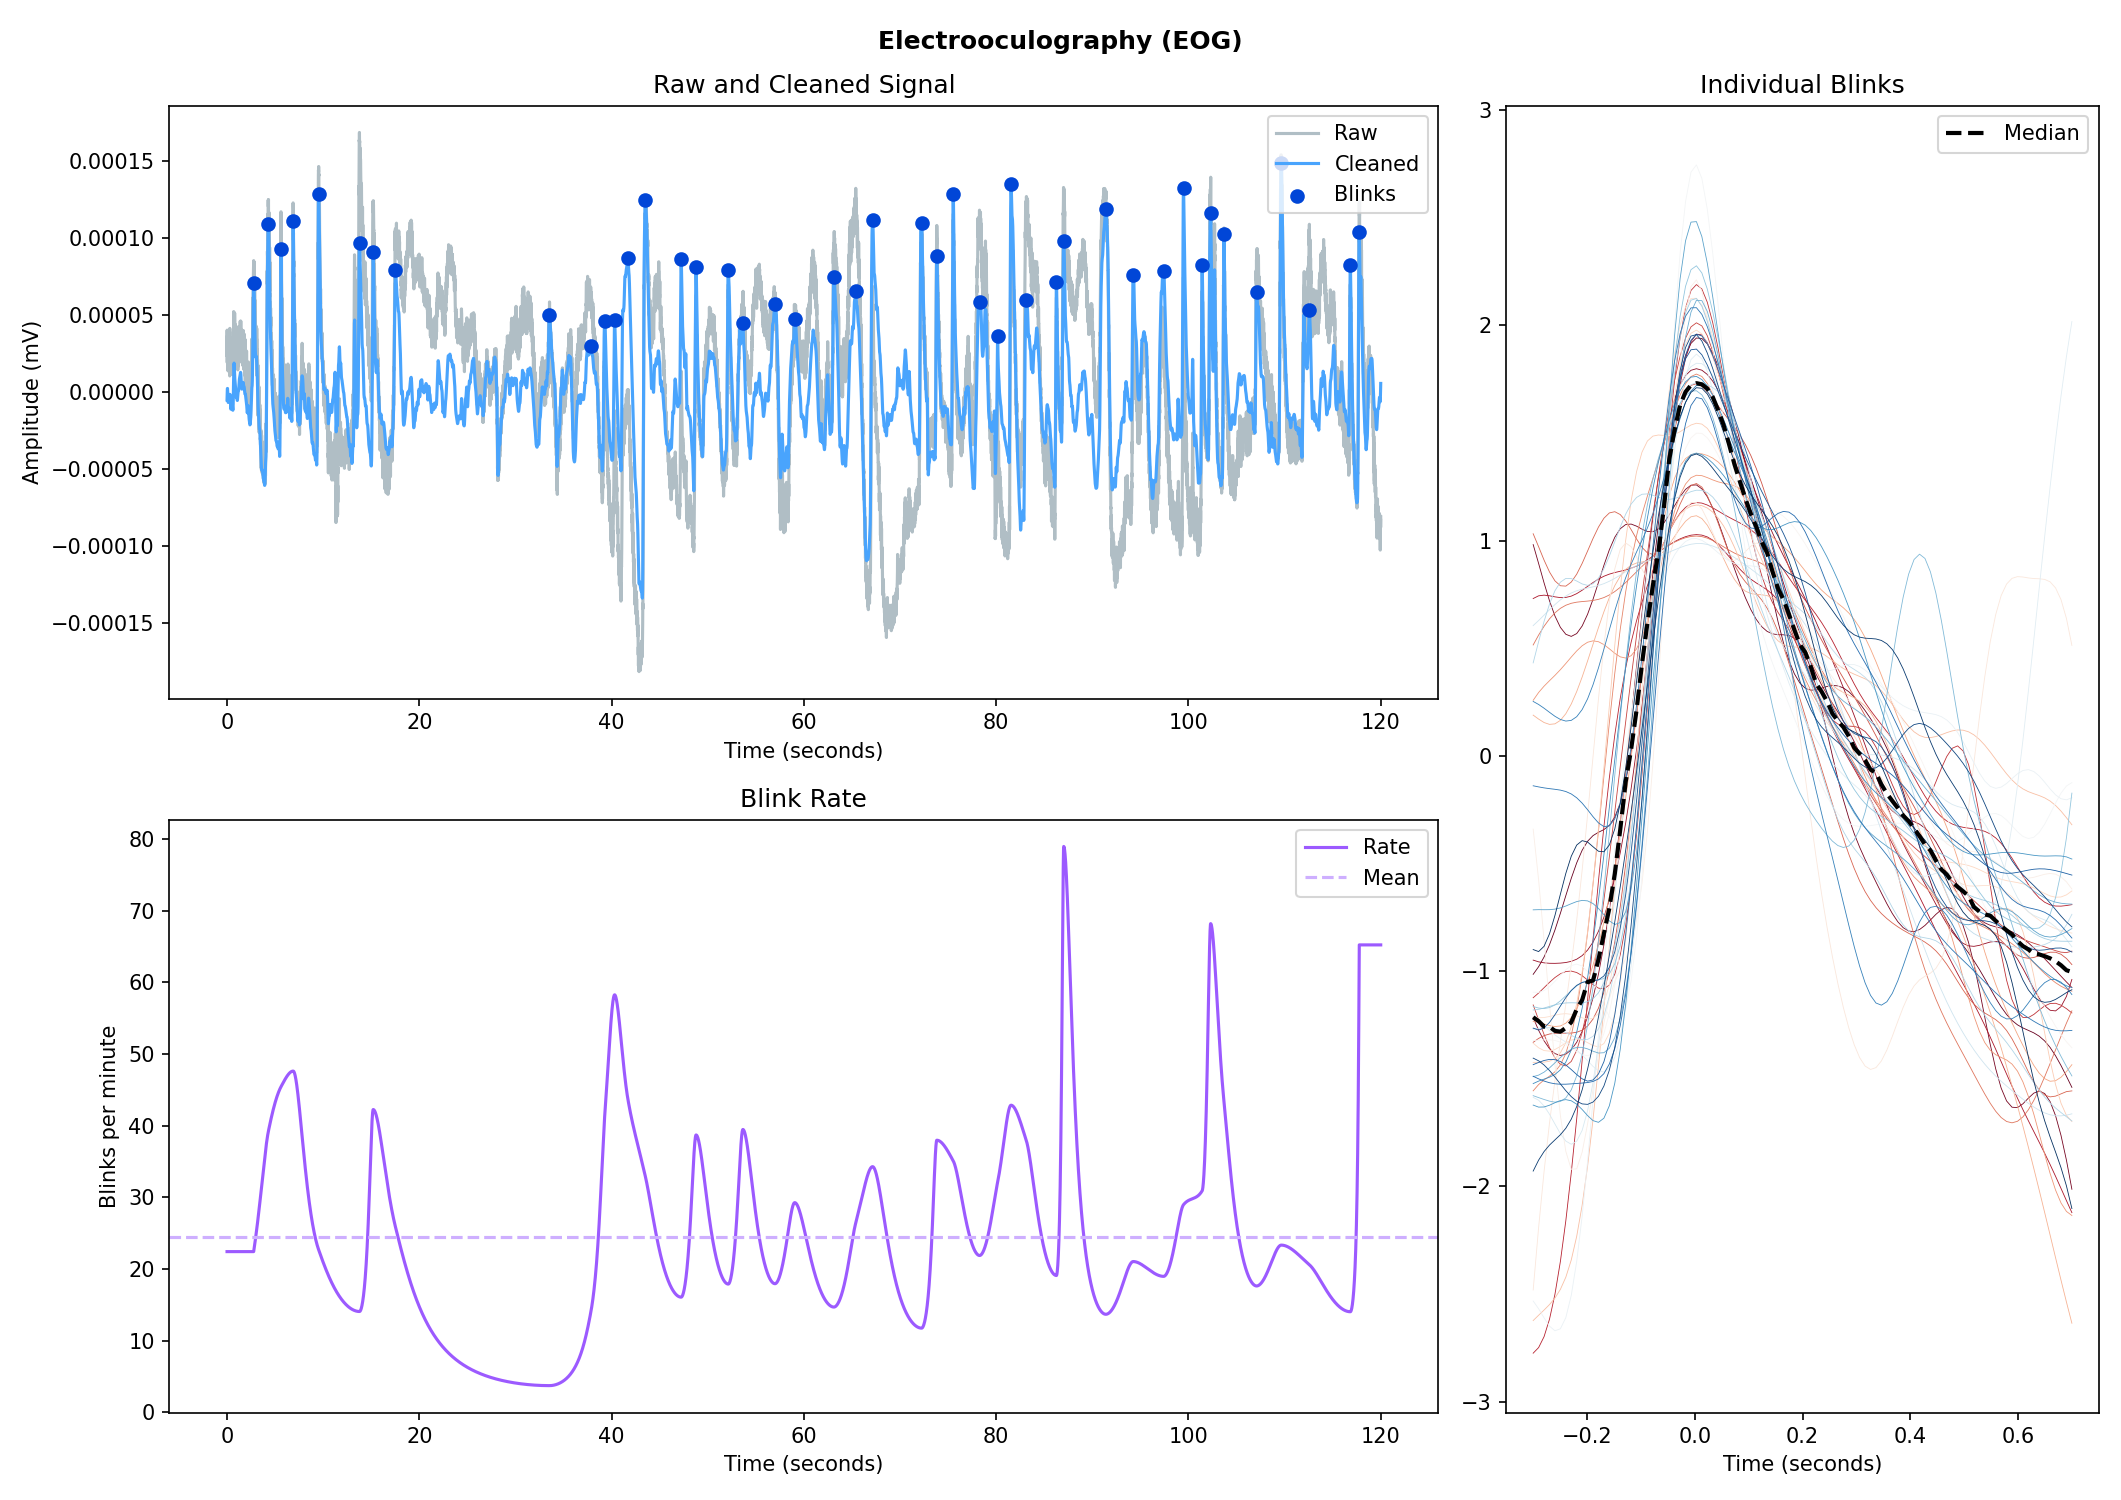
Electrogastrography (EGG)
Consider helping us develop it!
Physiological Data Analysis
The analysis of physiological data usually comes in two types, event-related or interval-related.
Heart Rate Variability (HRV)

Check-out our Heart Rate Variability in Psychology: A Review of HRV Indices and an Analysis Tutorial paper for:
a comprehensive review of the most up-to-date HRV indices
a discussion of their significance in psychological research and practices
a step-by-step guide for HRV analysis using NeuroKit2
You can cite the paper as follows:

- Pham, T., Lau, Z. J., Chen, S. H. A., & Makowski, D. (2021).
Heart Rate Variability in Psychology: A Review of HRV Indices and an Analysis Tutorial.
Sensors, 21(12), 3998. https://doi:10.3390/s21123998
Compute HRV indices using Python
Time domain: RMSSD, MeanNN, SDNN, SDSD, CVNN, etc.
Frequency domain: Spectral power density in various frequency bands (Ultra low/ULF, Very low/VLF, Low/LF, High/HF, Very high/VHF), Ratio of LF to HF power, Normalized LF (LFn) and HF (HFn), Log transformed HF (LnHF).
Nonlinear domain: Spread of RR intervals (SD1, SD2, ratio between SD2 to SD1), Cardiac Sympathetic Index (CSI), Cardial Vagal Index (CVI), Modified CSI, Sample Entropy (SampEn).
# Download data
data = nk.data("bio_resting_8min_100hz")

# Find peaks
peaks, info = nk.ecg_peaks(data["ECG"], sampling_rate=100)

# Compute HRV indices
nk.hrv(peaks, sampling_rate=100, show=True)
>>>    HRV_RMSSD  HRV_MeanNN   HRV_SDNN  ...   HRV_CVI  HRV_CSI_Modified  HRV_SampEn
>>> 0  69.697983  696.395349  62.135891  ...  4.829101        592.095372    1.259931
Miscellaneous
ECG Delineation
Delineate the QRS complex of an electrocardiac signal (ECG) including P-peaks, T-peaks, as well as their onsets and offsets.
# Download data
ecg_signal = nk.data(dataset="ecg_3000hz")

# Extract R-peaks locations
_, rpeaks = nk.ecg_peaks(ecg_signal, sampling_rate=3000)

# Delineate
signal, waves = nk.ecg_delineate(ecg_signal, rpeaks, sampling_rate=3000, method="dwt", show=True, show_type='all')
Signal Processing
Signal processing functionalities
Filtering: Using different methods.
Detrending: Remove the baseline drift or trend.
Distorting: Add noise and artifacts.
# Generate original signal
original = nk.signal_simulate(duration=6, frequency=1)

# Distort the signal (add noise, linear trend, artifacts, etc.)
distorted = nk.signal_distort(original,
                              noise_amplitude=0.1,
                              noise_frequency=[5, 10, 20],
                              powerline_amplitude=0.05,
                              artifacts_amplitude=0.3,
                              artifacts_number=3,
                              linear_drift=0.5)

# Clean (filter and detrend)
cleaned = nk.signal_detrend(distorted)
cleaned = nk.signal_filter(cleaned, lowcut=0.5, highcut=1.5)

# Compare the 3 signals
plot = nk.signal_plot([original, distorted, cleaned])
Complexity (Entropy, Fractal Dimensions, …)
Optimize complexity parameters (delay tau, dimension m, tolerance r)
# Generate signal
signal = nk.signal_simulate(frequency=[1, 3], noise=0.01, sampling_rate=200)

# Find optimal time delay, embedding dimension, and r
parameters = nk.complexity_optimize(signal, show=True)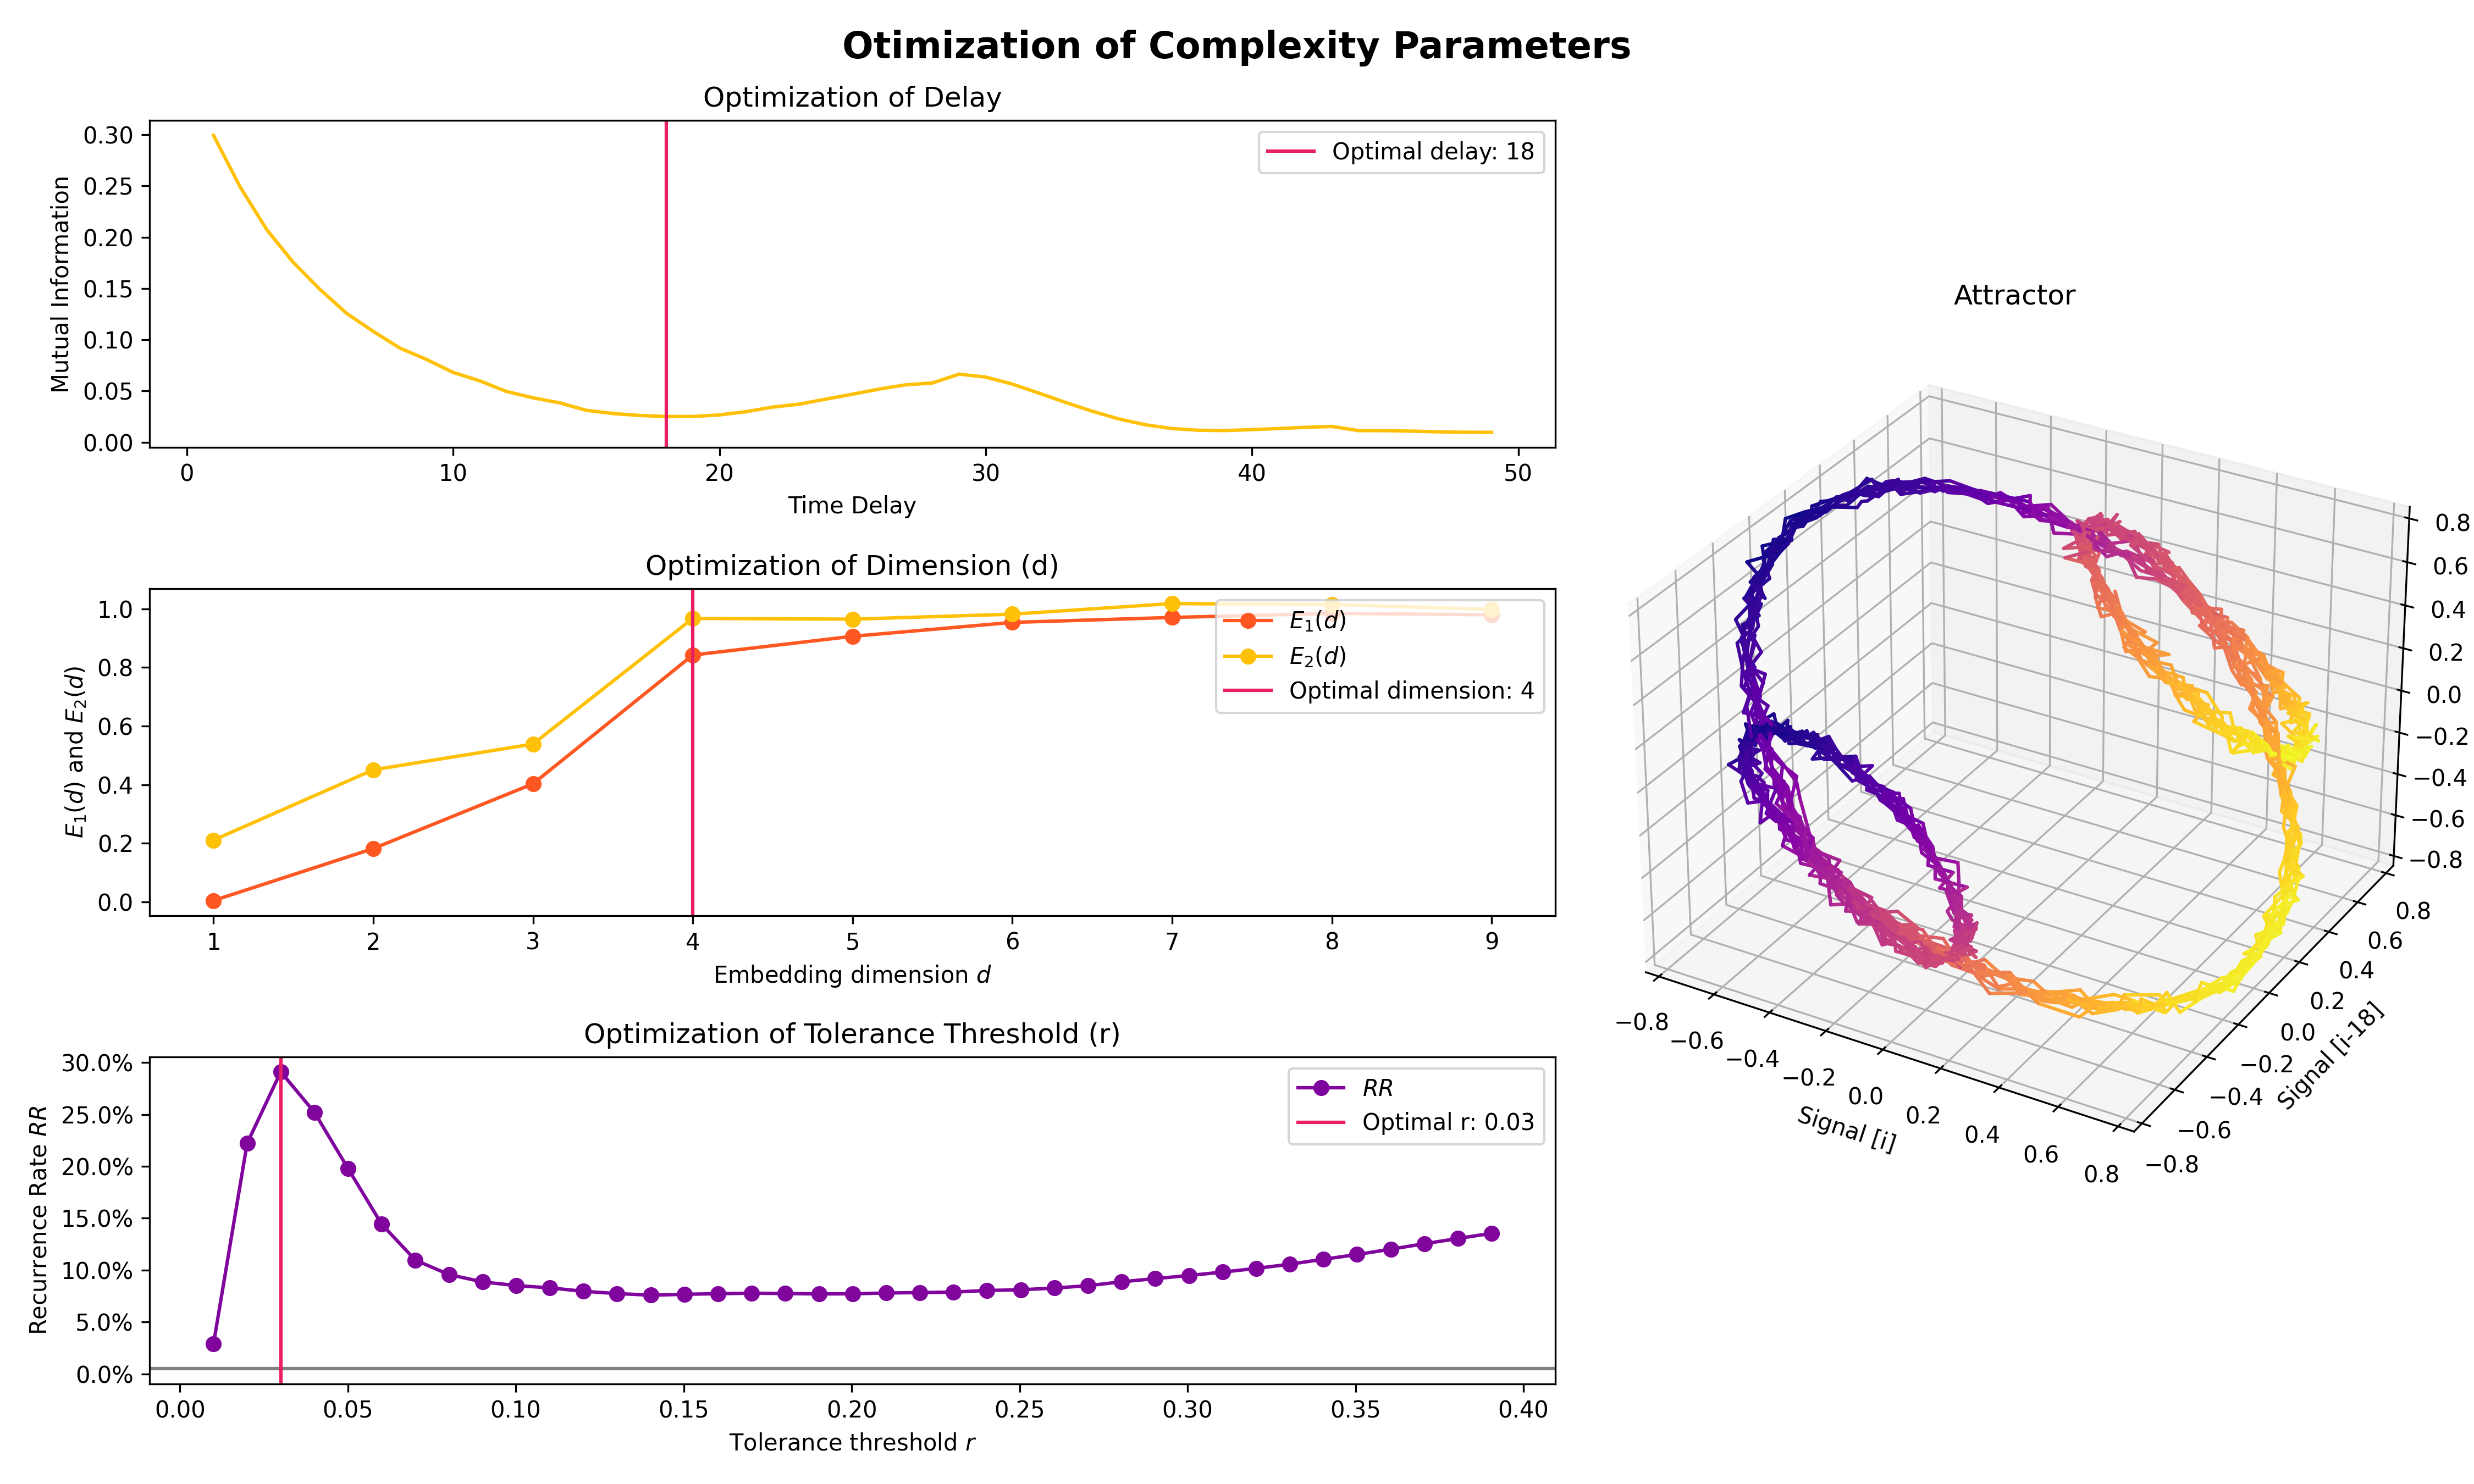
Compute complexity features
Entropy: Sample Entropy (SampEn), Approximate Entropy (ApEn), Fuzzy Entropy (FuzzEn), Multiscale Entropy (MSE), Shannon Entropy (ShEn)
Fractal dimensions: Correlation Dimension D2, …
Detrended Fluctuation Analysis
nk.entropy_sample(signal)
nk.entropy_approximate(signal)
Signal Decomposition
# Create complex signal
signal = nk.signal_simulate(duration=10, frequency=1)  # High freq
signal += 3 * nk.signal_simulate(duration=10, frequency=3)  # Higher freq
signal += 3 * np.linspace(0, 2, len(signal))  # Add baseline and linear trend
signal += 2 * nk.signal_simulate(duration=10, frequency=0.1, noise=0)  # Non-linear trend
signal += np.random.normal(0, 0.02, len(signal))  # Add noise

# Decompose signal using Empirical Mode Decomposition (EMD)
components = nk.signal_decompose(signal, method='emd')
nk.signal_plot(components)  # Visualize components

# Recompose merging correlated components
recomposed = nk.signal_recompose(components, threshold=0.99)
nk.signal_plot(recomposed)  # Visualize components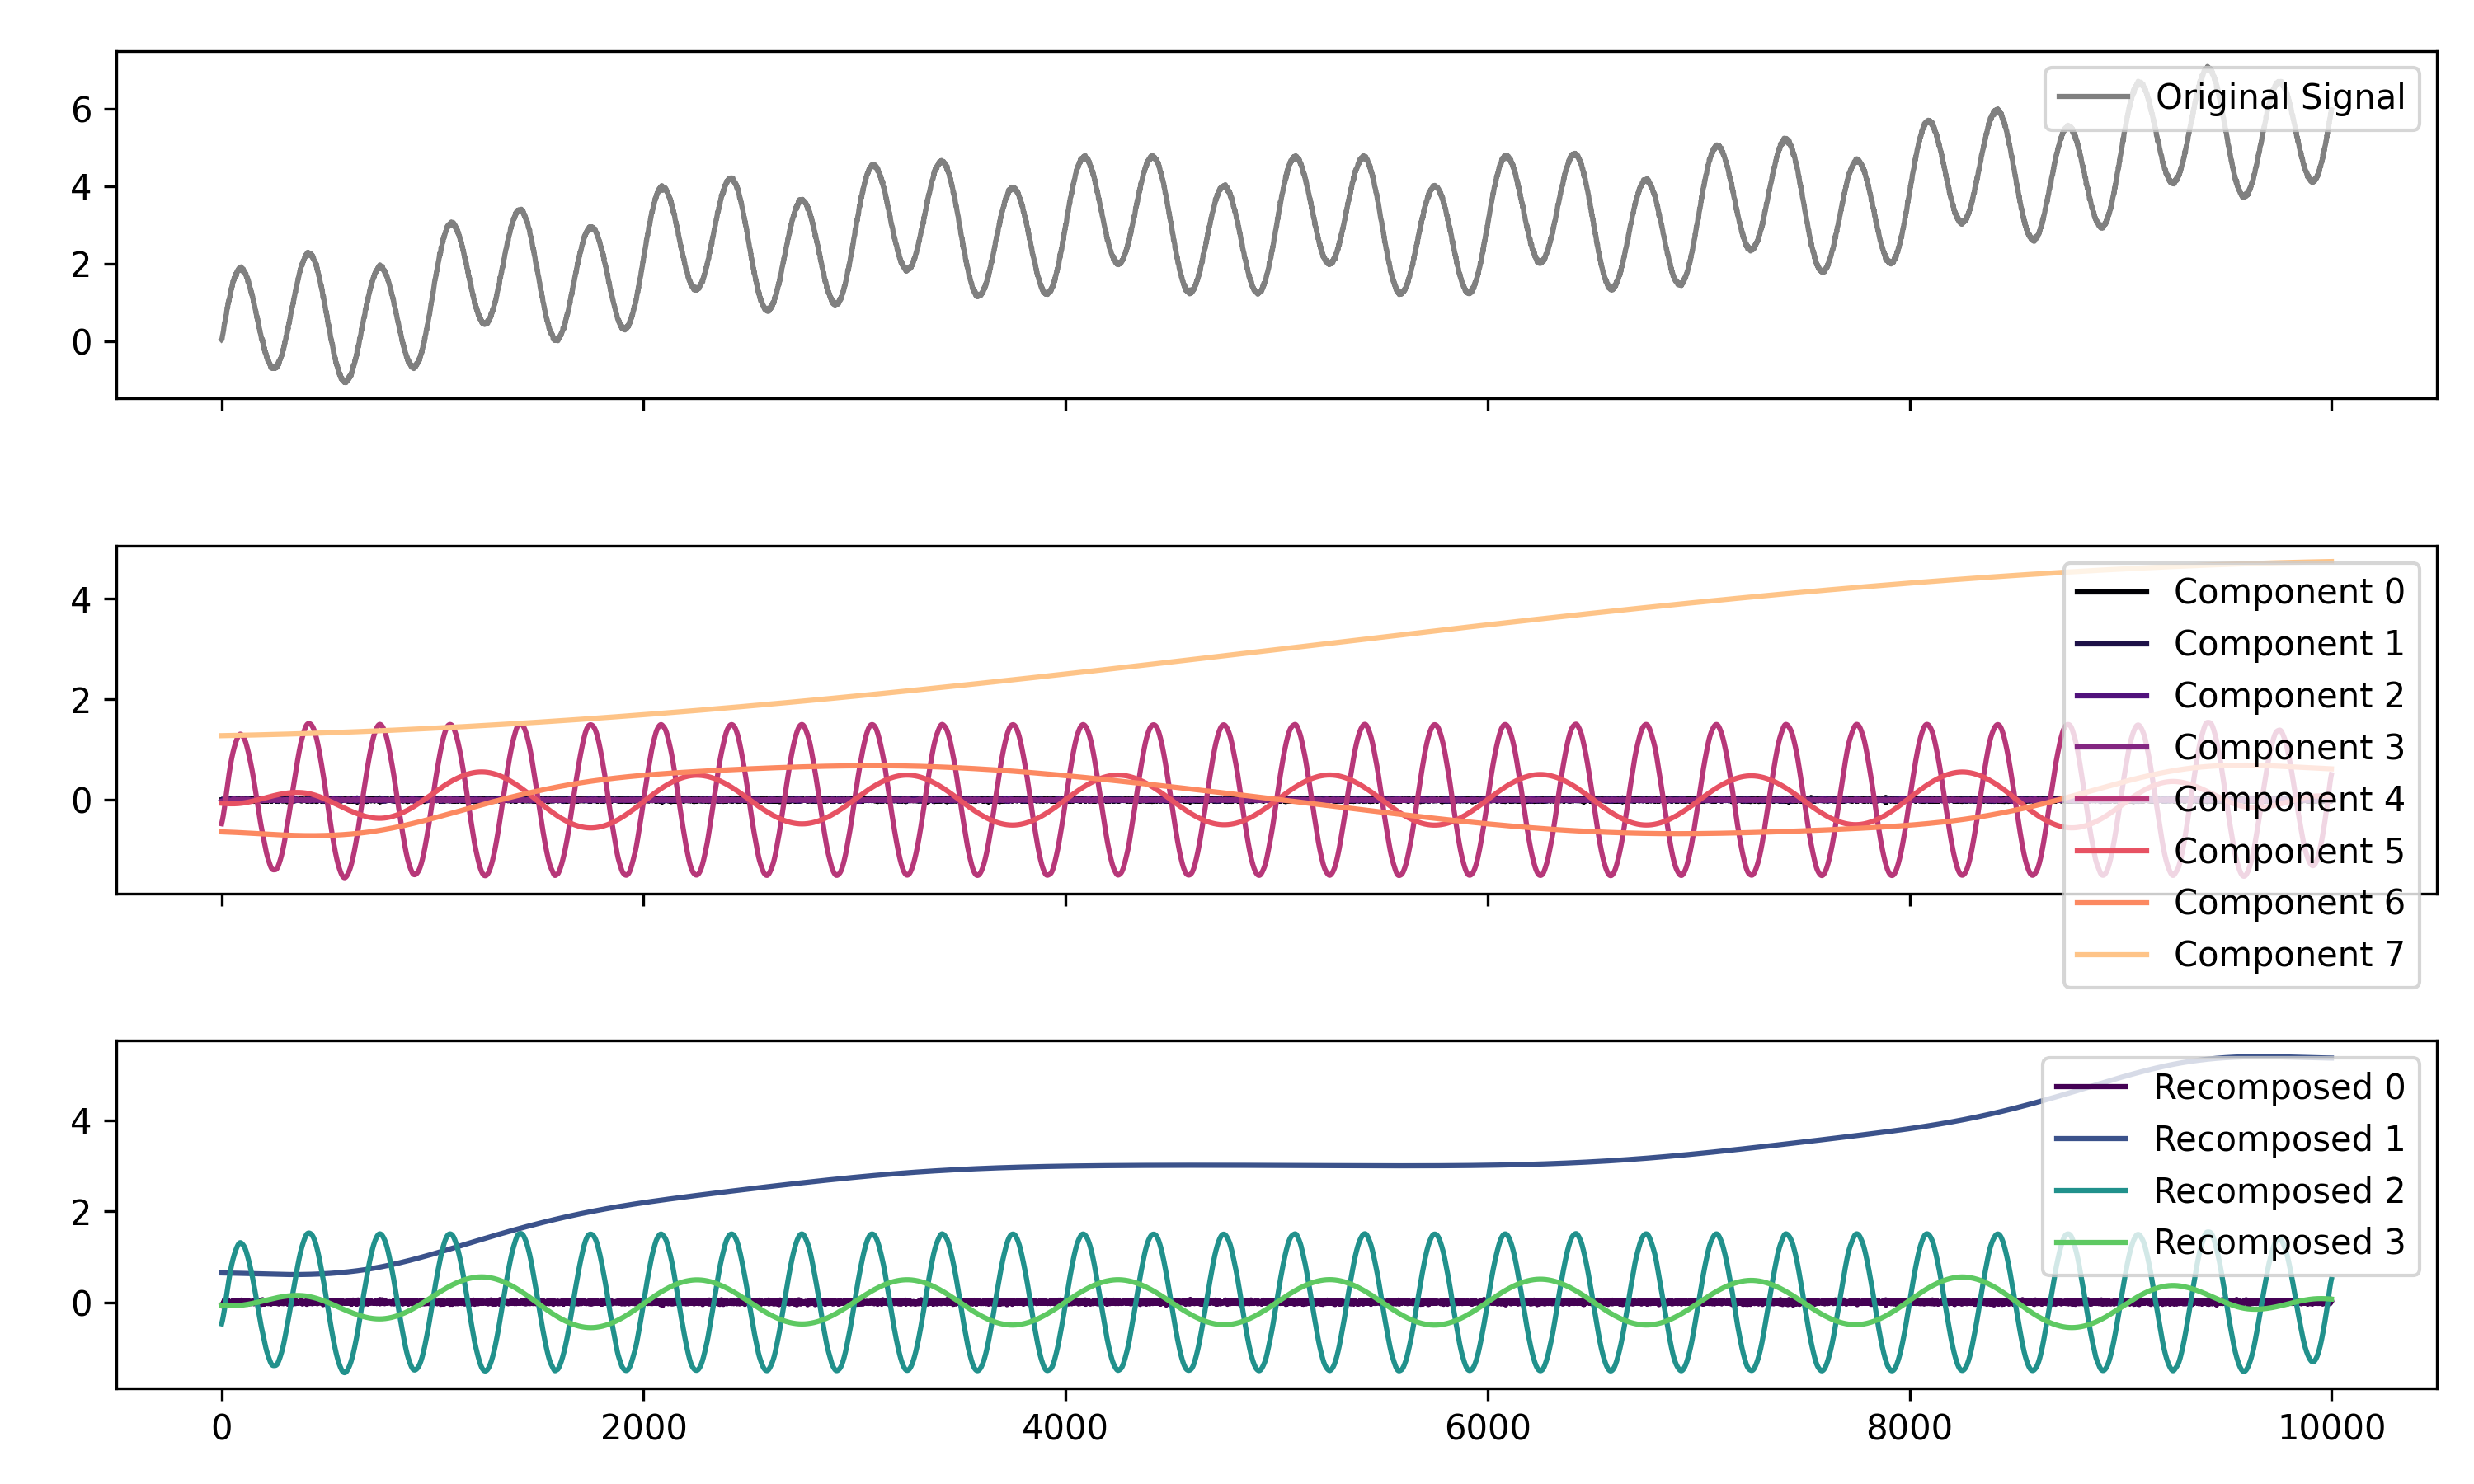
Signal Power Spectrum Density (PSD)
# Generate complex signal
signal = nk.signal_simulate(duration=20, frequency=[0.5, 5, 10, 15], amplitude=[2, 1.5, 0.5, 0.3], noise=0.025)

# Get the PSD using different methods
welch = nk.signal_psd(signal, method="welch", min_frequency=1, max_frequency=20, show=True)
multitaper = nk.signal_psd(signal, method="multitapers", max_frequency=20, show=True)
lomb = nk.signal_psd(signal, method="lomb", min_frequency=1, max_frequency=20, show=True)
burg = nk.signal_psd(signal, method="burg", min_frequency=1, max_frequency=20, order=10, show=True)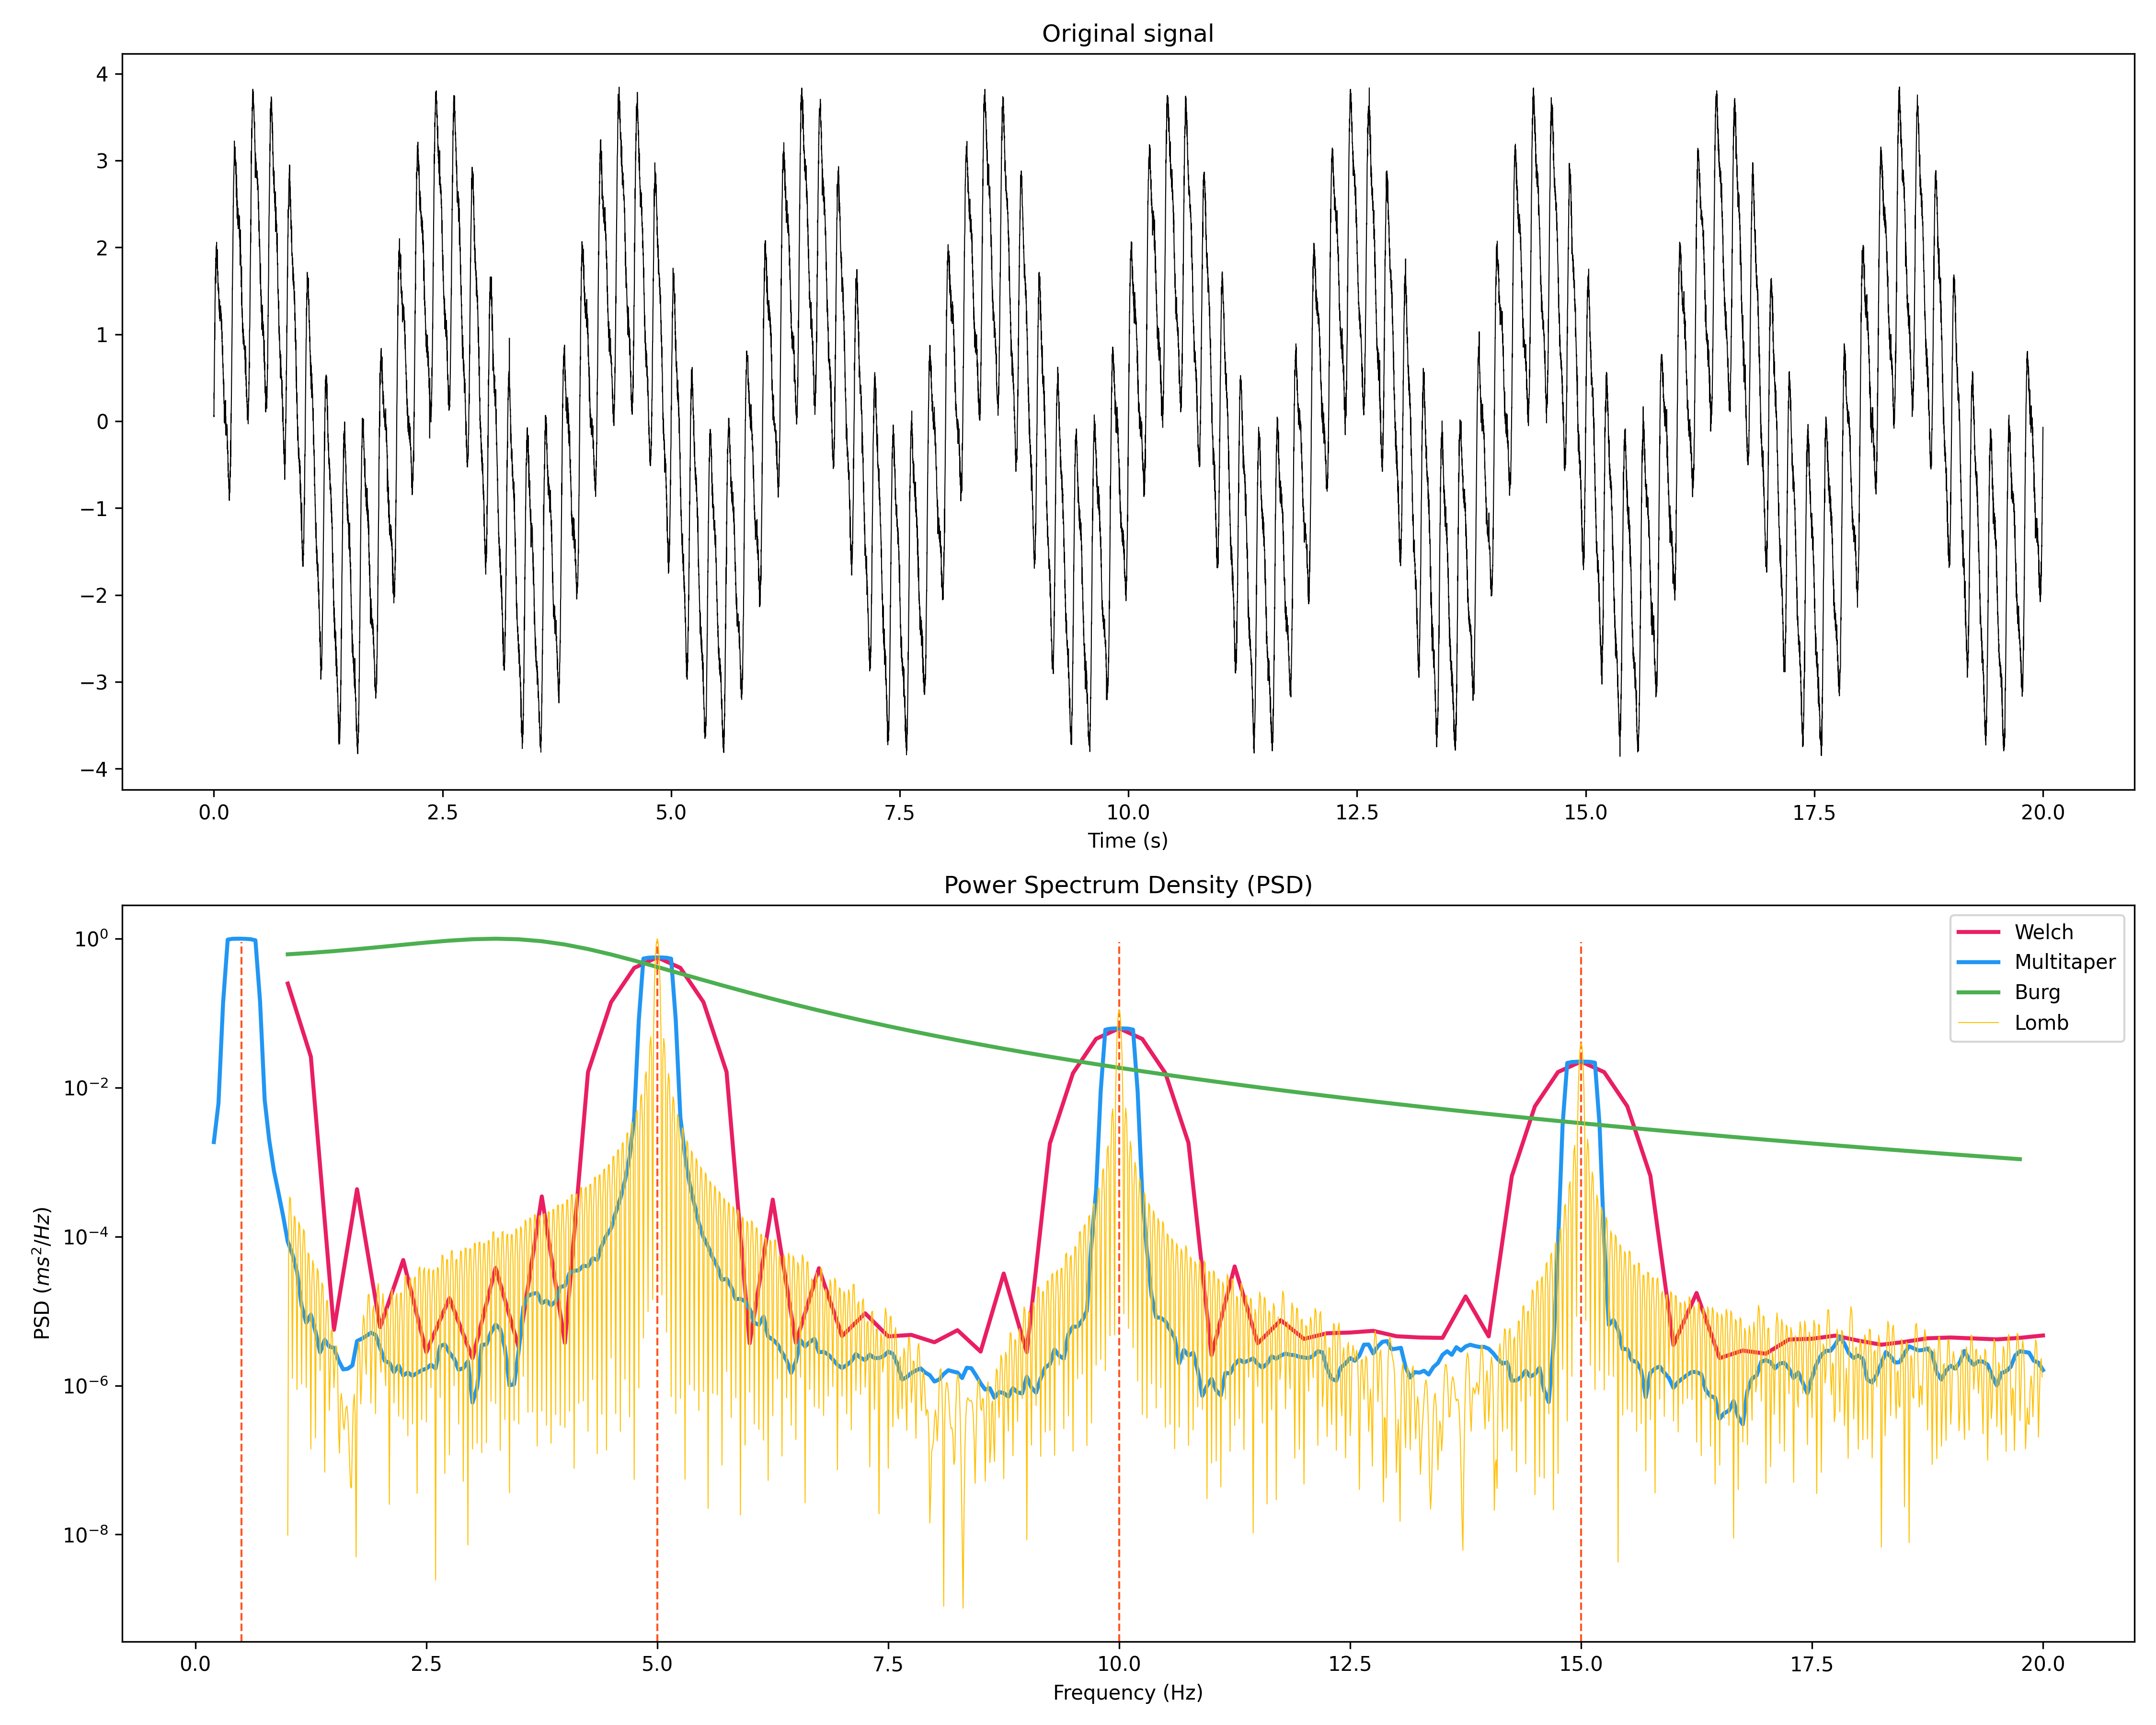
Statistics
Highest Density Interval (HDI)
x = np.random.normal(loc=0, scale=1, size=100000)

ci_min, ci_max = nk.hdi(x, ci=0.95, show=True)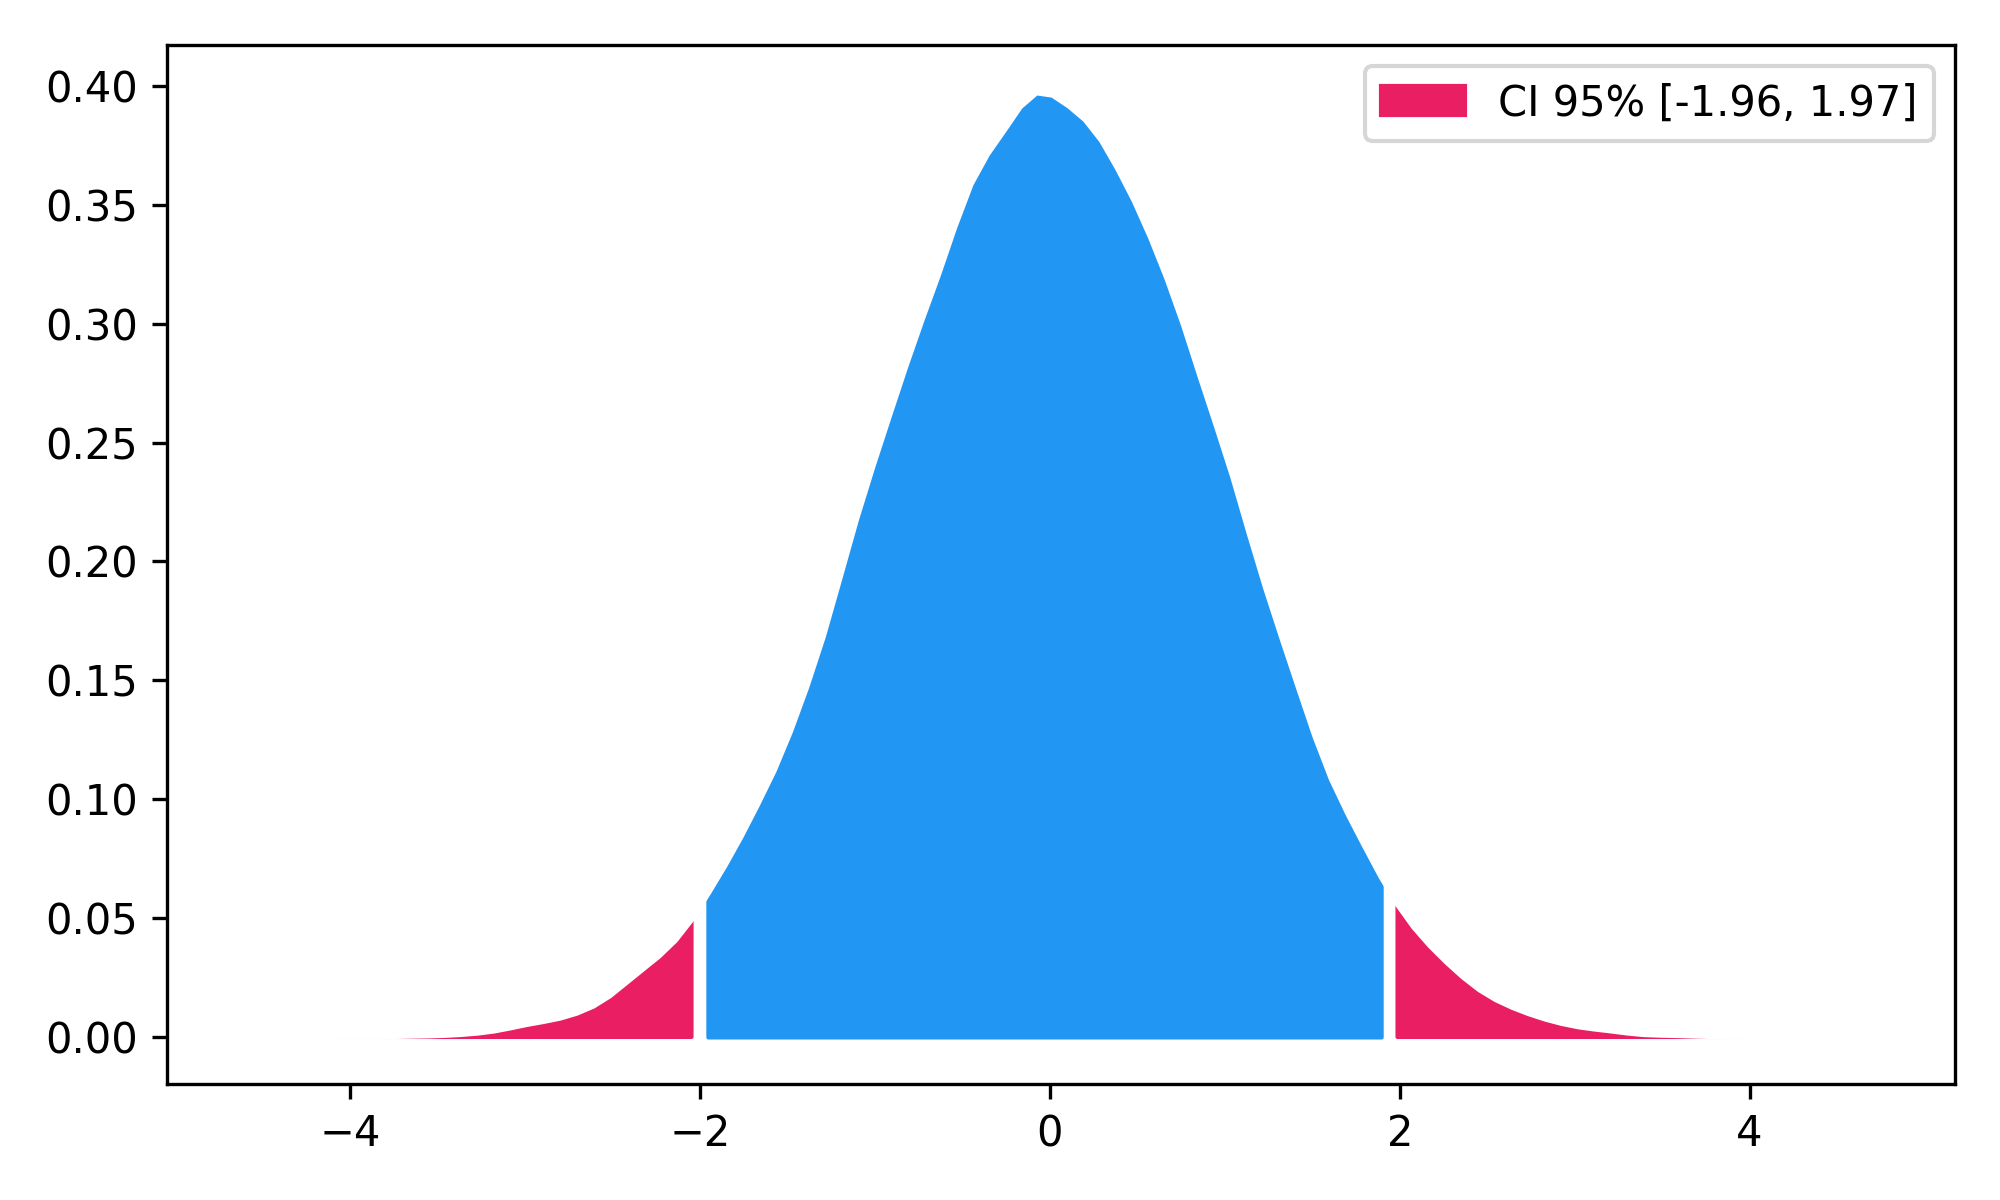
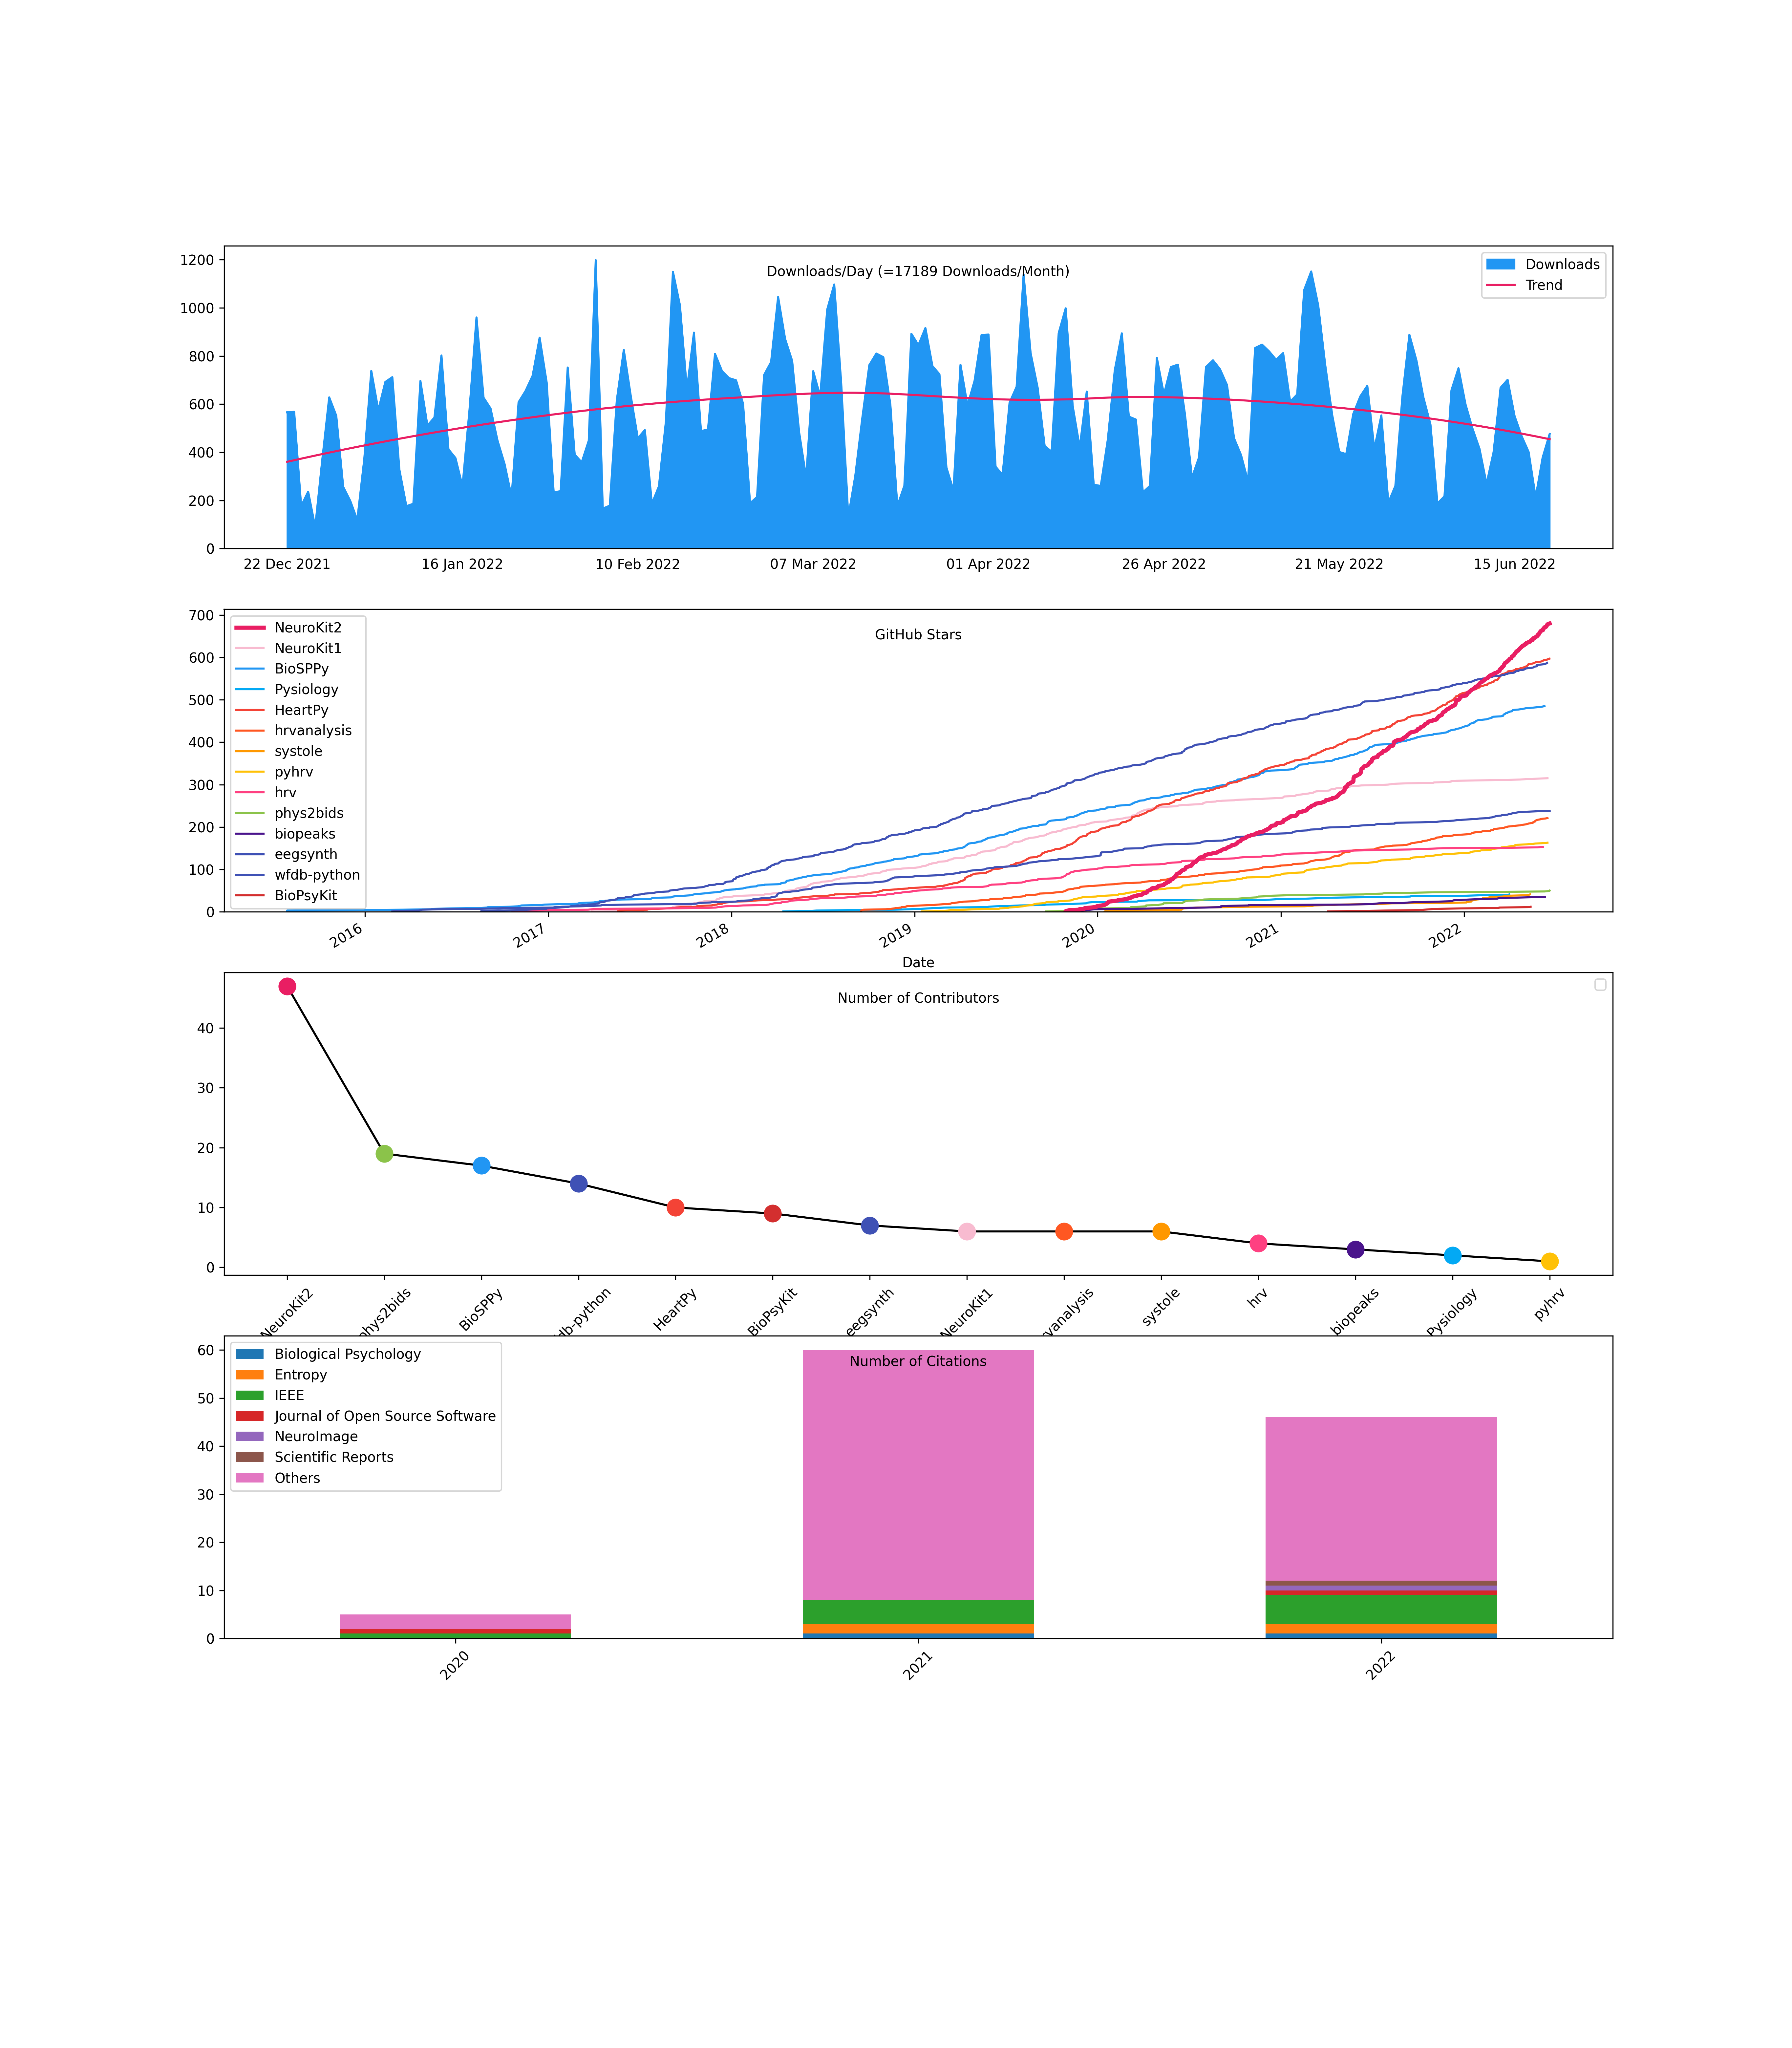
Popularity


NeuroKit2 is one of the most welcoming packages for new contributors and users, as well as the fastest-growing package. So stop hesitating and hop on board 🤗
Used at


Disclaimer
The authors do not provide any warranty. If this software causes your keyboard to blow up, your brain to liquefy, your toilet to clog or a zombie plague to break loose, the authors CANNOT IN ANY WAY be held responsible.
News
0.2.8
New Features
New feature events_find(): is now able to combine multiple digital input channels, retrieve events from the combined events channel and differentiate between the inputs that occur simultaneously.
0.2.4
Fixes
eda_sympathetic() has been reviewed: low-pass filter and resampling have been added to be in line with the original paper
eda_findpeaks() using methods proposed in nabian2018 is reviewed and improved. Differentiation has been added before smoothing. Skin conductance response criteria have been revised based on the original paper.
0.2.1
New Features
Allow for input with NaNs and extrapolation in signal_interpolate()
Add argument method in find_outliers()
A lot (see https://github.com/neuropsychology/NeuroKit/pull/645)
0.2.0
New Features
Add new time-domain measures in hrv_time(): Prc20NN, Prc80NN, MinNN, and MaxNN
0.1.6
Breaking Changes
Argument type changed to out in expspace()
New Features
Add new time-domain measures in hrv_time(): Prc20NN, Prc80NN, MinNN, and MaxNN
Allow fix_peaks() to account for larger intervals
Fixes
0.1.5
Breaking Changes
Argument r changed to radius in fractal_correlation()
Argument r changed to tolerance in entropy and complexity utility functions
Argument r_method changed to tolerance_method in complexity_optimize()
complexity_lempelziv(), fractal_higuchi(), fractal_katz(), fractal_correlation(), fractal_dfa(), entropy_multiscale(), entropy_shannon(), entropy_approximate(), entropy_fuzzy(), entropy_sample() now return a tuple consisting of the complexity index, and a dictionary comprising of the different parameters specific to the measure. For fractal_katz() and entropy_shannon(), the parameters dictionary is empty.
Restructure complexity submodules with optimization files starting with optim_*, such as optim_complexity_delay(), optim_complexity_dimension(), optim_complexity_k(), optim_complexity_optimize(), and optim_complexity_tolerance().
mutual_information() moved from stats module to complexity module.
New Features
Added various complexity indices: complexity_hjorth(), complexity_hurst(), complexity_lyapunov(), complexity_rqa(), complexity_rr(), entropy_coalition(), entropy_permutation(), entropy_range(), entropy_spectral(), fractal_nld(), fractal_psdslope(), fractal_sda(), fractal_sevcik()
Added mne_templateMRI() as a helper to get MNE’s template MRI.
Added eeg_source() as a helper to perform source reconstruction.
Added eeg_source_extract() to extract the activity from a brain region.
Added parallel_run() in misc as a parallel processing utility function.
Added find_plateau() in misc to find the point of plateau in an array of values.
Added write_csv() in data to facilitate saving dataframes into multiple parts.
Added more complexity-related functions, entropy_cumulative_residual(), entropy_differential(), entropy_svd(), fractal_petrosian(), and information_fisher().
Updates logic to find kmax in fractal_higuchi()
Add RSP_Amplitude_Baseline in event-related analysis
Add argument add_firstsamples in mne_channel_extract() to account for first sample attribute in mne raw objects
Allow plotting of mne.Epochs in epochs_plot()
Add mne_crop() to crop mne Raw objects with additional flexibility to specify first and last elements
Plotting function in eeg_badchannels() to visualize overlay of individual EEG channels and highlighting of bad ones
Add eog_peaks() as wrapper for eog_findpeaks()
Allow ecg_delineate() to account for different heart rate
Fixes
Ensure detected offset in emg_activation() is not beyond signal length
Raise ValueError in _hrv_sanitize_input() if RRIs are detected instead of peaks
Ensure that multifractal DFA indices returned by fractal_mdfa() is not Nan when array of slopes contains Nan (due to zero fluctuations)
Documentation of respiration from peak/trough terminology to inhale/exhale onsets
Change labelling in rsp_plot() from “inhalation peaks” and “exhalation troughs” to “peaks (exhalation onsets)” and “troughs (inhalation onsets)” respectively.
Change RSP_Amplitude_Mean/Min/Max parameters to be corrected based on value closest to t=0 in event-related analysis, rather than using all pre-zero values.
Have rsp_rrv() compute breath-to-breath intervals based on trough indices (inhalation onsets) rather than peak indices
Compute rsp_rate() based on trough indices (rather than peak indices) in ‘periods’ method
0.1.4.1
Fixes
Adjust kmax parameter in fractal_higuchi() according to signal length as having kmax more than half of signal length leads to division by zero error
Ensure that sanitization of input in _hrv_dfa() is done before windows for DFA_alpha2 is computed
np.seterr is added to fractal_dfa() to avoid returning division by zero warning which is an expected behaviour
0.1.4
Breaking Changes
fractal_df() now returns a dictionary of windows, fluctuations and the slope value (see documentation for more information. If multifractal is True, the dictionary additionally contains the parameters of the singularity spectrum (see singularity_spectrum() for more information)
New Features
Add convenience function intervals_to_peaks() useful for RRI or BBI conversion to peak indices
hrv_nonlinear() and rrv_rsp() now return the parameters of singularity spectrum for multifractal DFA analysis
Add new complexity measures in fractal_higuchi(), fractal_katz() and fractal_lempelziv()
Add new time-domain measures in hrv_time(): SDANN and SDNNI
Add new non-linear measures in hrv_nonlinear(): ShanEn, FuzzyEn, HFD, KFD and LZC
Fixes
Add path argument in mne_data() and throw warning to download mne datasets if data folder is not present
The implementation of TTIN in hrv_time() is amended to its correct formulation.
The default binsize used for RRI histogram in the computation of geometric HRV indices is set to 1 / 128 seconds
0.1.3
Breaking Changes
None
New Features
Add internal function for detecting missing data points and forward filling missing values in nk.*_clean() functions
Add computation of standard deviation in eventrelated() functions for ECG_Rate_SD, EMG_Amplitude_SD, EOG_Rate_SD, PPG_Rate_SD, RSP_Rate_SD, RSP_Amplitude_SD
Add labelling for interval related features if a dictionary of dataframes is passed
Retrun Q peaks and S Peaks information for wavelet-based methods in nk.ecg_delineate()
Fixes
Fix epochs columns with dtype: object generated by nk.epochs_create()
Bug fix ecg_findpeaks_rodrigues for array out of bounds bug
0.1.2
New Features
Additional features for nk.rsp_intervalrelated(): average inspiratory and expiratory durations, inspiratory-to-expiratory (I/E) time ratio
Add multiscale entropy measures (MSE, CMSE, RCMSE) and fractal methods (Detrended Fluctuation Analysis, Correlation Dimension) into nk.hrv_nonlinear()
Allow for data resampling in nk.read_bitalino()
Add bio_resting_8min_200hz into database for reading with nk.data()
Reading of url links in nk.data()
Allow for nk.hrv() to compute RSA indices if respiratory data is present
All hrv functions to automatically detect correct sampling rate if tuple or dict is passed as input
Add support for PPG analysis: nk.ppg_eventrelated(), nk.ppg_intervalrelated(), nk.ppg_analyze()
Add Zhao et al. (2018) method for nk.ecg_quality()
Add tests for epochs module
- Add sub-epoch option for ECG and RSP event-related analysis:
users can create a smaller sub-epoch within the event-related epoch
the rate-related features of ECG and RSP signals are calculated over the sub-epoch
the remaining features are calculated over the original epoch, not the sub-epoch
Fixes
Fix propagation of values in nk.signal_formatpeaks() for formatting SCR column outputs generated by eda_peaks()
Fix docstrings of nk.rsp_phase(), from “RSP_Inspiration” to “RSP_Phase”
Update signal_filter() method for rsp_clean(): to use sos form, instead of ba form of butterworth (similar to eda_clean())
0.1.1
New Features
Use duration from nk.events_find() as epochs_end in nk.epochs_create()
Allow customized subsets of epoch lengths in nk.bio_analyze() with window_lengths argument
Add nk.find_outliers() to identify outliers (abnormal values)
Add utility function - nk.check_type() to return appropriate boolean values of input (integer, list, ndarray, pandas dataframe or pandas series)
(experimental) Add error bars in the summary plot method to illustrate standard error of each bin
Fixes
Fix type of value in nk.signal_formatpeaks() to ensure slice assignment is done on the same type
0.0.1 (2019-10-29)
First release on PyPI.
Release history Release notifications | RSS feed


Download files
Download the file for your platform. If you're not sure which to choose, learn more about installing packages.
Source Distribution
Built Distribution
Filter files by name, interpreter, ABI, and platform.
If you're not sure about the file name format, learn more about wheel file names.
Copy a direct link to the current filters
File details
Details for the file neurokit2-0.2.12.tar.gz.
File metadata
- Download URL: neurokit2-0.2.12.tar.gz
- Upload date:
- Size: 20.8 MB
- Tags: Source
- Uploaded using Trusted Publishing? No
- Uploaded via: twine/6.1.0 CPython/3.12.9
File hashes
| Algorithm | Hash digest | |
|---|---|---|
| SHA256 |
f1ca66136a397ce31bc9df8319a3fd04c544950b6e43080d13ea83e89492ca7c
|
|
| MD5 |
d9387d0a73082972f4f25ced3943112c
|
|
| BLAKE2b-256 |
f4d41894bfd16e5eff221b029c6cb662c2a16a5a178dd549990dd061b84cbeff
|
File details
Details for the file neurokit2-0.2.12-py2.py3-none-any.whl.
File metadata
- Download URL: neurokit2-0.2.12-py2.py3-none-any.whl
- Upload date:
- Size: 708.4 kB
- Tags: Python 2, Python 3
- Uploaded using Trusted Publishing? No
- Uploaded via: twine/6.1.0 CPython/3.12.9
File hashes
| Algorithm | Hash digest | |
|---|---|---|
| SHA256 |
caad0a381fd68118fce380fa72a212011da091c73626b663cb21d9aff234cac5
|
|
| MD5 |
34010a97479f94f504a8844d6c277472
|
|
| BLAKE2b-256 |
23d2e9d259457bc2885642ce4abe6f86e4359a53039e7ca7c04b381cd3347454
|


