
nii-plot
Plot mean NIfTI timeseries

Installation
pip install nii-plot
Motivation
When dealing with volumetric timeseries data it can be useful to view a high-level aggregate view of the timeseries.
This package provides a way to easily visualize 4D NIfTI images by plotting the volume-wise mean timeseries.
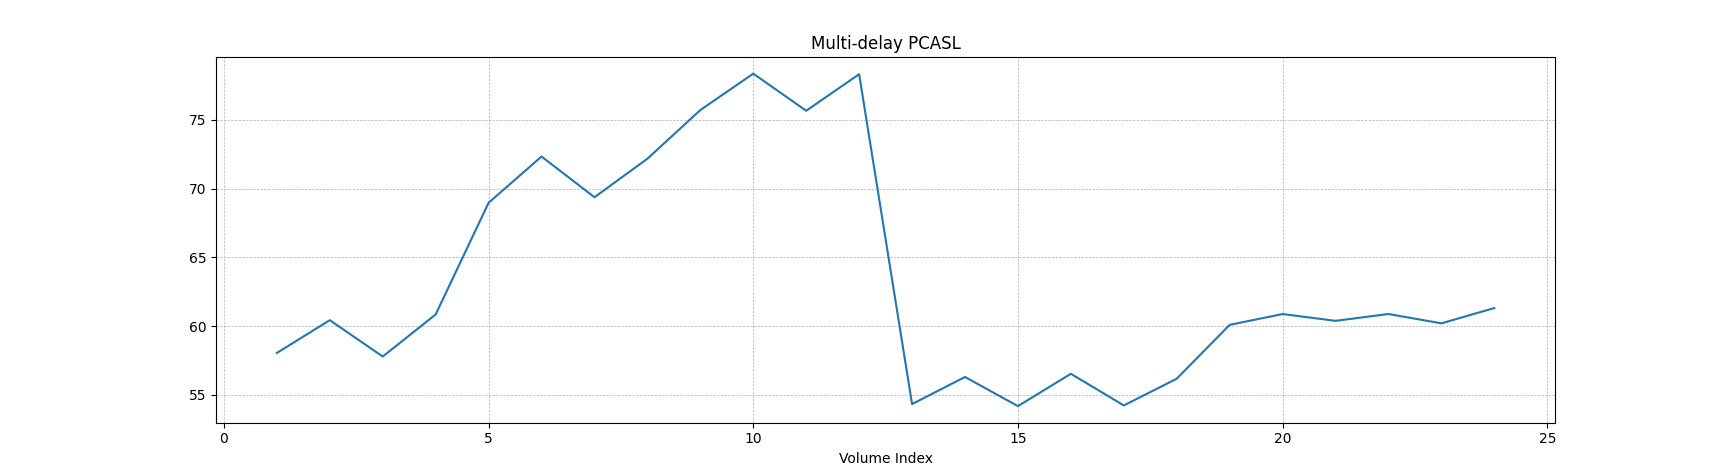
For example, a command like:
nii-plot -i '1:' -t 'Multi-delay PCASL' /path/to/nii/file.nii.gz
might yield something like:
Usage
nii-plot exposes a CLI: nii-plot
$ nii-plot --help
usage: nii-plot [-h] [-p PERCENTILE | -m MASK] [-i INDEX_SPEC]
                [-s | -q | -l] [-t TITLE] [-x X_LABEL] [-y Y_LABEL]
                [-v] [-D]
                path

positional arguments:
  path                  The NIfTI file

optional arguments:
  -h, --help            show this help message and exit
  -p PERCENTILE, --percentile PERCENTILE
                        Percentile to use to threshold the data.
                        Value in the image above that percentile
                        will be used in computing the volume-wise
                        means. (default: 50.0)
  -m MASK, --mask MASK  Mask NIfTI image. Only non-zero voxels in
                        this image are included in the mean
                        computation. Must be the same (spatial)
                        shape as the input file.
  -i INDEX_SPEC, --index-spec INDEX_SPEC
                        Volume indicies to include in the plot. Can
                        use numpy-like slicing (start:stop[:step]),
                        for example, to plot the first volume, then
                        the 10th and 11th volumes, then from the
                        16th to the end, we could write:
                        '0,9:11,15:'. (default: '::')
  -s, --scatter         Plot the mean time series as a scatter plot
  -q, --paired-scatter  Plot a paired scatter plot (useful for ASL
                        data)
  -l, --line            Plot the mean time series as a line chart
  -t TITLE, --title TITLE
                        Plot title
  -x X_LABEL, --x-label X_LABEL
                        X-axis label
  -y Y_LABEL, --y-label Y_LABEL
                        Y-axis label
  -v, --version         show program's version number and exit
  -D, --debug           run program in debug mode
Supplying a mask
By default, nii-plot will threshold the input image, excluding from the mean computation all voxels with values falling below the 50th percentile.
This choice of percentile value at which to threshold may not be desirable, hence the value can be changed via the -p/--percentile option. The argument to this option should be an int or float between 0 and 100. To effectively "turn off" thresholding you can specify: --percentile=0.
If you would prefer that the mean computation happen only across voxels in a specific mask, then you can use the -m/--mask option (mutually exclusive to -p/--percentile). In this case the volume-wise mean computation will only include voxels which correspond to voxels in the mask image whose value is greater than 0.
Selecting which volumes to plot
You can choose which volumes are plotted by nii-plot by supplying an index spec.
An index spec is a comma-separated list of strings where each entry in the list is either an integer (i.e. a volume index) or a numpy-style slice expression (start:stop[:step]).
For example, to plot the 1st volume, the 10th and 11th volumes, and the 16th volume to the end of the timeseries, we could write: 0,9:11,15:, i.e. this is a comma-separated list of 3 values: 0, 9:11, and 15:. 0 means include the 0th volume, 9:11 means include all volumes from index 9 (inclusive) to index 11 (exclusive), 15: means include all volumes from index 15 (inclusive) to the end of the timeseries.
IMPORTANT: volume indexing is 0-based
Plot type
By default, nii-plot will produce a line plot (as shown above). You can change to a scatter plot using the -s/--scatter flag.
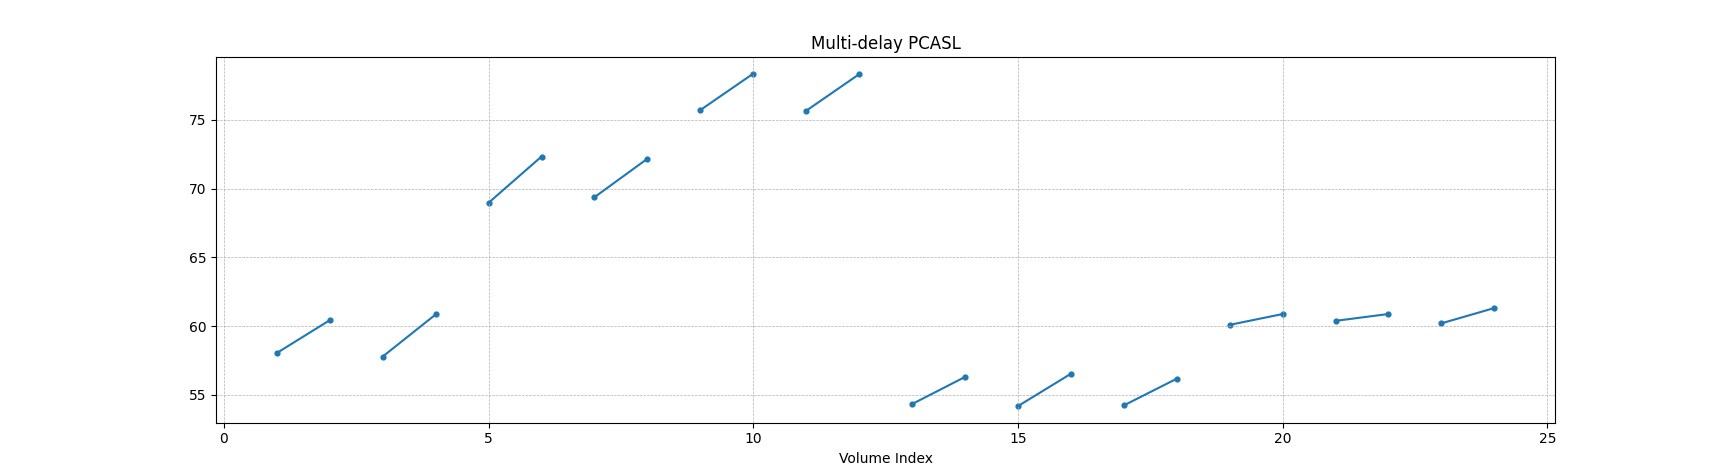
There is another plot type which is useful when visualizing ASL data, which is the paired-scatter plot (-q/--paired-scatter), which looks like:
Contributing
- Have or install a recent version of
poetry(version >= 1.1) - Fork the repo
- Setup a virtual environment (however you prefer)
- Run
poetry install - Run
pre-commit install - Add your changes (adding/updating tests is always nice too)
- Commit your changes + push to your fork
- Open a PR
1 maintainer

Metadata
1 maintainer
Release files for nii-plot 1.0.0
For a detailed explanation of source distributions (sdists) and built distributions (wheels), please see the package formats documentation.
Source distribution (sdist)
| File | Size | Uploaded | |
|---|---|---|---|
| nii-plot-1.0.0.tar.gz | 6.6 kB | Details |
Built distribution (wheel)
| File | Interpreter | ABI | Platform | Reset |
|---|---|---|---|---|
| nii_plot-1.0.0-py3-none-any.whl | Python 3 | none | any | Details |
Total release size: 13.0 kB
Release files / nii-plot-1.0.0.tar.gz
| Download URL | nii-plot-1.0.0.tar.gz |
|---|---|
| Size | 6.6 kB |
| Tags | Source |
|
SHA-256 checksum How to use checksums |
589d49af51c69035e8e956ad3d9c4638306060041a1923dc43fe5fc8765ca62a
|
|
BLAKE2b-256 checksum How to use checksums |
05e9e04d9562dc5f7488ff43c7375e5a45373521cd986b6c6fc7ed6c6a698b0d
|
| Upload date | |
|
Uploaded using Trusted Publishing? What is trusted publishing? |
No |
| Uploaded via |
poetry/1.1.12 CPython/3.10.4 Linux/5.13.0-1022-azure
|
Release files / nii_plot-1.0.0-py3-none-any.whl
| Download URL | nii_plot-1.0.0-py3-none-any.whl |
|---|---|
| Size | 6.4 kB |
| Tags | Python 3 |
|
SHA-256 checksum How to use checksums |
310953bad9d051ad78ca3a6986716cc8ab614f3dd263897339e4ac138a8e9407
|
|
BLAKE2b-256 checksum How to use checksums |
6ab43d1fb72d006f7920770a3e9af97311203a859f12ee410e3a7b79210954e7
|
| Upload date | |
|
Uploaded using Trusted Publishing? What is trusted publishing? |
No |
| Uploaded via |
poetry/1.1.12 CPython/3.10.4 Linux/5.13.0-1022-azure
|














