
nodetop
See what your cluster actually has free — and why a queue that looks fine will not take your job.
Slurm · PBS Pro / OpenPBS / Torque · LSF · Grid Engine · Kubernetes · a bare pool of machines



pip install nodetop
nodetop        # or: nt
Zero runtime dependencies, Python 3.10+. You reach for this when a cluster is misbehaving, so it runs on a login node with nothing but the system Python.
Starting faster on an NFS home (most clusters)
Startup there is filesystem round trips, not CPU: two dozen module files at
roughly 19 ms each. One zip on sys.path is one open, so build a single-file
copy on the machine that will run it:
python tools/build_pyz.py --fast -o ~/bin/nt.pyz
~/bin/nt.pyz status                # or: python ~/bin/nt.pyz status
Measured on a cluster whose home is NFS, thirteen runs each, medians:
| installed | nt.pyz --fast |
|
|---|---|---|
nodetop --version |
406 ms | 222 ms |
nodetop queues |
475 ms | 240 ms |
nodetop nodes --all |
604 ms | 241 ms |
Keep it on your PATH if you like -- it is a single executable file:
cp ~/bin/nt.pyz ~/bin/nt # then just: nt status
--fast ships this interpreter's bytecode with docstrings stripped, so it is
locked to that Python version, and the archive's shebang names that interpreter
-- build it where you run it. Drop the flag for an
archive that runs on any supported Python and is still well ahead of the
installed layout. The pip-installed nodetop and nt are untouched either
way.
Why the second nt opens instantly
Most of a first start is dry-runs: nodetop asks the scheduler which partitions
will actually accept a job from you, because a declared allowlist gets that wrong
eleven times out of nineteen on the cluster this was built against. Each question
costs ~98 ms inside the controller and they serialise, so nineteen of them is
~1.6s of the ~1.9s start.
An interactive session opens on the answer from your last run -- ~0.33s --
re-asks in the background, and reloads itself if anything changed. The frame says
access checked 7m ago while that is in flight, and stops saying it once the
check agrees.
A printout does not do this: nodetop status | grep, --json and --replay
all wait for the real answer, because they get one shot at being right.
The answers live in ${XDG_CACHE_HOME:-~/.cache}/nodetop/access/ (one small
file per cluster, mode 600, 15-minute bound). To switch it off:
export NODETOP_ACCESS_TTL=0 # always ask before drawing anything
What you get
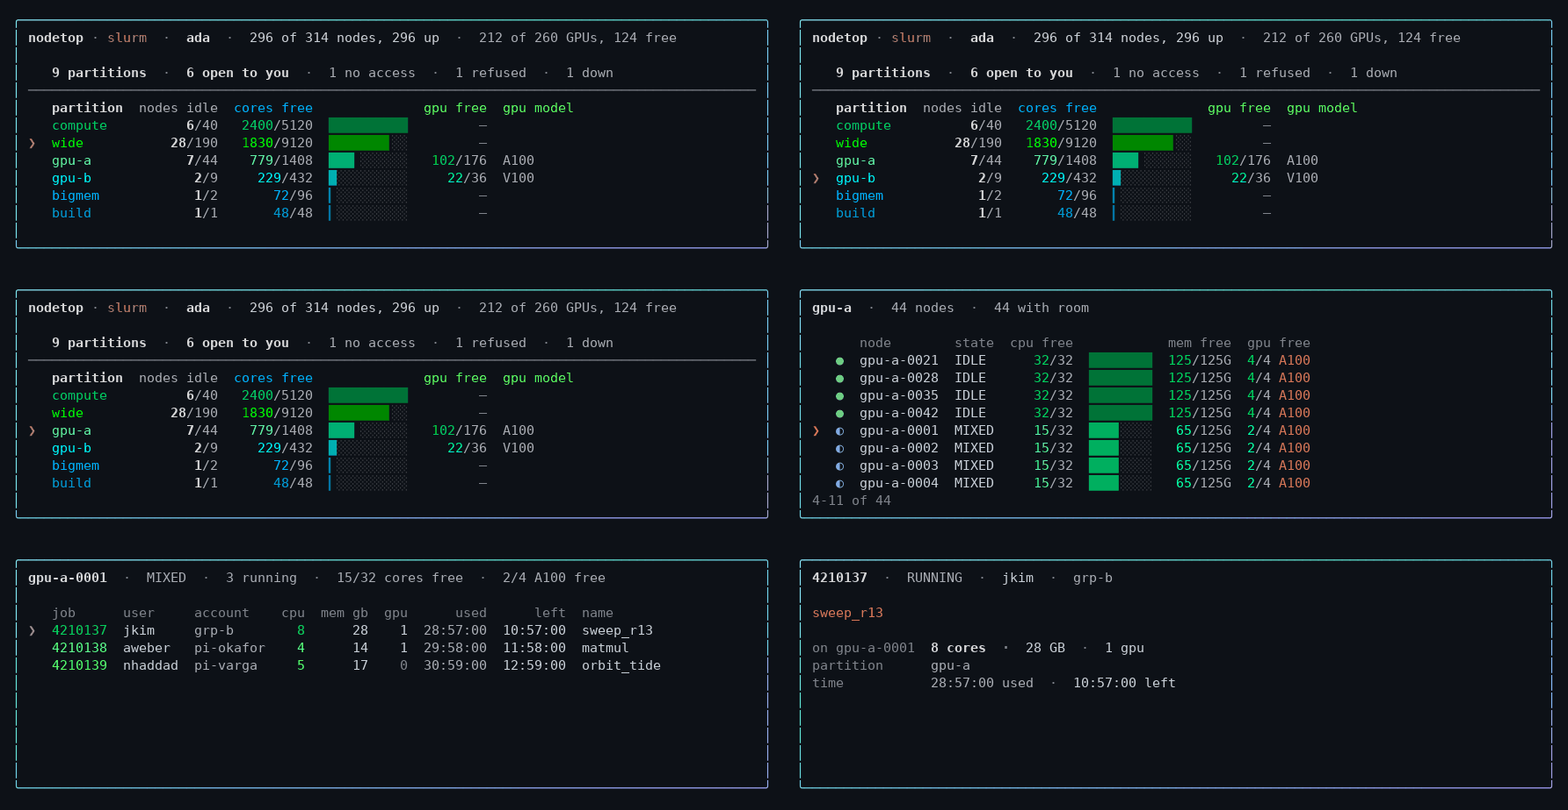
Arrow keys, enter to open, q to leave. The same screen the whole way down —
partitions, then the nodes inside one, then the jobs on a node, then a job.
╭──────────────────────────────────────────────────────────────────────────────────────╮
│ nodetop · slurm  ·  ada  ·  328 of 607 nodes, 326 up  ·  222 of 358 GPUs, 53 free    │
│                                                                                      │
│    87 partitions  · ❯8 open to you  ·  65 no access  ·  11 refused  ·  3 down        │
│ ──────────────────────────────────────────────────────────────────────────────────── │
│    partition   nodes idle  cores free              gpu free  gpu model               │
│    compute           0/40   1695/5120  ██████████         —                          │
│    gpu-a            11/44    406/1408  ██▍░░░░░░░    48/176  A100, A40               │
│    wide             0/190    436/9120  ██▋░░░░░░░         —                          │
│    gpu-b              0/9     186/432  █▏░░░░░░░░      0/36  V100, RTX6000           │
╰──────────────────────────────────────────────────────────────────────────────────────╯
Every column is free/total under a header naming the numerator, and one hue per
resource. wide has 190 nodes and 2654 cores its scheduler calls free. 436 of them can
actually be allocated: the rest sit on nodes whose memory is entirely spoken for, so
nothing can land there. free is what you can have, not what is advertised.
(Names and figures throughout are illustrative. Run it on your own cluster for yours.)
Every partition on the cluster is in exactly one term of that second line, so the counts reconcile with the total. 8 of 87 is the honest answer here — the rest your accounts are not on, or the scheduler refuses, or are down.
Navigating
On a terminal it is interactive by default. Arrow keys move the cursor, enter
opens what it points at, q leaves. Everything on screen can be opened:
- a partition → the nodes inside it, roomiest first
- a node → its state and drain reason in full, then the jobs on it
- a job → who owns it, its share of this node, and every node it holds
- a count on the funnel line → the partitions it counts, and why each is out
- the partition total → every partition on the cluster, each with the reason it is or is not in the table
Left and right move along the funnel line; up and down move between rows. Each view replaces the last in the same place, so there is one screen rather than a transcript of them.
--static prints and exits — for watch nodetop, or a pipe.
Commands
nodetop                      # the overview
nodetop zoom gpu-a           # one partition: its gates, then its nodes
nodetop where -g 4 --gpu-mem 40G --needs bf16 -t 2-00:00:00
nodetop nodes --gpu --free   # GPU nodes with something free now
nodetop queues -q test       # every gate on one queue
nodetop check -q gpu         # ask the control plane directly
nodetop health               # down, drained, and silently degraded nodes
nodetop gpus                 # what each accelerator model can do
nodetop exclude --gpu-nodes  # an exclusion list for CPU-only work
nodetop snapshot -o snap.json && nodetop --replay snap.json status
Flags worth knowing
--json on every command · --all widens a view from what you can use to the
whole cluster (status, queues, zoom, nodes, where, accelerators),
--detail unfolds the reasoning behind a verdict (queues) · --needs bf16
requires a capability, --tolerates waives one · --backend slurm skips
autodetection and --replay snap.json works from a saved snapshot ·
--static (status), --no-color, --ascii for pipes and dumb terminals.
--json works on every command and carries everything the text does, caveats
included. Exit status is usable in a pipeline: where and check return 0 when
somewhere could take the job and 1 when nothing can. check also returns 2 when
there is no dry-run to ask — a replayed snapshot, or a system with no probe — and
says so; where answers from the declared ACLs instead, which is what check
itself points you to in that case, so it returns 0 or 1 there like anywhere else.
Any command returns 2 for a usage error, 3 when no batch system is usable, and
130 on Ctrl-C.
The vocabulary follows the system — partition on Slurm, queue on PBS/LSF/SGE,
namespace on Kubernetes, pool on an ssh pool — and -p is an alias for -q on
every command that takes one: queues, nodes, where, check, exclude and
accelerators. The commands that do not name a single queue (status, zoom,
health, backends, snapshot) take neither.
Why it exists
Your scheduler says the queue is up. The accounting table says you have access. The dry-run says your job passed verification. All three can be true while your job never runs — and every batch system has the same disagreements, in its own vocabulary:
| The claim | What it hides |
|---|---|
| "There are idle nodes here" | the partition is DOWN; those nodes can start nothing |
| "You have access" | the association table says yes, the submit filter says Invalid membership |
| "Verification passed" | the site filter passed, the scheduler core refused |
| "No time limit" | the partition is unlimited, a QOS caps you at two days |
| "Admitted, so it will run" | it pends forever on a limit nobody published |
| "44 of 48 cores are idle" | every byte of memory is allocated; nothing can land |
| "There is room, so it starts now" | the scheduler's own estimate says 4h 24m |
| "That job is using 512 cores here" | it holds 7; the rest are on 41 other nodes |
| "4 GPUs available" | no scheduler knows whether they do bf16 |
So the reasoning is scheduler-independent and lives in nodetop.core, which
imports no backend. Only acquiring the facts differs, and that is one adapter
per system:
nodetop/
  core/       model · hardware · capacity · fit · duration   ← knows nothing about schedulers
  backends/   slurm · pbs · lsf · sge · kubernetes · sshpool ← knows exactly one
Where a fact is missing or ambiguous, the answer is the one that claims less: an unidentifiable accelerator does not count toward a stated capability, a truncated node record is unschedulable rather than idle, and a refusal that was never obtained is not reported as one. The failure mode of that bias is a needless warning. The other way round is a job sent somewhere it cannot run, discovered ninety minutes later.
Library
from nodetop import Cluster, JobShape, rank

cluster = Cluster.load()                  # autodetects the batch system
cluster.can_probe                         # False on PBS and LSF -- check this
cluster.queues["test"].usable             # False
[b.code for b in cluster.queues["test"].structural_blockers()]
# ['QUEUE_DISABLED', 'NO_ACCOUNTS', 'NO_QOS']

for place in rank(cluster, JobShape(nodes=1, gpus_per_node=4, requires=("bf16",)),
                  use_probe=True):
    print(place.queue, place.runnable_now, place.confirmed, place.earliest_start)
Every query runs against one snapshot, so all the numbers in a report describe the same instant.
Development
git clone https://github.com/PursuitOfDataScience/nodetop
cd nodetop && pip install -e ".[dev]"
pytest          # ~4945 tests, no batch system required
ruff check src tests && mypy src
The suite is hermetic: every test drives recorded scheduler output, so it passes
on a laptop and in CI. Adding a backend means implementing one protocol —
backends/base.py — and answering can_probe honestly.
Design notes covers why each behaviour is the way it is: the defects that shaped it, and what each one cost.
License
MIT
1 maintainer

Download files
Download the file for your platform. If you're not sure which to choose, learn more about installing packages.
Source Distribution
Built Distribution
Filter files by name, interpreter, ABI, and platform.
If you're not sure about the file name format, learn more about wheel file names.
Copy a direct link to the current filters
File details
Details for the file nodetop-0.6.0.tar.gz.
File metadata
- Download URL: nodetop-0.6.0.tar.gz
- Upload date:
- Size: 703.9 kB
- Tags: Source
- Uploaded using Trusted Publishing? Yes
- Uploaded via:
twine/7.0.0 CPython/3.13.14
File hashes
| Algorithm | Hash digest | |
|---|---|---|
| SHA256 |
7093c0560dfbc307c009ea194df854cb53fa74db5e7a05b58d53ccffb8ecec6d
|
|
| MD5 |
2ba1e8722385dcb5396647a3998c8122
|
|
| BLAKE2b-256 |
dfe718b99ecaf5b688759adf87492a4d72d7746946e5db53d38b1573e106b106
|
Provenance
The following attestation bundles were made for nodetop-0.6.0.tar.gz:
Publisher:
release.yml on PursuitOfDataScience/nodetop
-
Statement:
-
Statement type:
https://in-toto.io/Statement/v1 -
Predicate type:
https://docs.pypi.org/attestations/publish/v1 -
Subject name:
nodetop-0.6.0.tar.gz -
Subject digest:
7093c0560dfbc307c009ea194df854cb53fa74db5e7a05b58d53ccffb8ecec6d - Sigstore transparency entry: 2784206927
- Sigstore integration time:
-
Permalink:
PursuitOfDataScience/nodetop@3acebafcc2296028a0726944662b4efa679b8246 -
Branch / Tag:
refs/tags/v0.6.0 - Owner: https://github.com/PursuitOfDataScience
-
Access:
public
-
Token Issuer:
https://token.actions.githubusercontent.com -
Runner Environment:
github-hosted -
Publication workflow:
release.yml@3acebafcc2296028a0726944662b4efa679b8246 -
Trigger Event:
push
-
Statement type:
File details
Details for the file nodetop-0.6.0-py3-none-any.whl.
File metadata
- Download URL: nodetop-0.6.0-py3-none-any.whl
- Upload date:
- Size: 286.6 kB
- Tags: Python 3
- Uploaded using Trusted Publishing? Yes
- Uploaded via:
twine/7.0.0 CPython/3.13.14
File hashes
| Algorithm | Hash digest | |
|---|---|---|
| SHA256 |
487f60e4a08cdb0dd1cb2bfb17abb646ee3228bc91fba0e47abd91a4c249205c
|
|
| MD5 |
69a187e9871943c272ba9808a170f0d2
|
|
| BLAKE2b-256 |
22fb10cc87d3089dcd4029a6f8c4afecb883e55f48481a2db16bcf2fcc330e97
|
Provenance
The following attestation bundles were made for nodetop-0.6.0-py3-none-any.whl:
Publisher:
release.yml on PursuitOfDataScience/nodetop
-
Statement:
-
Statement type:
https://in-toto.io/Statement/v1 -
Predicate type:
https://docs.pypi.org/attestations/publish/v1 -
Subject name:
nodetop-0.6.0-py3-none-any.whl -
Subject digest:
487f60e4a08cdb0dd1cb2bfb17abb646ee3228bc91fba0e47abd91a4c249205c - Sigstore transparency entry: 2784206997
- Sigstore integration time:
-
Permalink:
PursuitOfDataScience/nodetop@3acebafcc2296028a0726944662b4efa679b8246 -
Branch / Tag:
refs/tags/v0.6.0 - Owner: https://github.com/PursuitOfDataScience
-
Access:
public
-
Token Issuer:
https://token.actions.githubusercontent.com -
Runner Environment:
github-hosted -
Publication workflow:
release.yml@3acebafcc2296028a0726944662b4efa679b8246 -
Trigger Event:
push
-
Statement type:














