





NOS-TLPlot is an open-source Python package for visualising Newcastle–Ottawa Scale (NOS) risk-of-bias assessments. It converts NOS star ratings into publication-ready traffic-light plots and 13 specialized visualizations, enabling reviewers and readers to interpret study-level risk-of-bias results clearly and reproducibly.
This is the pip-installable package of NOS-TLPlot — same engine, same plots, installable with a single command.
📃 Software Metapaper (Journal of Open Research Software DOI): 10.5334/jors.635
✨ Key Features
- 13 Visualization Types: Traffic-light plots, radar charts, heatmaps, item heatmaps, stacked star profiles, donut charts, lollipop charts, star matrices, and more
- Publication-Quality Output: Export figures in
.png,.pdf,.svg,.tiffformats - Multiple Themes: Traffic-light, grayscale, ocean-blue, and sage themes for various publication requirements. See the Themes section
- Interactive Web App: Built with Streamlit for simple data upload, preview, and figure export
- Command Line Interface: For batch processing and automated figure generation
- Domain-Specific Risk Assessment: Automatically converts NOS stars (0–9) to categorical RoB (Low/Moderate/High)
- Customizable Output: Adjustable figure sizes, line thickness, and color themes
- Scope-Limited: Designed exclusively for NOS evaluations of non-randomised studies
📥 Installation
Prerequisites
- Requires Python 3.12+ (developed on Python 3.12.3)
pippackage manager
pip install nos-tlplot
To work on the code from a clone instead:
git clone https://github.com/nos-tlplot/NOS-TLPlot-Package.git
cd NOS-TLPlot-Package
pip install -e ".[dev]"
⚡ Usage
1️⃣ Python API
import nos_tlplot

df = nos_tlplot.read_input_file("sample.csv")
df = nos_tlplot.process_detailed_nos(df)

nos_tlplot.plot_nos_visualization(df, "output_nos_plot.png")
nos_tlplot.professional_plot(df, "output.png", theme="gray")
Every plot function takes the processed DataFrame, an output file (.png, .pdf, .svg or .tiff), and an optional theme (traffic_light default, gray, ocean or sage). Pass a list of paths to save the same figure in several formats at once.
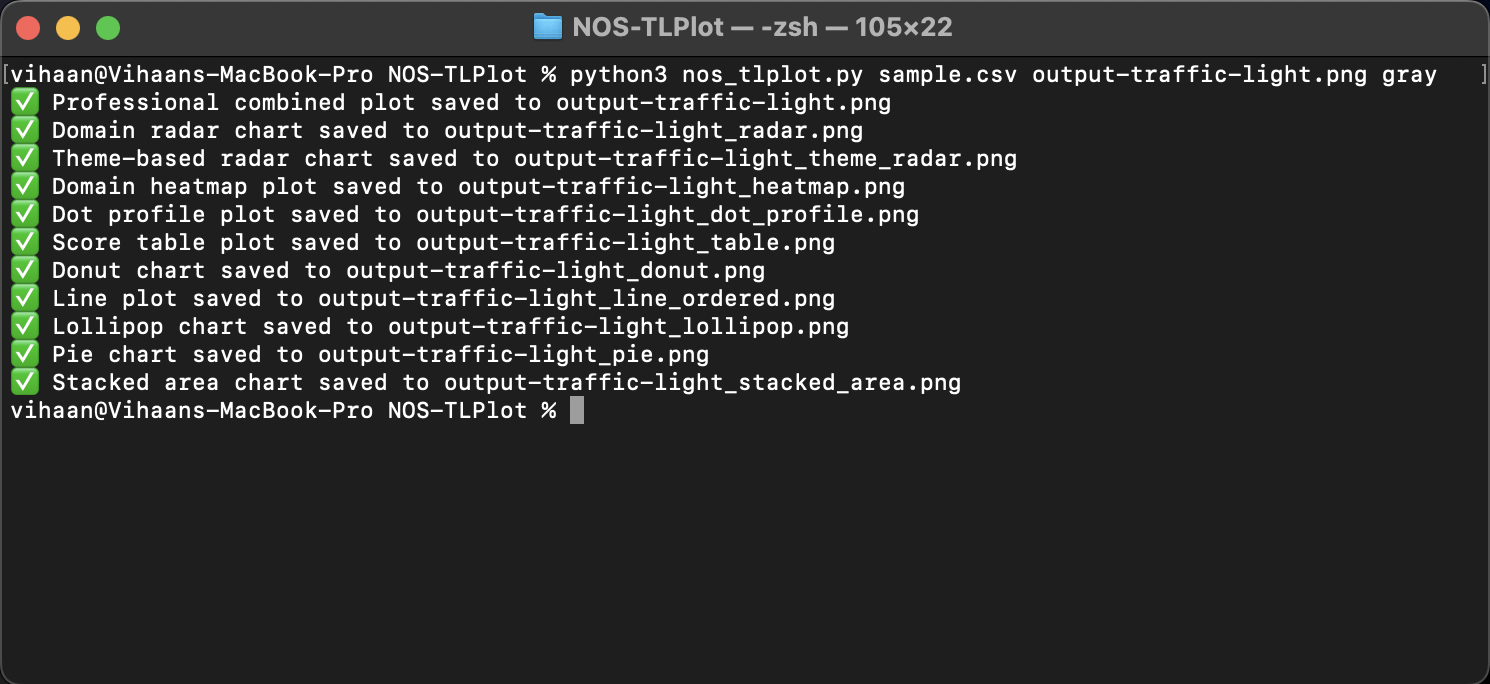
2️⃣ Command Line Interface (For Reviewers to ensure reproducibility and Transparency)
# Basic usage
nos-tlplot sample.csv output.png

# With theme
nos-tlplot sample.csv output-traffic-light.png gray
python -m nos_tlplot sample.csv output.png [theme] works the same way.
This generates the traffic-light plot plus the 12 companion figures (_radar, _theme_radar, _heatmap, _item_heatmap, _dot_profile, _table, _donut, _line_ordered, _lollipop, _pie, _stacked_area, _nos_plot) next to the output file.
Parameters:
| Parameter | Description |
|---|---|
input_file |
Path to CSV/Excel file containing NOS data |
output_file |
Output file name and extension |
theme |
Optional theme: traffic_light (default), gray, ocean or sage |
Generated Outputs:
| File | Description |
|---|---|
_traffic-light.png |
Classic traffic-light bubble plot |
_radar.png |
Radar chart of domain scores |
_heatmap.png |
Color heatmap for domain-level bias |
_item_heatmap.png |
Item-level star heatmap with domain bands |
_dot_profile.png |
Stacked domain stars per study |
_table.png |
Summary table with domain scores |
_donut.png |
Donut chart of overall bias levels |
_line_ordered.png |
Item-level star ratings matrix |
_lollipop.png |
Lollipop chart for comparative bias |
_pie.png |
Proportional risk-of-bias pie |
_stacked_area.png |
Stacked area visualization over domains |
_nos_plot.png |
NOS visualization plot |
3️⃣ Streamlit Web App
The interactive web app lives in the main repository and installs this package as a dependency. You can try it directly at the hosted demo.
Features:
- Upload CSV/Excel files
- Real-time visualization preview
- Choose from 12 plot types
- Download publication-ready figures in multiple formats
- Theme switcher (Traffic-light / Grayscale / Ocean / Sage)
Input Data Format
Your file should have these columns:
| Column Name | Description | Valid Range |
|---|---|---|
Author, Year |
Study identifier | Text |
Representativeness |
Domain 1 | 0–1 |
Non-exposed Selection |
Domain 2 | 0–1 |
Exposure Ascertainment |
Domain 3 | 0–1 |
Outcome Absent at Start |
Domain 4 | 0–1 |
Comparability (Age/Gender) |
Domain 5 | 0–2 |
Comparability (Other) |
Domain 6 | 0–2 |
Outcome Assessment |
Domain 7 | 0–1 |
Follow-up Length |
Domain 8 | 0–1 |
Follow-up Adequacy |
Domain 9 | 0–1 |
Total Score |
Sum of stars | 0–9 |
Overall RoB |
Risk of bias | Low / Moderate / High |
💡 Tip: Always include your raw NOS scoring table in supplementary materials for reproducibility.
🎨 Visualization Types
- Traffic-Light Bubble Plot – Classic NOS traffic-light visualization.
- Domain Radar Chart – Domain scores per study as radar polygons.
- Theme Radar Chart – Theme-adapted radar chart.
- Domain Heatmap – Color heatmap for domain-level bias.
- Item-Level Star Heatmap – Item stars grouped into domain bands.
- Stacked Domain Stars – Stacked domain stars for each study.
- Score Table – Summary table of stars and overall risk.
- Risk Donut Chart – Risk proportions per domain.
- Star Ratings Matrix – Item-level star matrix ordered by total score.
- Total Score Lollipop – Total NOS scores per study.
- Overall Risk Pie – Overall risk-of-bias distribution.
- Stacked Area Risk Chart – Risk distribution across domains.
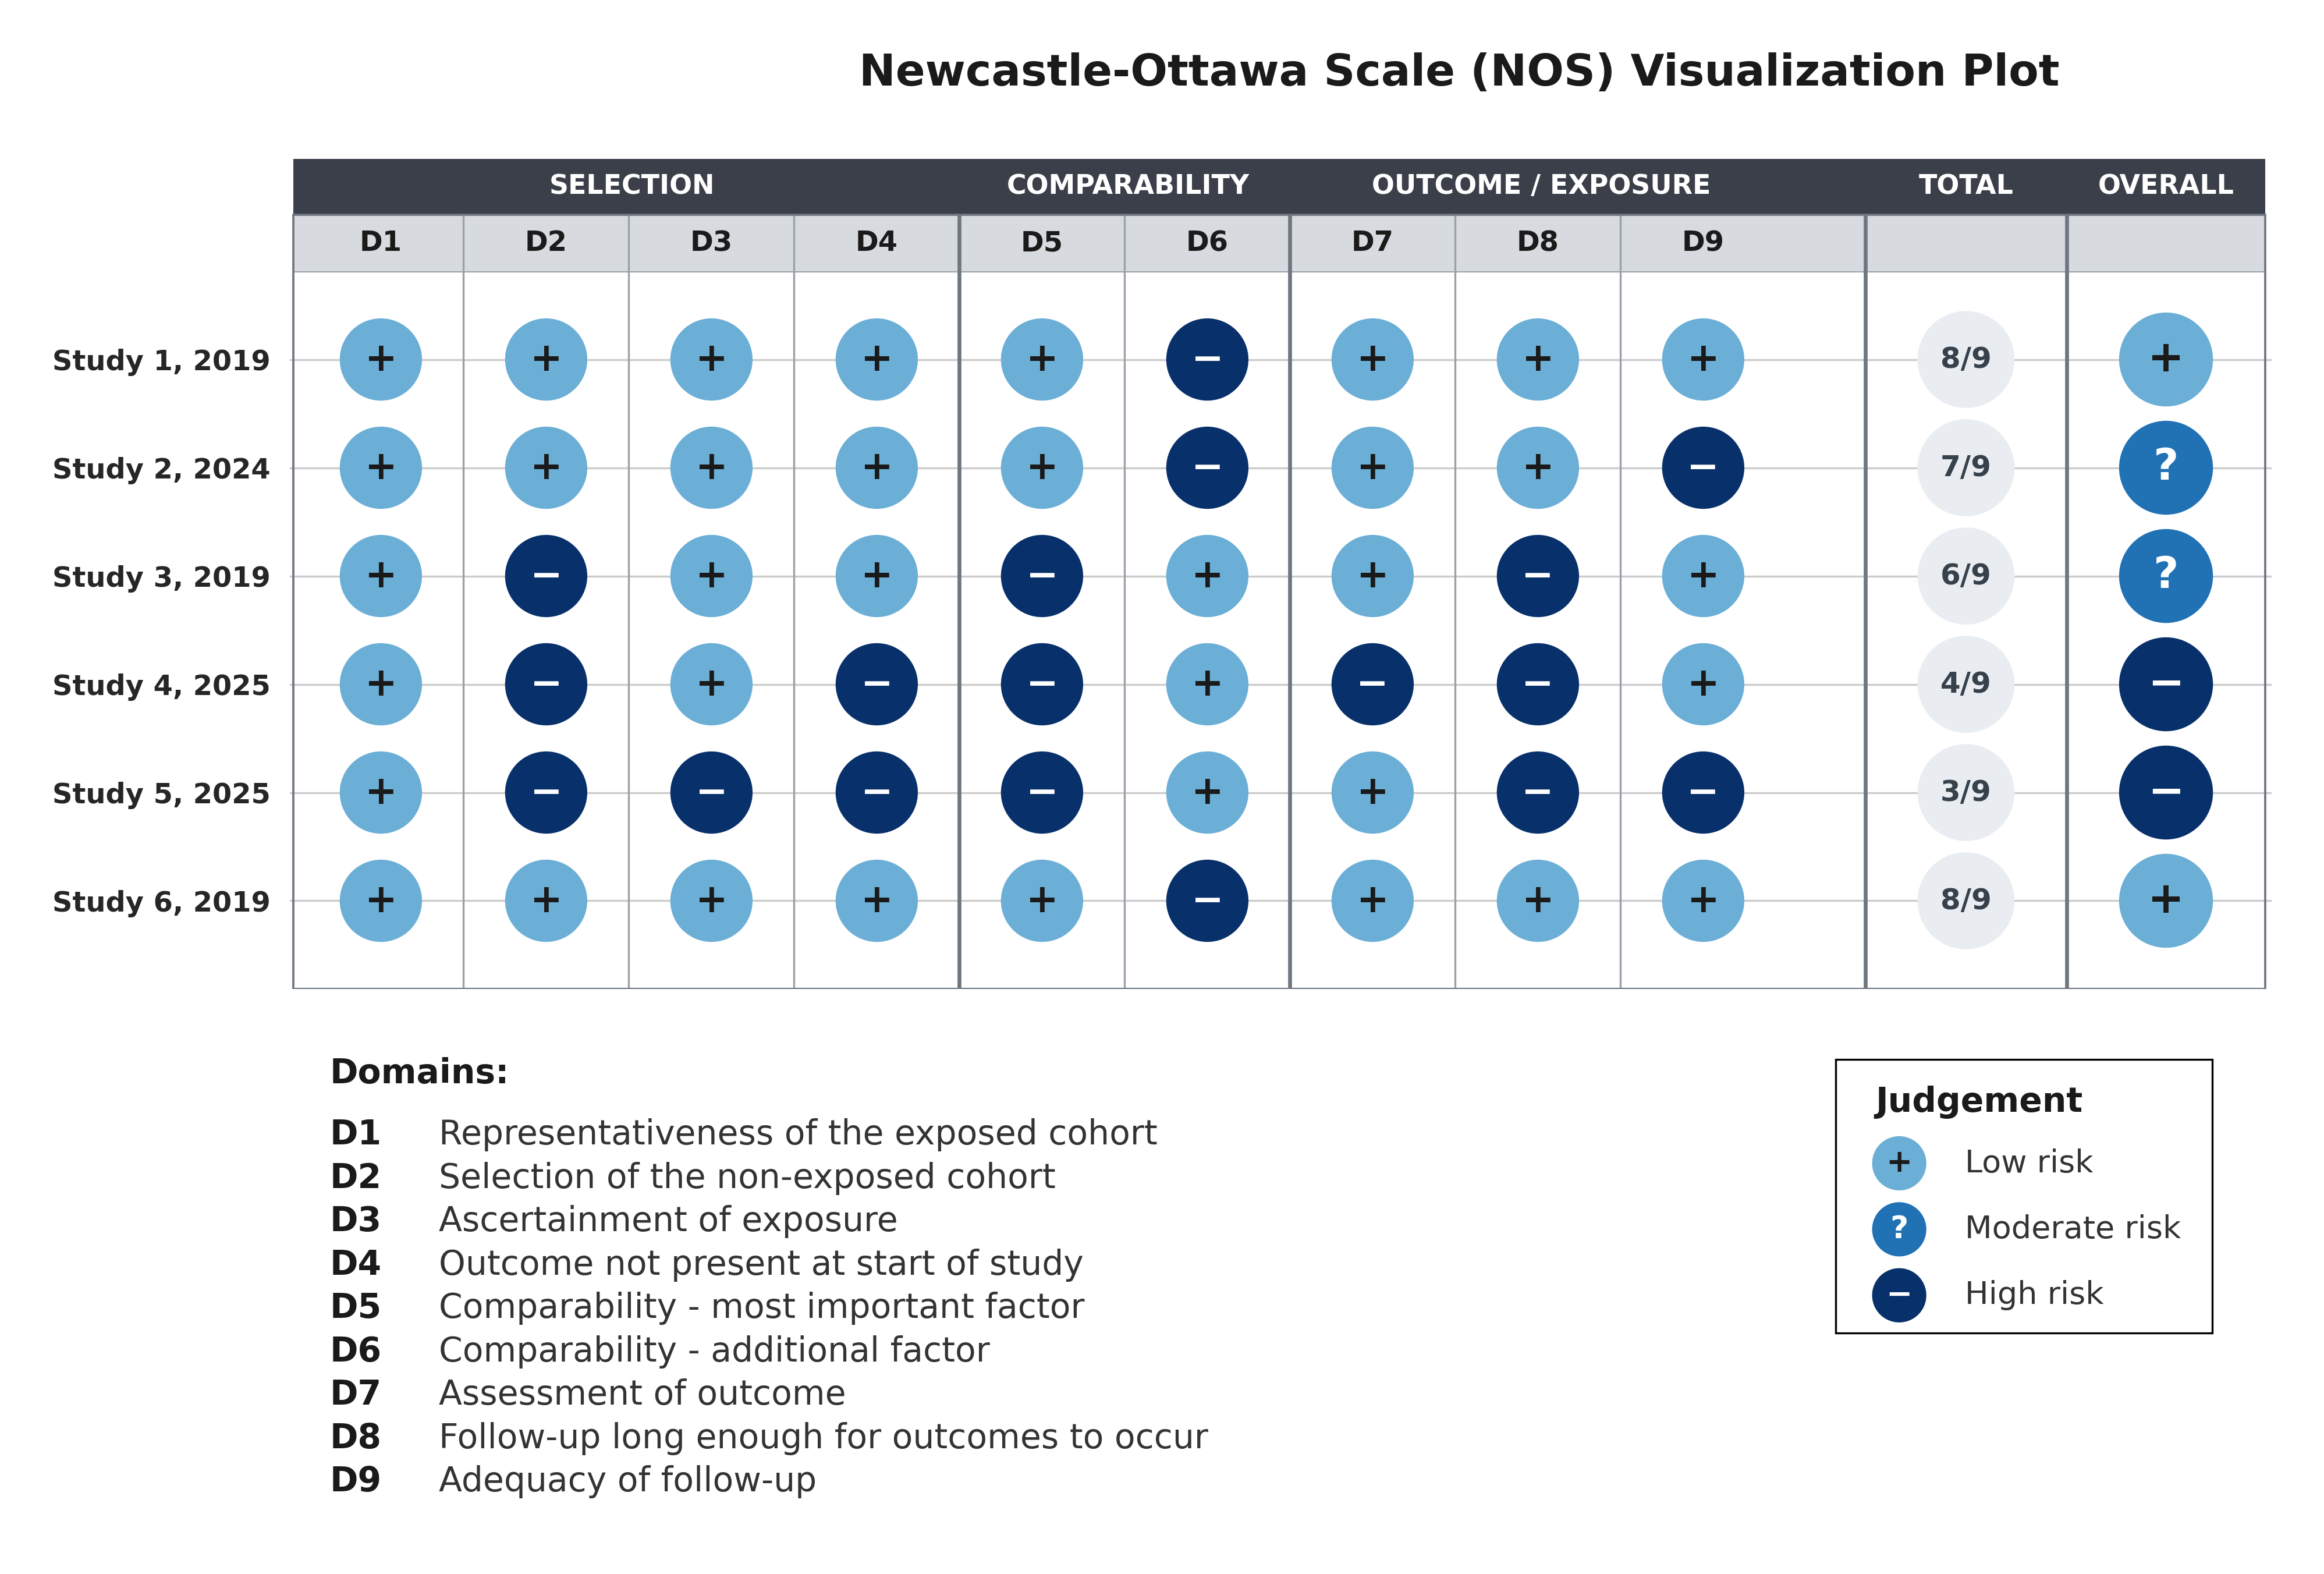
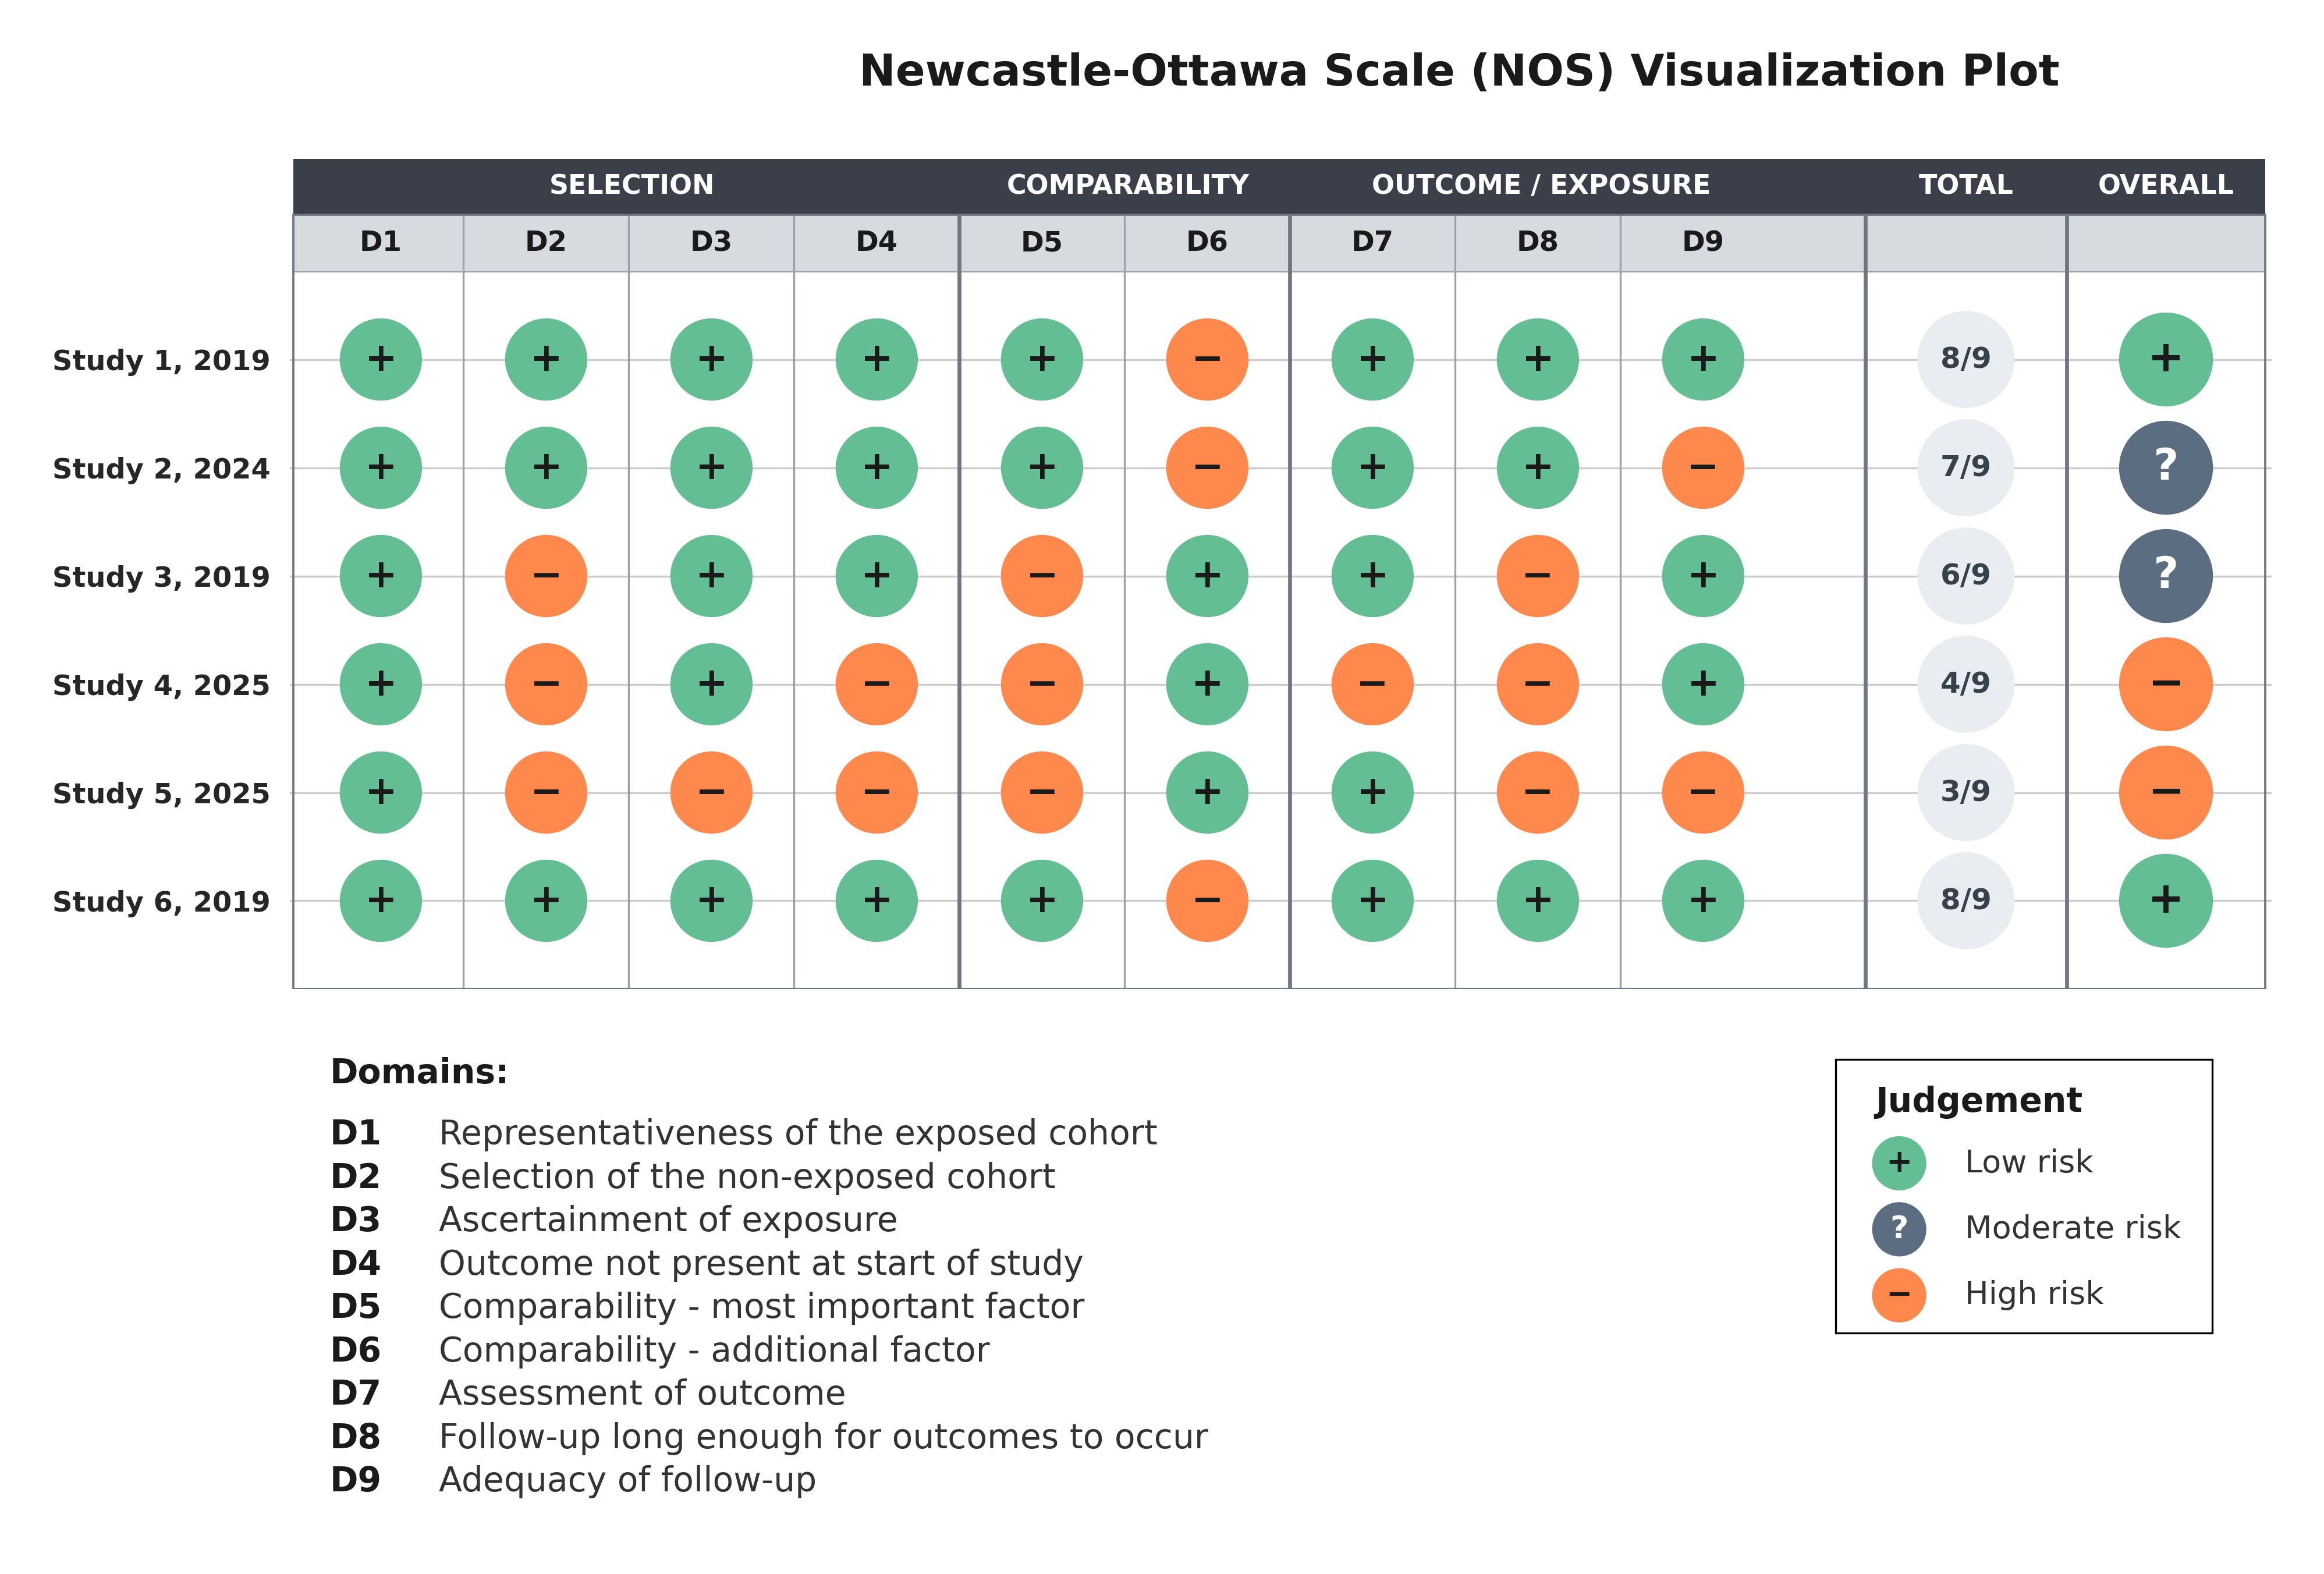
- NOS Visualization Grid – Item-level traffic-light grid with domain bands and totals.
Note: Radar Plots are only limited to 5 studies.
NOS Scoring → Risk-of-Bias Conversion
| Total Stars | Interpretation | Risk Category |
|---|---|---|
| 7–9 | High-quality study | Low RoB |
| 4–6 | Moderate-quality study | Moderate RoB |
| 0–3 | Poor-quality study | High RoB |
Conversion follows Newcastle–Ottawa Scale standards for cohort/case-control/cross-sectional designs.
🔧 Technical Details
- Core Engine:
matplotlib,seaborn,numpy,pandas - Table Rendering:
matplotlib.table - Plot Layout Management:
GridSpec - Color Systems: Custom mcolors, traffic-light mapping
- Data Handling: CSV/Excel file input with automatic parsing
- Batch Plotting: Parallel generation for multiple figure types
- Export Quality: 300 DPI (default), publication-ready vector output
Repository Structure
NOS-TLPlot-Package/
├── nos_tlplot/
│   ├── core.py            # Main plotting engine
│   ├── __init__.py        # Public API
│   └── __main__.py        # python -m nos_tlplot entry point
├── tests/                 # pytest suite
├── sample.csv             # Sample dataset
├── sample.xlsx            # Sample dataset (Excel)
├── pyproject.toml         # Package metadata
├── requirements.txt       # Pinned development environment
├── CITATION.cff           # Citation metadata
├── LICENSE                # Apache 2.0 License
└── README.md              # Project documentation
⭐ Support
- For usage questions, open a Discussion
- For bug reports or feature requests, open an Issue
- Email: mail
Acknowledgment
I sincerely thank the Journal of Open Research Software (JORS) for providing a full publication waiver supporting this software.
🧩 Citation
NOS-TLPlot Python package is cited:
Sahu, V. (2026). NOS-TLPlot: Visualization Tool for Newcastle–Ottawa Scale in Meta-Analysis (v3.0.2) [Python package]. Zenodo. DOI: 10.5281/zenodo.24380517
NOS-TLPlot Software Metapaper is cited: [PREFERRED]
Sahu, V. (2026). NOS-TLPlot: A Specialized Python Tool for Visualizing Newcastle–Ottawa Scale Risk-of-Bias Assessments. Journal of Open Research Software, 14(1), 7. DOI: 10.5334/jors.635
@software{Sahu2026package,
  author = {Sahu, Vihaan},
  title = {NOS-TLPlot: Visualization Tool for Newcastle–Ottawa Scale in Meta-Analysis (v3.0.2)},
  year = {2026},
  doi = {10.5281/zenodo.24380517},
  url = {https://doi.org/10.5281/zenodo.24380517},
  version = {3.0.2}
}

@article{Sahu2026,
  author = {Sahu, Vihaan},
  title = {NOS-TLPlot: A Specialized Python Tool for Visualizing Newcastle–Ottawa Scale Risk-of-Bias Assessments},
  journal = {Journal of Open Research Software},
  volume = {14},
  number = {1},
  pages = {7},
  year = {2026},
  doi = {10.5334/jors.635},
  url = {https://doi.org/10.5334/jors.635}
}
Themes
NOS-TLPlot ships with four colour themes - traffic_light (default), gray, ocean and sage - selectable in the web app or via the optional theme argument on the command line.
| Theme | Low | Moderate | High |
|---|---|---|---|
traffic_light |
#2E7D32 |
#F9A825 |
#C62828 |
gray |
#D6D6D6 |
#9E9E9E |
#3C3C3C |
ocean |
#6BAED6 |
#2171B5 |
#08306B |
sage |
#63BF93 |
#5B6D80 |
#FF884D |
1 maintainer

Metadata
1 maintainer
Release files for nos-tlplot 3.0.2
For a detailed explanation of source distributions (sdists) and built distributions (wheels), please see the package formats documentation.
Source distribution (sdist)
| File | Size | Uploaded | Provenance | Actions |
|---|---|---|---|---|
| nos_tlplot-3.0.2.tar.gz | 34.8 kB | With provenance | Details for nos_tlplot-3.0.2.tar.gz |
Built distribution (wheel)
| File | Interpreter | ABI | Platform | Actions Reset |
|---|---|---|---|---|
| nos_tlplot-3.0.2-py3-none-any.whl | Python 3 | none | any | Details for nos_tlplot-3.0.2-py3-none-any.whl |
Total release size: 57.2 kB
Release files / nos_tlplot-3.0.2.tar.gz
| Download URL | nos_tlplot-3.0.2.tar.gz |
|---|---|
| Size | 34.8 kB |
| Tags | Source |
|
SHA-256 checksum How to use checksums |
fb0d83292886c8b6bbe5ebfce95f4ad9e2ea55c20666f41a11e17de340b41560
|
|
BLAKE2b-256 checksum How to use checksums |
7373840d2353ed2f2f231bf4730dc5f60e2de4a7bbcfb539b86afc21665a9762
|
| Upload date | |
|
Uploaded using Trusted Publishing? What is trusted publishing? |
Yes |
| Uploaded via |
twine/7.0.0 CPython/3.13.16
|
Provenance
Provenance describes where a file came from. On PyPI, provenance is shared via attestations, which provide a verifiable record of the build or publishing details. View details, limitations and caveats.


PyPI Publish Attestation
PyPI verified that this artifact, at this checksum, originated from the publisher listed below.
Signed by GitHub Actions, verified by PyPI on Nov 19, 2026.
Transparency logRelease files / nos_tlplot-3.0.2-py3-none-any.whl
| Download URL | nos_tlplot-3.0.2-py3-none-any.whl |
|---|---|
| Size | 22.4 kB |
| Tags | Python 3 |
|
SHA-256 checksum How to use checksums |
5548663c4554131aa8d7ccd76c24e6e6111973c6dc61f651e509e677eb9ff1f6
|
|
BLAKE2b-256 checksum How to use checksums |
b7bb5661f0d609e17bbc7d86a2911b83419728694e77504ae0df6b23ca1525c4
|
| Upload date | |
|
Uploaded using Trusted Publishing? What is trusted publishing? |
Yes |
| Uploaded via |
twine/7.0.0 CPython/3.13.16
|
Provenance
Provenance describes where a file came from. On PyPI, provenance is shared via attestations, which provide a verifiable record of the build or publishing details. View details, limitations and caveats.
PyPI Publish Attestation
PyPI verified that this artifact, at this checksum, originated from the publisher listed below.
Signed by GitHub Actions, verified by PyPI on Nov 19, 2026.
Transparency logSecurity for nos-tlplot 3.0.2
Provenance
Provenance describes where a file came from. On PyPI, provenance is shared via attestations, which provide a verifiable record of the build or publishing details. View details, limitations and caveats.
Full provenance
Both files in this release have been uploaded with provenance metadata.
Attestation for nos_tlplot-3.0.2.tar.gz
PyPI Publish Attestation
PyPI verified that this artifact, at this checksum, originated from the publisher listed below.
Signed by GitHub Actions, verified by PyPI on Nov 19, 2026.
Transparency logA note on package security
PyPI is a repository for distributing packages, not a service for auditing them. While third-party security researchers and our staff do their best to detect and remove malicious packages, PyPI cannot guarantee the quality, security or suitability of any given package.
To learn more about protecting yourself from malicious actors, visit our package security documentation.














