


notecharts brings modern, interactive charts to Jupyter notebooks. Apache ECharts has some of the best charting APIs out there. notecharts just makes it work in Jupyter.
Why notecharts?
If you've done data visualization in Python before, you've likely encountered these standard tools:
- matplotlib: Excellent for publication-quality static charts, but lacks out-of-the-box interactivity.
- plotly.py: Great for interactive charts, but can require extensive configuration to achieve a polished, modern aesthetic or smooth animations.
Apache ECharts is an incredibly powerful web plotting library. While there have been previous attempts to bring it to Jupyter, they often come with trade-offs:
- pyecharts: Powerful, but introduces a deep "Pythonic" abstraction. This deviates from the official ECharts API, making it difficult to translate JavaScript examples from the docs into Python.
- ipecharts: Provides widget integration, but can have inconsistent interactivity and currently lacks support for environments like Google Colab.
notecharts provides a thin layer that allows you to write ECharts options exactly as they appear in the official docs, while handling the heavy lifting of library loading, font injection, dynamic palettes, and serialization.
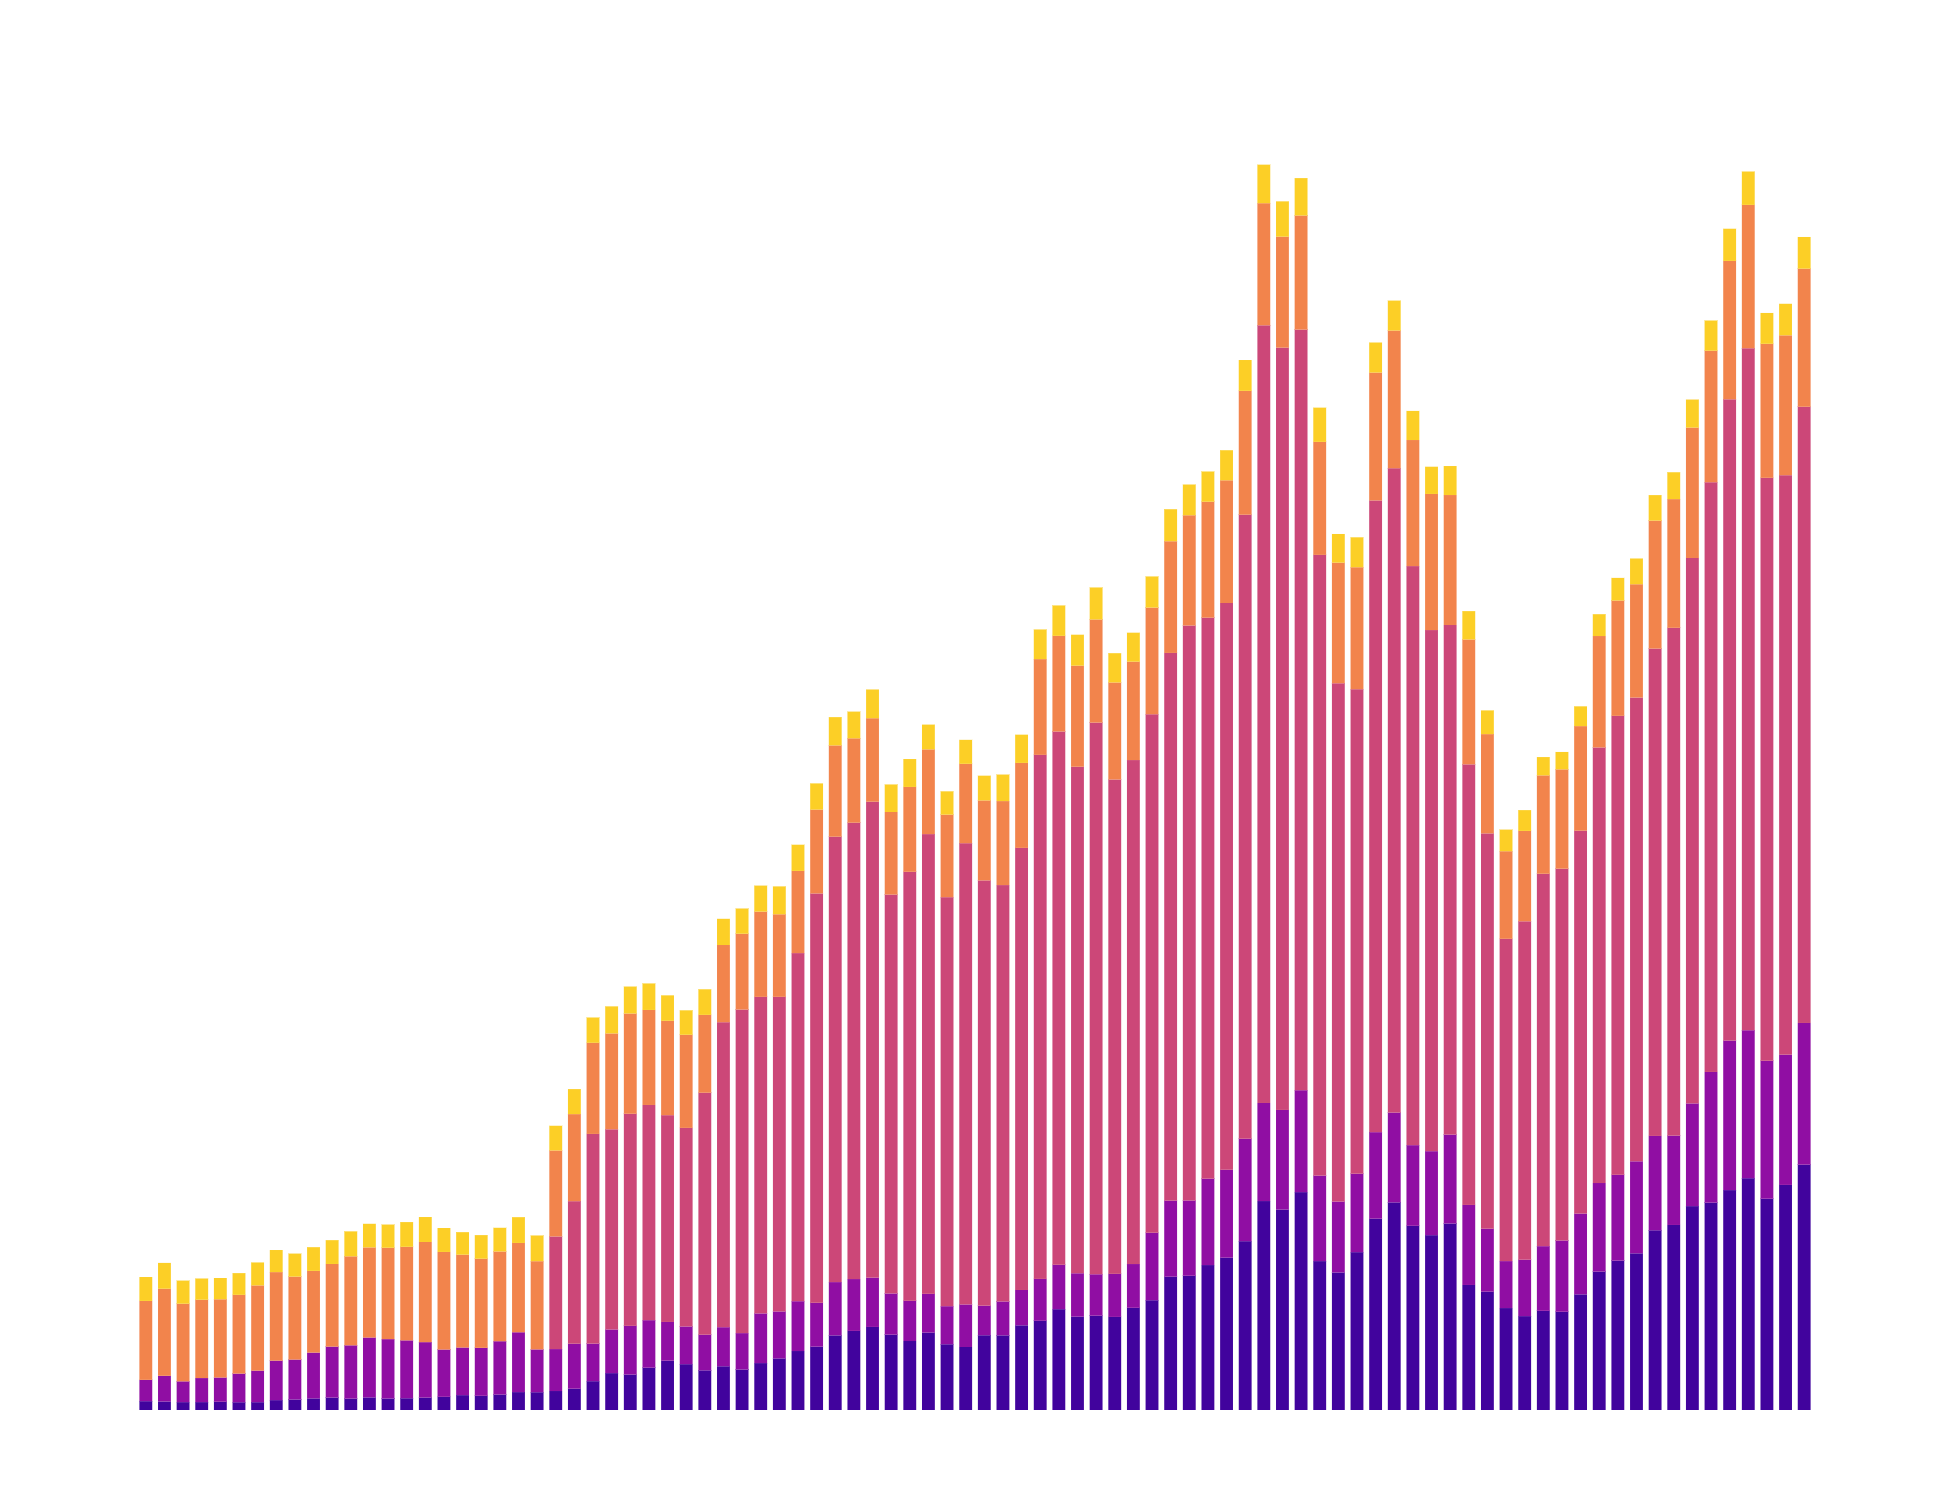
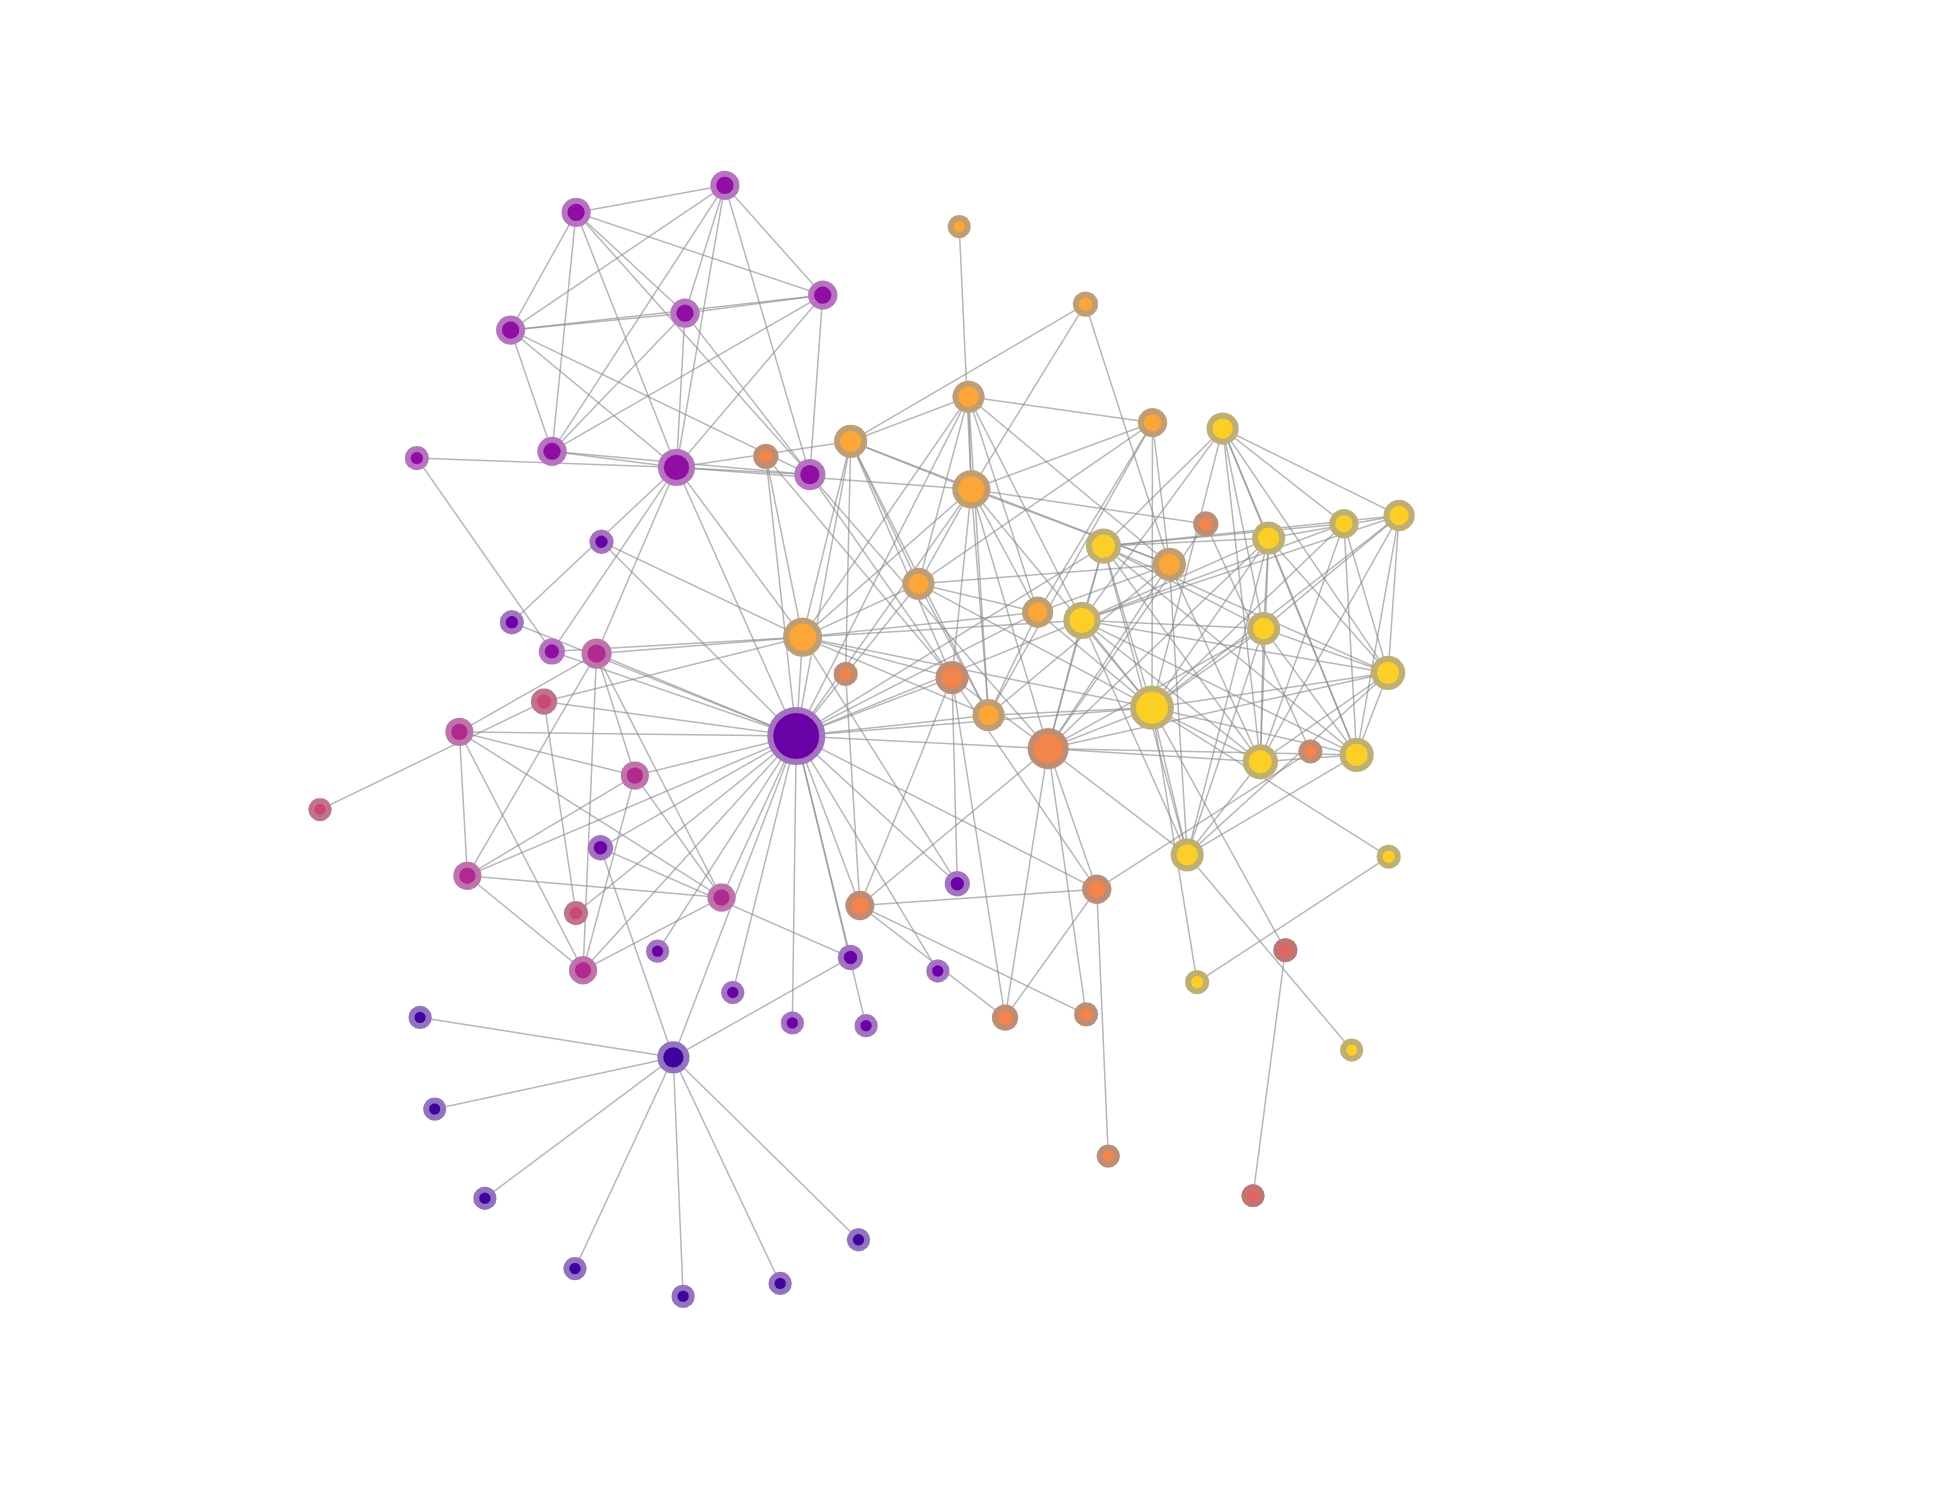
| Stacked Bar | Force Directed Graph |
|---|---|
 |
 |
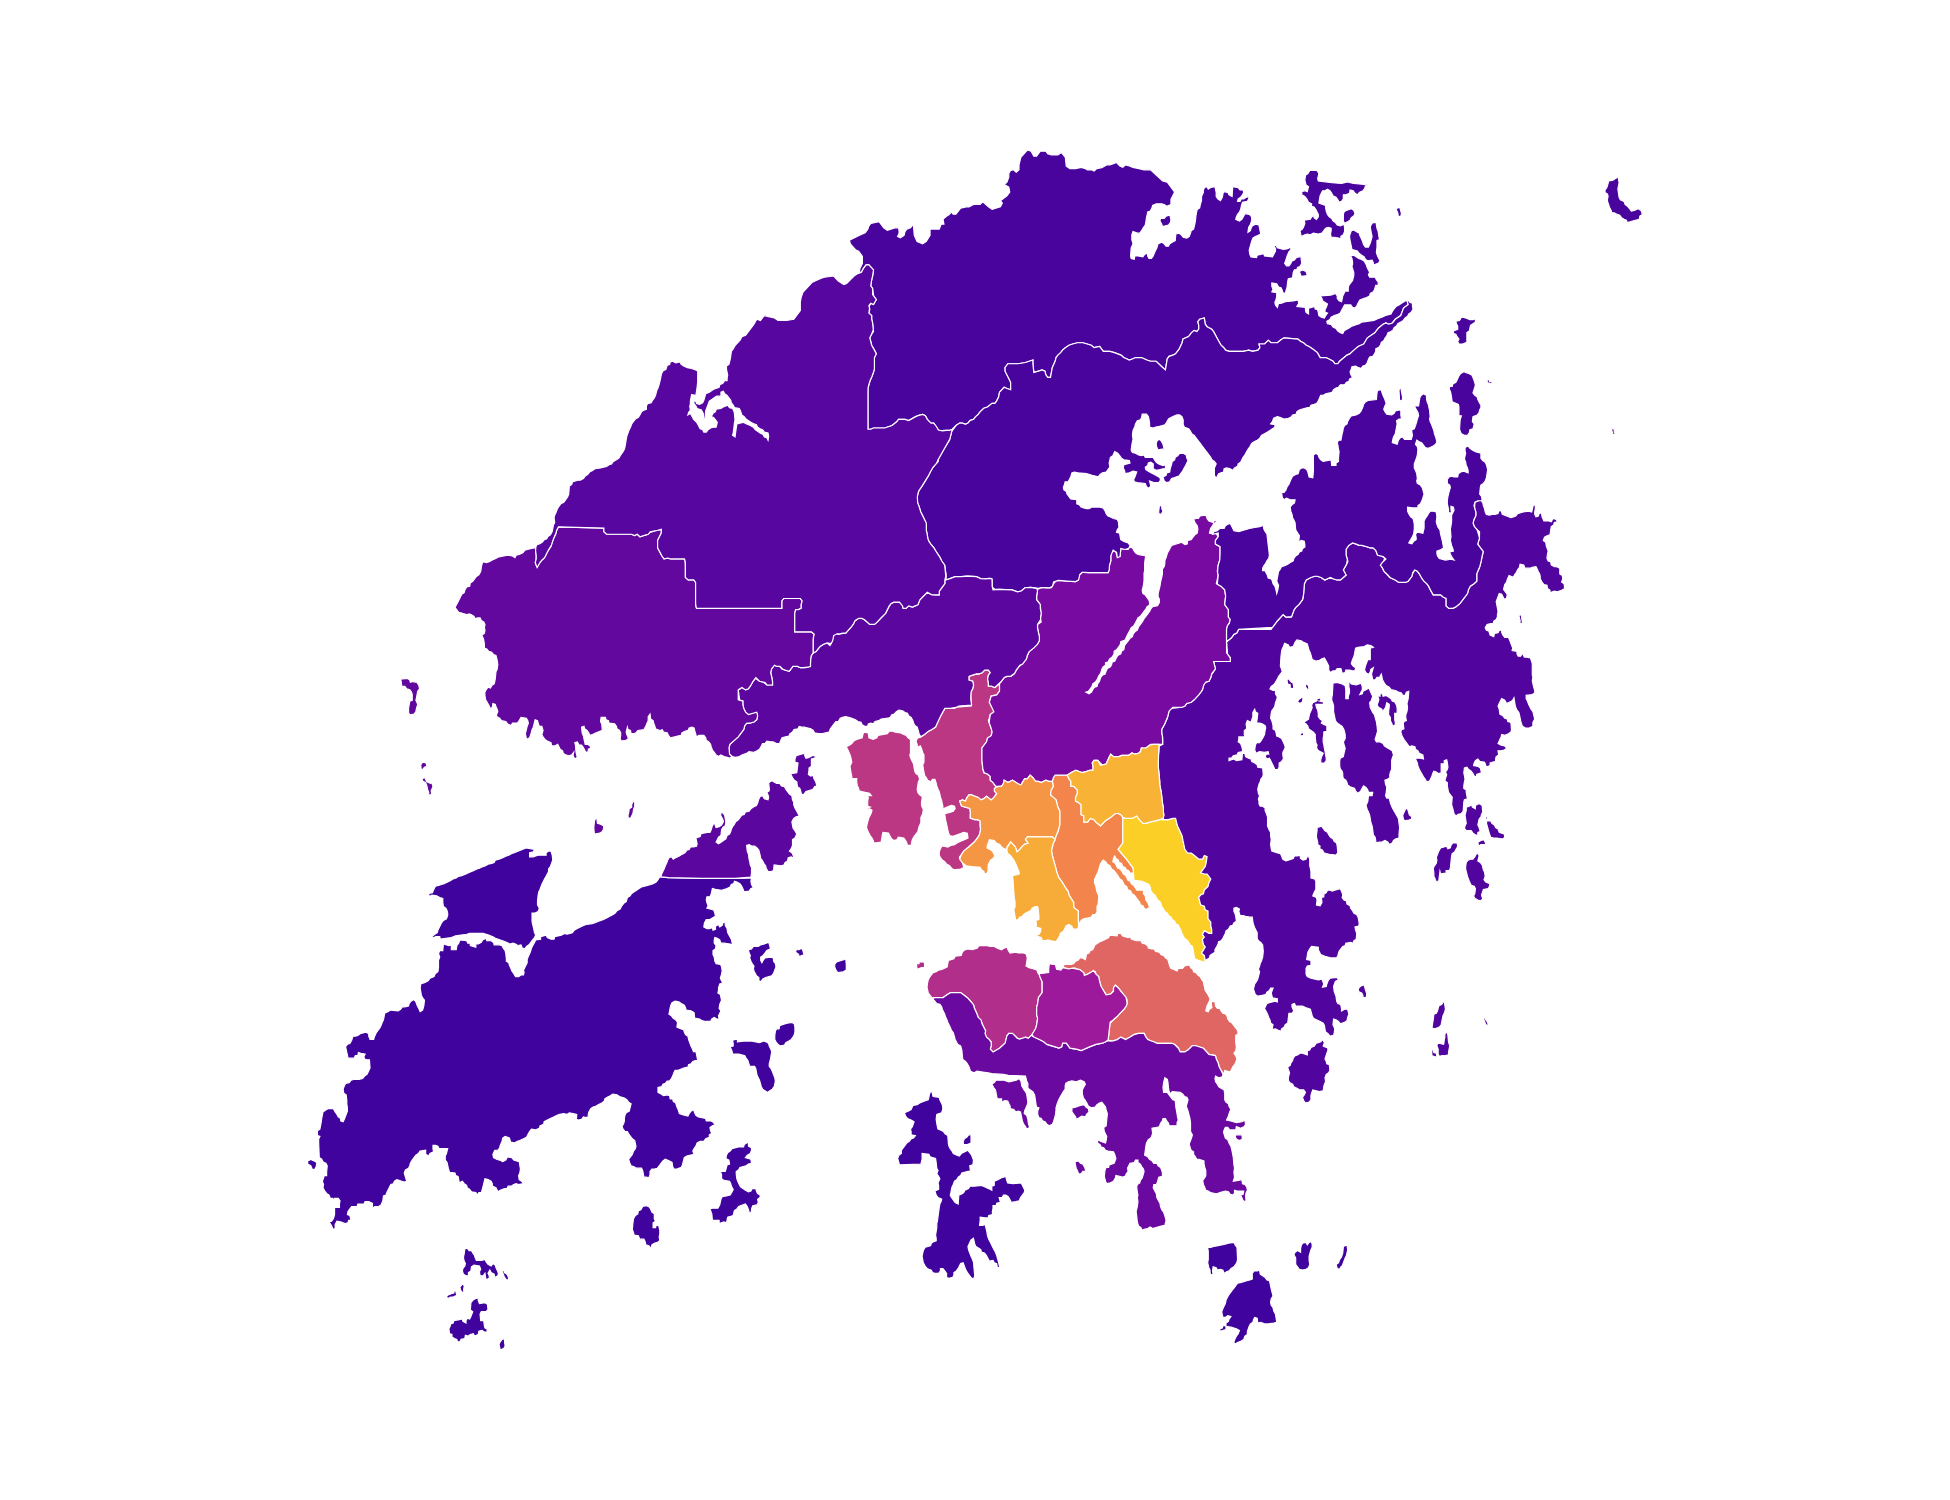
| Geo/Map | 3D Scatter |
 |
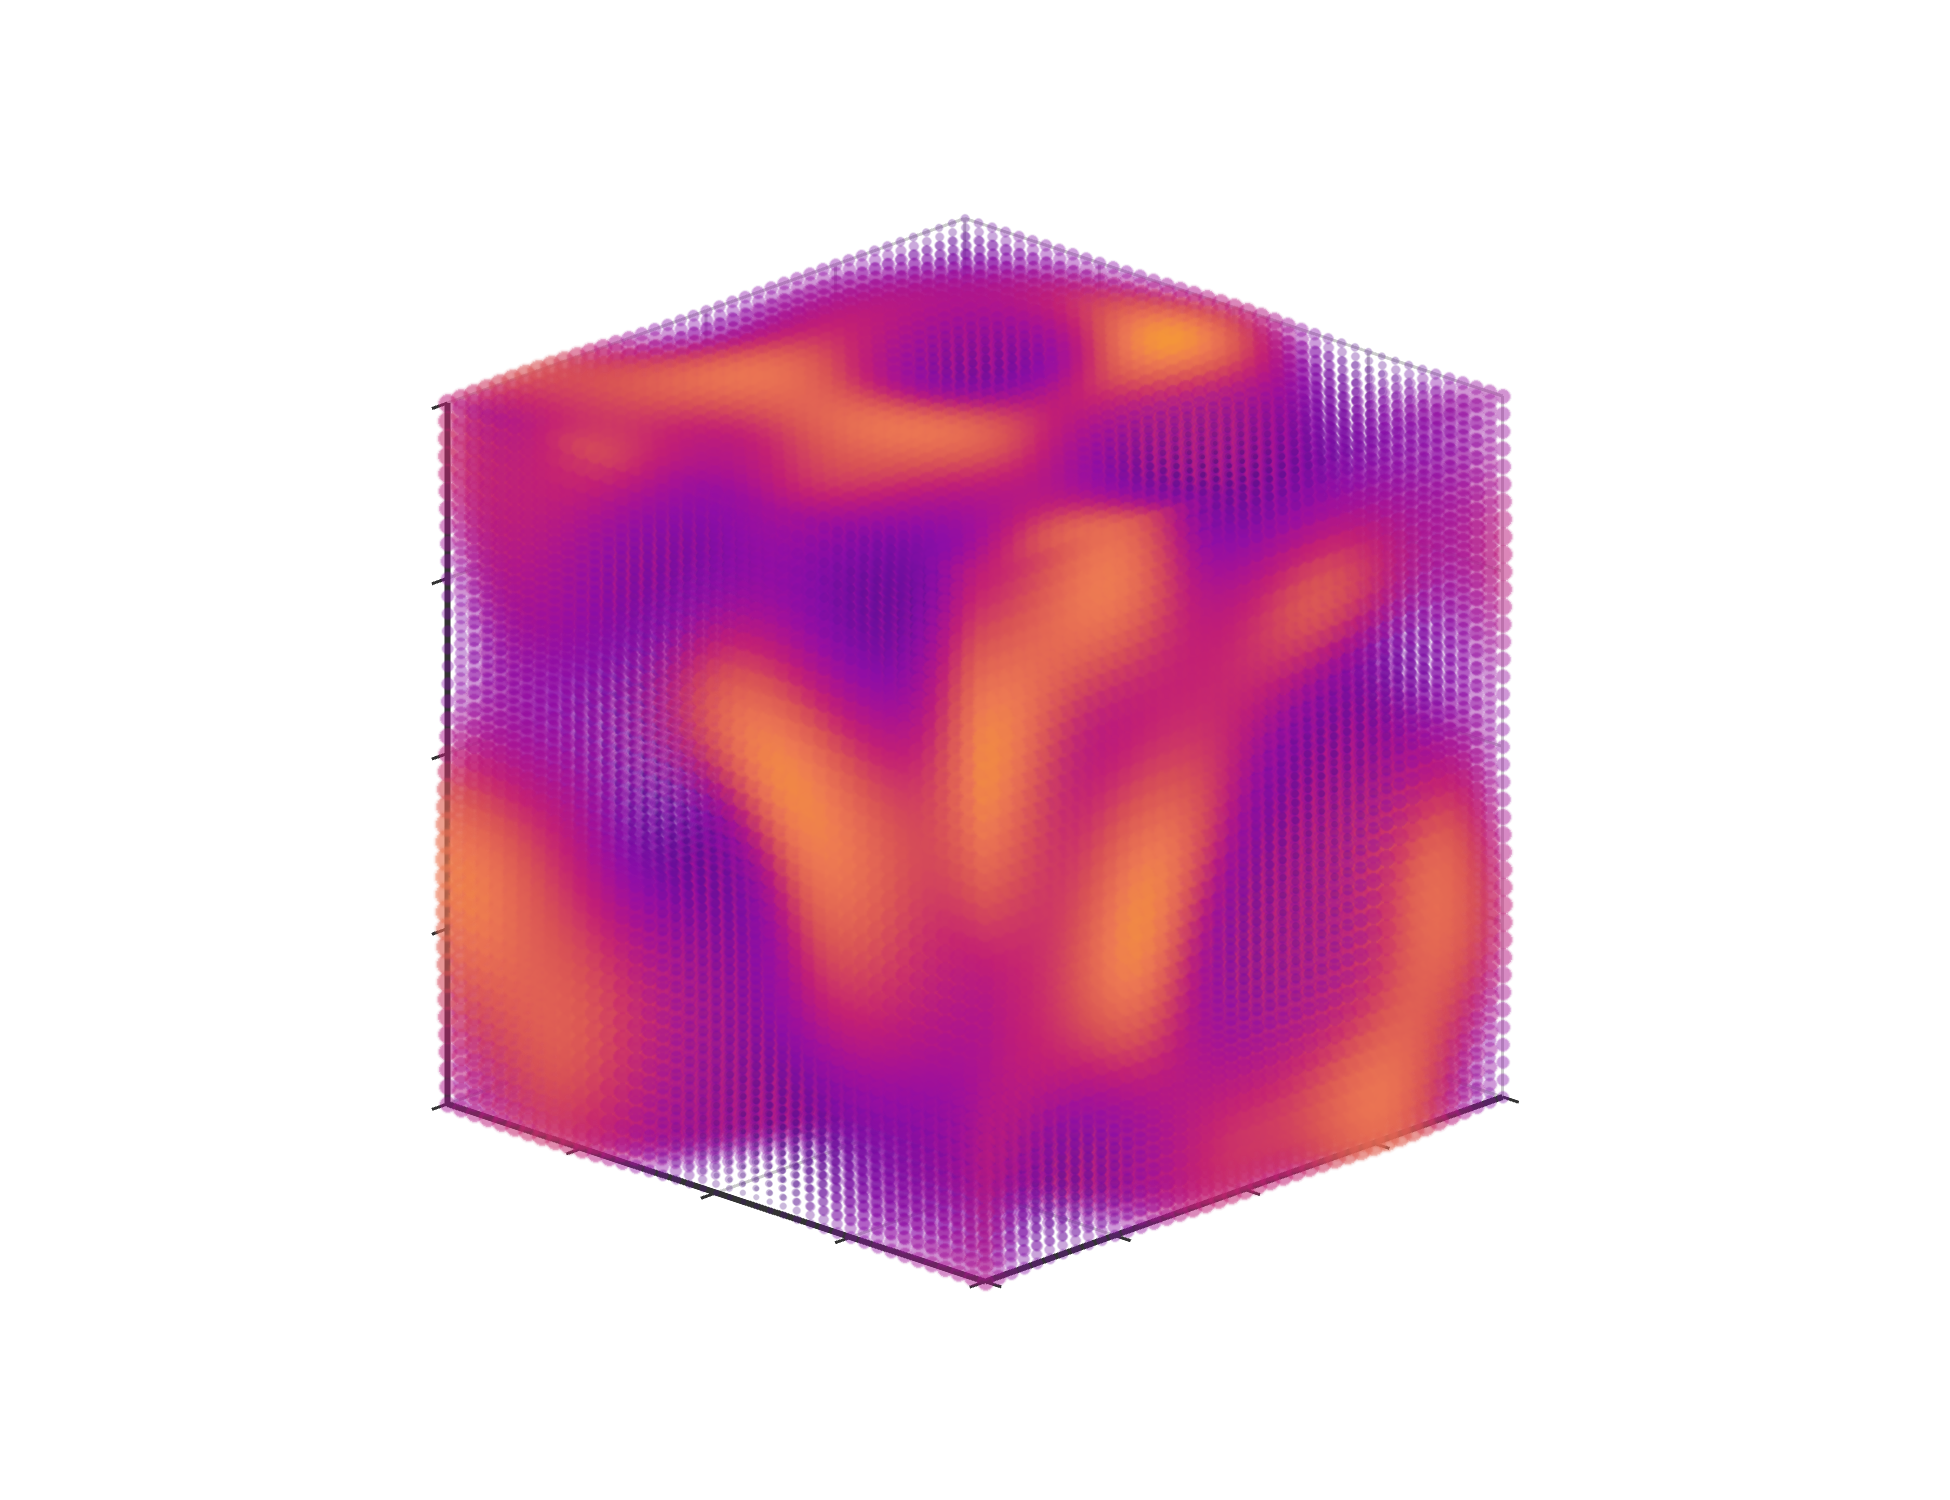 |
Click the images above to view how to make them.
Key Features
- Declarative API: Pass a dictionary, get a chart. No complex class hierarchies to learn.
- Rich Color Palettes: Browse 185 professionally-designed customizable color palettes from Palettable, or make your own palettes from scratch.
- JavaScript Support: Inject raw JavaScript functions using
JSCodefor formatters, tooltips, and custom processing logic. - Code Completion: Declare the type of the config dict as
Optionfor hinting and auto-complete. - Font Injection: Automatically detect font declarations in your config, fetch the corresponding fonts (if available) from Google Fonts.
- Templates: Includes pre-built primitives like
Bar,Line,Scatter,RadarandPiewith beautiful defaults. - Environment Agnostic: Works seamlessly in VS Code and Google Colab.
- Compression: Compresses the data and config objects so the notebook doesn't balloon in size.
Installation
pip install notecharts
Usage
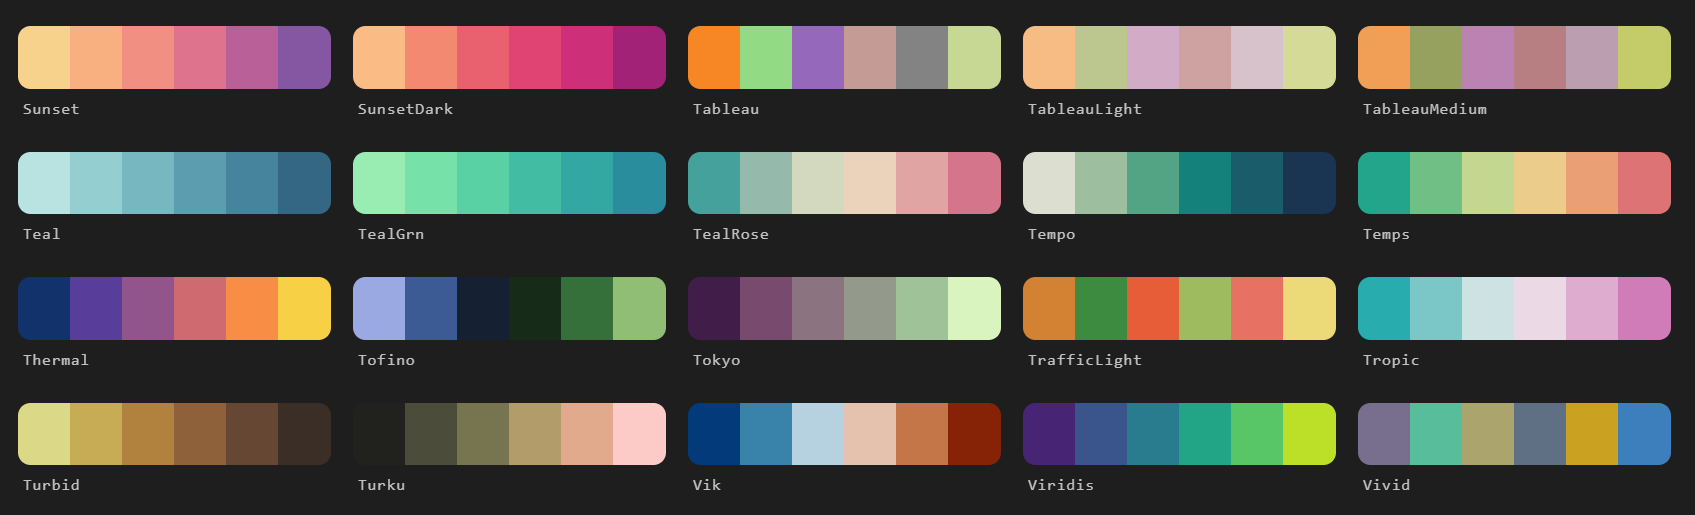
Palette Browser
Use the built-in PaletteBrowser to explore available palettes, or visualize custom palettes.
from notecharts import PaletteBrowser

PaletteBrowser(n=6)
Templates
Use the pre-configured templates for common visualizations, and optionally override any default styling of the class.
from notecharts import Line

Line(
    x=["Mon", "Tue", "Wed", "Thu", "Fri"],
    y={
        "Product A": [120, 200, 150, 220, 280],
        "Product B": [180, 160, 200, 240, 290],
        "Product C": [160, 120, 140, 190, 250]
    },
    title="Weekly Sales",
    palette="Spectral",
    theme="dark",
    width="650px",
    font="Elms Sans",
    options= {
        "legend": {"itemGap": 25} # Override class defaults
    }
).display()
With DataFrames
All pre-built charts support direct DataFrame integration:
import pandas as pd
import random
from notecharts import Radar

random.seed()

df = pd.DataFrame({
    "Category": ["Primary", "Secondary", "Tertiary", "Quaternary"],
    "Equipment": [random.randint(4000, 6000) for _ in range(4)],
    "Materials": [random.randint(10000, 16000) for _ in range(4)],
    "Food & Beverage": [random.randint(10000, 30000) for _ in range(4)],
    "Apparel": [random.randint(10000, 40000) for _ in range(4)],
    "Tourism": [random.randint(10000, 50000) for _ in range(4)],
    "Technology": [random.randint(5000, 15000) for _ in range(4)],
})

Radar(
    data=df,
    series_col="Category",
    title="Radar",
    theme="dark",
    palette={
        "palette": "agSunset",
        "value": "+0.5"         # Offset-based modifications to palette
    },
    width="600px",
    font="Poppins",
).display()
Full Control
Complete control over every aspect of the chart, through a beautiful, declarative API. If you can find an example on the ECharts Gallery, you can run it in notecharts.
from notecharts import Chart, JSCode, Palette, Option

options: Option = {
    "title": {"text": "Bar Chart"},
    "textStyle": {"fontFamily": "Josefin Sans"},    # Automatically loaded from Google Fonts
    "xAxis": {"type": "category"},
    "yAxis": {
        "axisLabel": {
            "formatter": JSCode("function(v) { return '$' + v.toLocaleString(); }")
        }
    },
    "tooltip": {
        "trigger": "axis"
    },
    "legend": {},
    "dataset": {
        "source": [
            ["Product", "Sales", "Expenses", "Profit"],
            ["Mon", 120, 80, 40],
            ["Tue", 150, 100, 50],
            ["Wed", 200, 120, 80],
            ["Thurs", 180, 110, 70],
            ["Fri", 220, 140, 80],
        ]
    },

    "series": [
        {"name": "Sales", "type": "bar"},
        {"name": "Expenses", "type": "bar"},
        {"name": "Profit", "type": "bar"}
    ],
    "color": Palette("Bamako", 3)   # Load n colors from any palette,
                                    # or create your own palette through interpolation,
                                    # like Palette(["#003566", "#ffc300"], 5)
}

Chart(options, width="700px").display()
Notes
- Name: Pronounced note-charts or not-echarts.
- Security: Use of
JSCodeallows for arbitrary JavaScript execution in the browser/notebook context. Always ensure you are passing trusted code and data to your charts. - Connectivity: This library is lightweight because it fetches the ECharts, ECharts-GL and fflate (for data decompression) minified code from
cdn.jsdelivr.netat runtime, so an active internet connection is required to render charts for the first time. These are then cached in the browser/IDE context and subsequent renders can work offline.
License & Attribution
- notecharts is licensed under the MIT License.
- Apache ECharts: This library is a wrapper for Apache ECharts which is licensed under the Apache License 2.0.
- Apache ECharts, ECharts, Apache, the Apache feather, and the Apache ECharts project logo are either registered trademarks or trademarks of the Apache Software Foundation.
- Part of the
project.
Links
1 maintainer

Metadata
1 maintainer
Release files for notecharts 0.5.1
For a detailed explanation of source distributions (sdists) and built distributions (wheels), please see the package formats documentation.
Source distribution (sdist)
| File | Size | Uploaded | |
|---|---|---|---|
| notecharts-0.5.1.tar.gz | 46.1 kB | Details |
Built distribution (wheel)
| File | Interpreter | ABI | Platform | Reset |
|---|---|---|---|---|
| notecharts-0.5.1-py3-none-any.whl | Python 3 | none | any | Details |
Total release size: 95.7 kB
Release files / notecharts-0.5.1.tar.gz
| Download URL | notecharts-0.5.1.tar.gz |
|---|---|
| Size | 46.1 kB |
| Tags | Source |
|
SHA-256 checksum How to use checksums |
170cc52309d2dc92c9be7f3dc3c309094d8e991c63f520099579f9c54c4d050d
|
|
BLAKE2b-256 checksum How to use checksums |
ac6f05f013bdfc2e458e9a03f9c65cfe8c7bca44c74e8a64707bd05528a56a17
|
| Upload date | |
|
Uploaded using Trusted Publishing? What is trusted publishing? |
No |
| Uploaded via |
twine/6.2.0 CPython/3.12.13
|
Release files / notecharts-0.5.1-py3-none-any.whl
| Download URL | notecharts-0.5.1-py3-none-any.whl |
|---|---|
| Size | 49.6 kB |
| Tags | Python 3 |
|
SHA-256 checksum How to use checksums |
249ee30fe365dcafcd2f80f92711caa480416c0cafd2c2a6754ef4c6147d7672
|
|
BLAKE2b-256 checksum How to use checksums |
30e8a9f56b3be4e2d5f06083a3ad774affb4bf1561a81bc779c82683468fb58c
|
| Upload date | |
|
Uploaded using Trusted Publishing? What is trusted publishing? |
No |
| Uploaded via |
twine/6.2.0 CPython/3.12.13
|














