
AI-powered data visualization — describe what you want, get production charts. Data stays local.

Project description

NVEIL Toolkit
Describe your data. Get production charts. Your data stays local.




Quickstart • API Reference • Examples • Changelog
NVEIL is an AI-powered data visualization toolkit. Write one line of natural language, and NVEIL processes your data and generates publication-ready visualizations — no chart code, no hallucinations, no data leaving your machine.
import nveil

nveil.configure(api_key="nveil_...")

# Pass a file path directly — no DataFrame loading required.
spec = nveil.generate_spec("Revenue by region, colored by quarter", "sales.csv")

fig = spec.render("sales.csv")   # 100% local — no API call
nveil.show(fig)                   # opens in browser
From your shell
After pip install nveil the nveil command is on your $PATH:
export NVEIL_API_KEY=nveil_...

# Ground yourself on the dataset (shape / dtypes / head preview)
nveil describe sales.csv

# Generate HTML + PNG + a reusable .nveil spec, print the explanation
nveil generate "Revenue by region, colored by quarter" \
  --data sales.csv --format all --explain

# Re-render an existing spec on fresh data — no API call
nveil render chart.nveil --data new_sales.csv
For AI agents (Claude Code / Claude Desktop / Cursor / Codex / …)
NVEIL ships first-class integrations:
# Claude Code / Claude Desktop — install the bundled skill
nveil install-skill

# Claude Desktop, Cursor, any MCP client — add an MCP server:
# {"mcpServers": {"nveil": {"command": "nveil", "args": ["mcp"]}}}
nveil mcp                    # stdio server; launched by the MCP client
Why NVEIL?
| Capability | NVEIL | Chatbot data analysis¹ | LLM-to-viz libraries² | Traditional plotting³ |
|---|---|---|---|---|
| Natural-language input | ✓ | ✓ | ✓ | ✗ |
| Raw data stays on your machine | ✓ | ✗ | ✗ | ✓ |
| Only schema + stats sent to server | ✓ | ✗ | ✗ | N/A |
| Deterministic, reproducible output | ✓ | ✗ | ✗ | ✓ |
| Offline re-rendering, zero API calls | ✓ | ✗ | ✗ | ✓ |
Portable saved specs (.nveil files) |
✓ | ✗ | ✗ | ✗ |
| 2D + 3D + geospatial + scientific | ✓ | 2D | 2D | varies |
| Multi-backend (Plotly, VTK, DeckGL) | ✓ | ✗ | ✗ | ✗ |
| Data processing engine | ✓ | ✓ | partial | ✗ |
¹ ChatGPT Advanced Data Analysis, Claude Analysis tool, Gemini Data Agent · ² PandasAI, LIDA, Julius, Vanna · ³ Plotly, Matplotlib, Seaborn
How It Works
Your Data ──> Toolkit ──metadata only──> NVEIL AI ──> Processing Plan ──> Local Execution ──> Result
               ^                                                           ^
          raw data stays here                                     raw data stays here
- You describe what you want in plain language
- NVEIL AI plans the data processing and visualization (only metadata is sent — column names, types, statistics)
- The Toolkit executes locally — joins, aggregations, pivots, rendering — all on your machine
- You get a figure — Plotly, VTK, or DeckGL, auto-selected for your data
Key Features
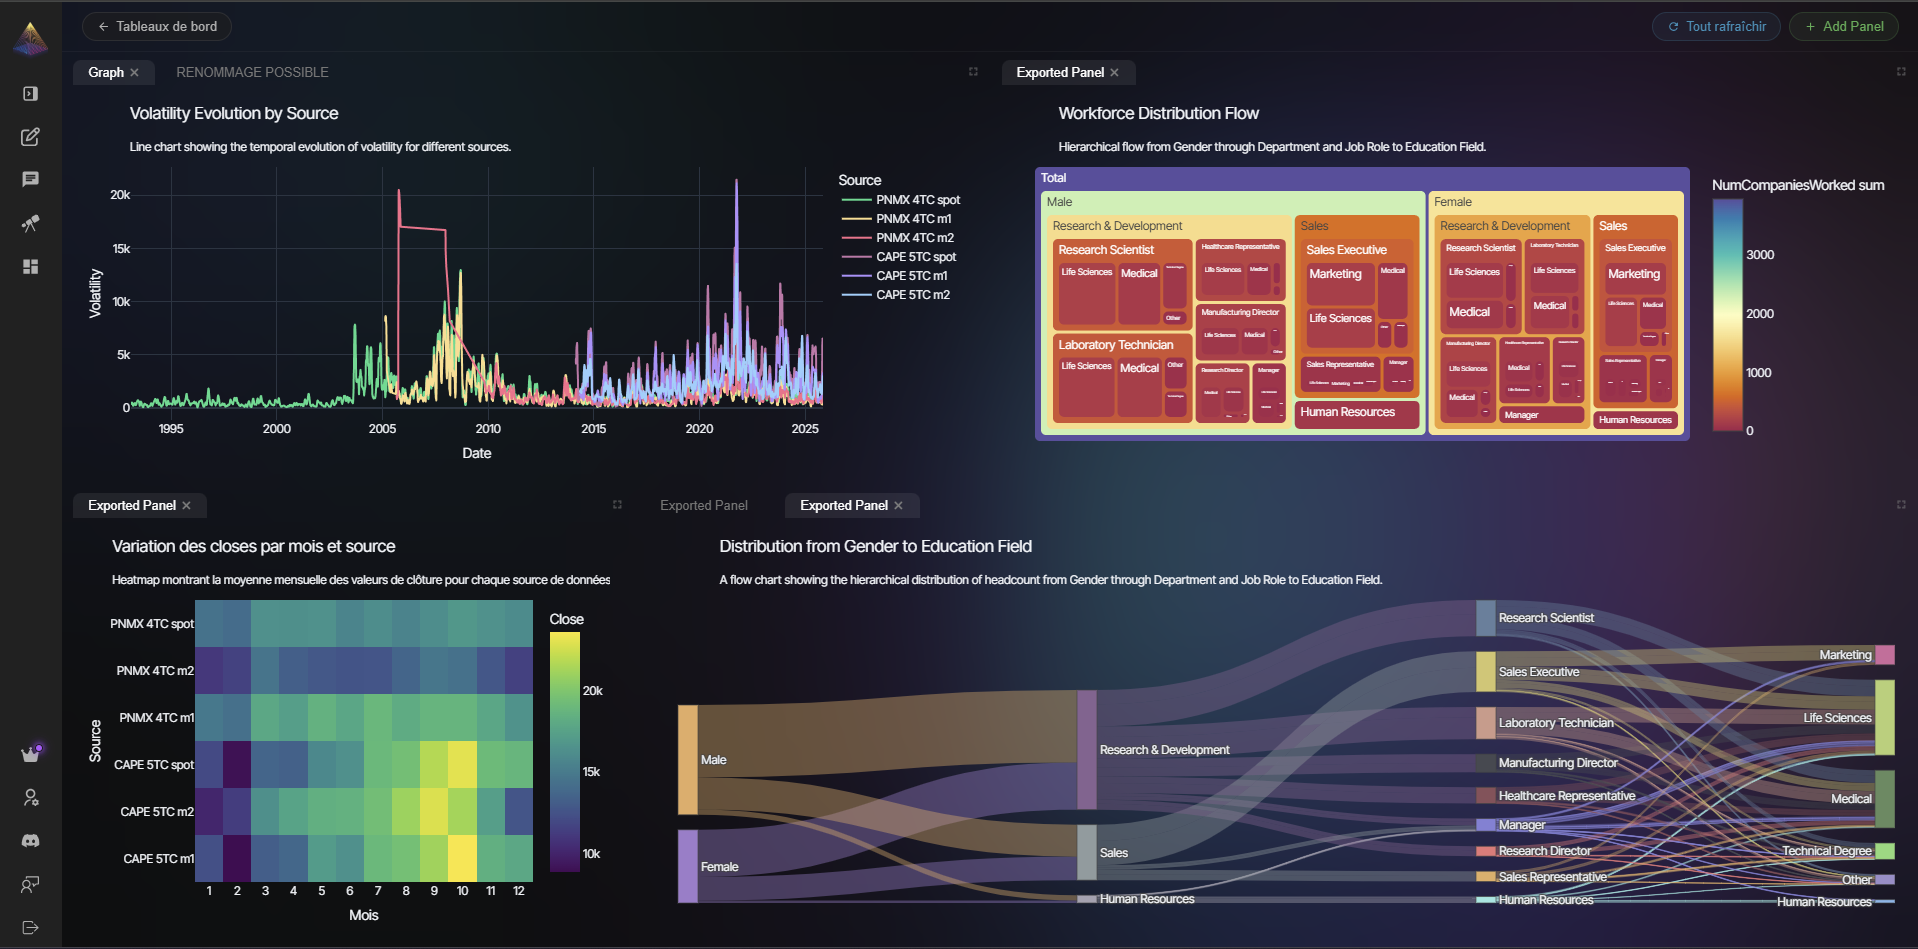
🧠 Two Engines in OneData processing (joins, pivots, aggregations, geocoding, time series) AND visualization generation from a single prompt. 🔒 Data Privacy by DesignRaw data never leaves your machine. Only column names, types, and aggregate statistics are sent. 📈 Multi-Backend RenderingAuto-detects the best engine: Plotly (2D charts), VTK (3D/medical), DeckGL (geospatial). |
🧪 Auditable ResultsPowered by constraint solving, not random generation. Same input = same output, every time. ⚡ Offline Rendering
💾 Reusable SpecsSave to |
Beyond Simple Charts
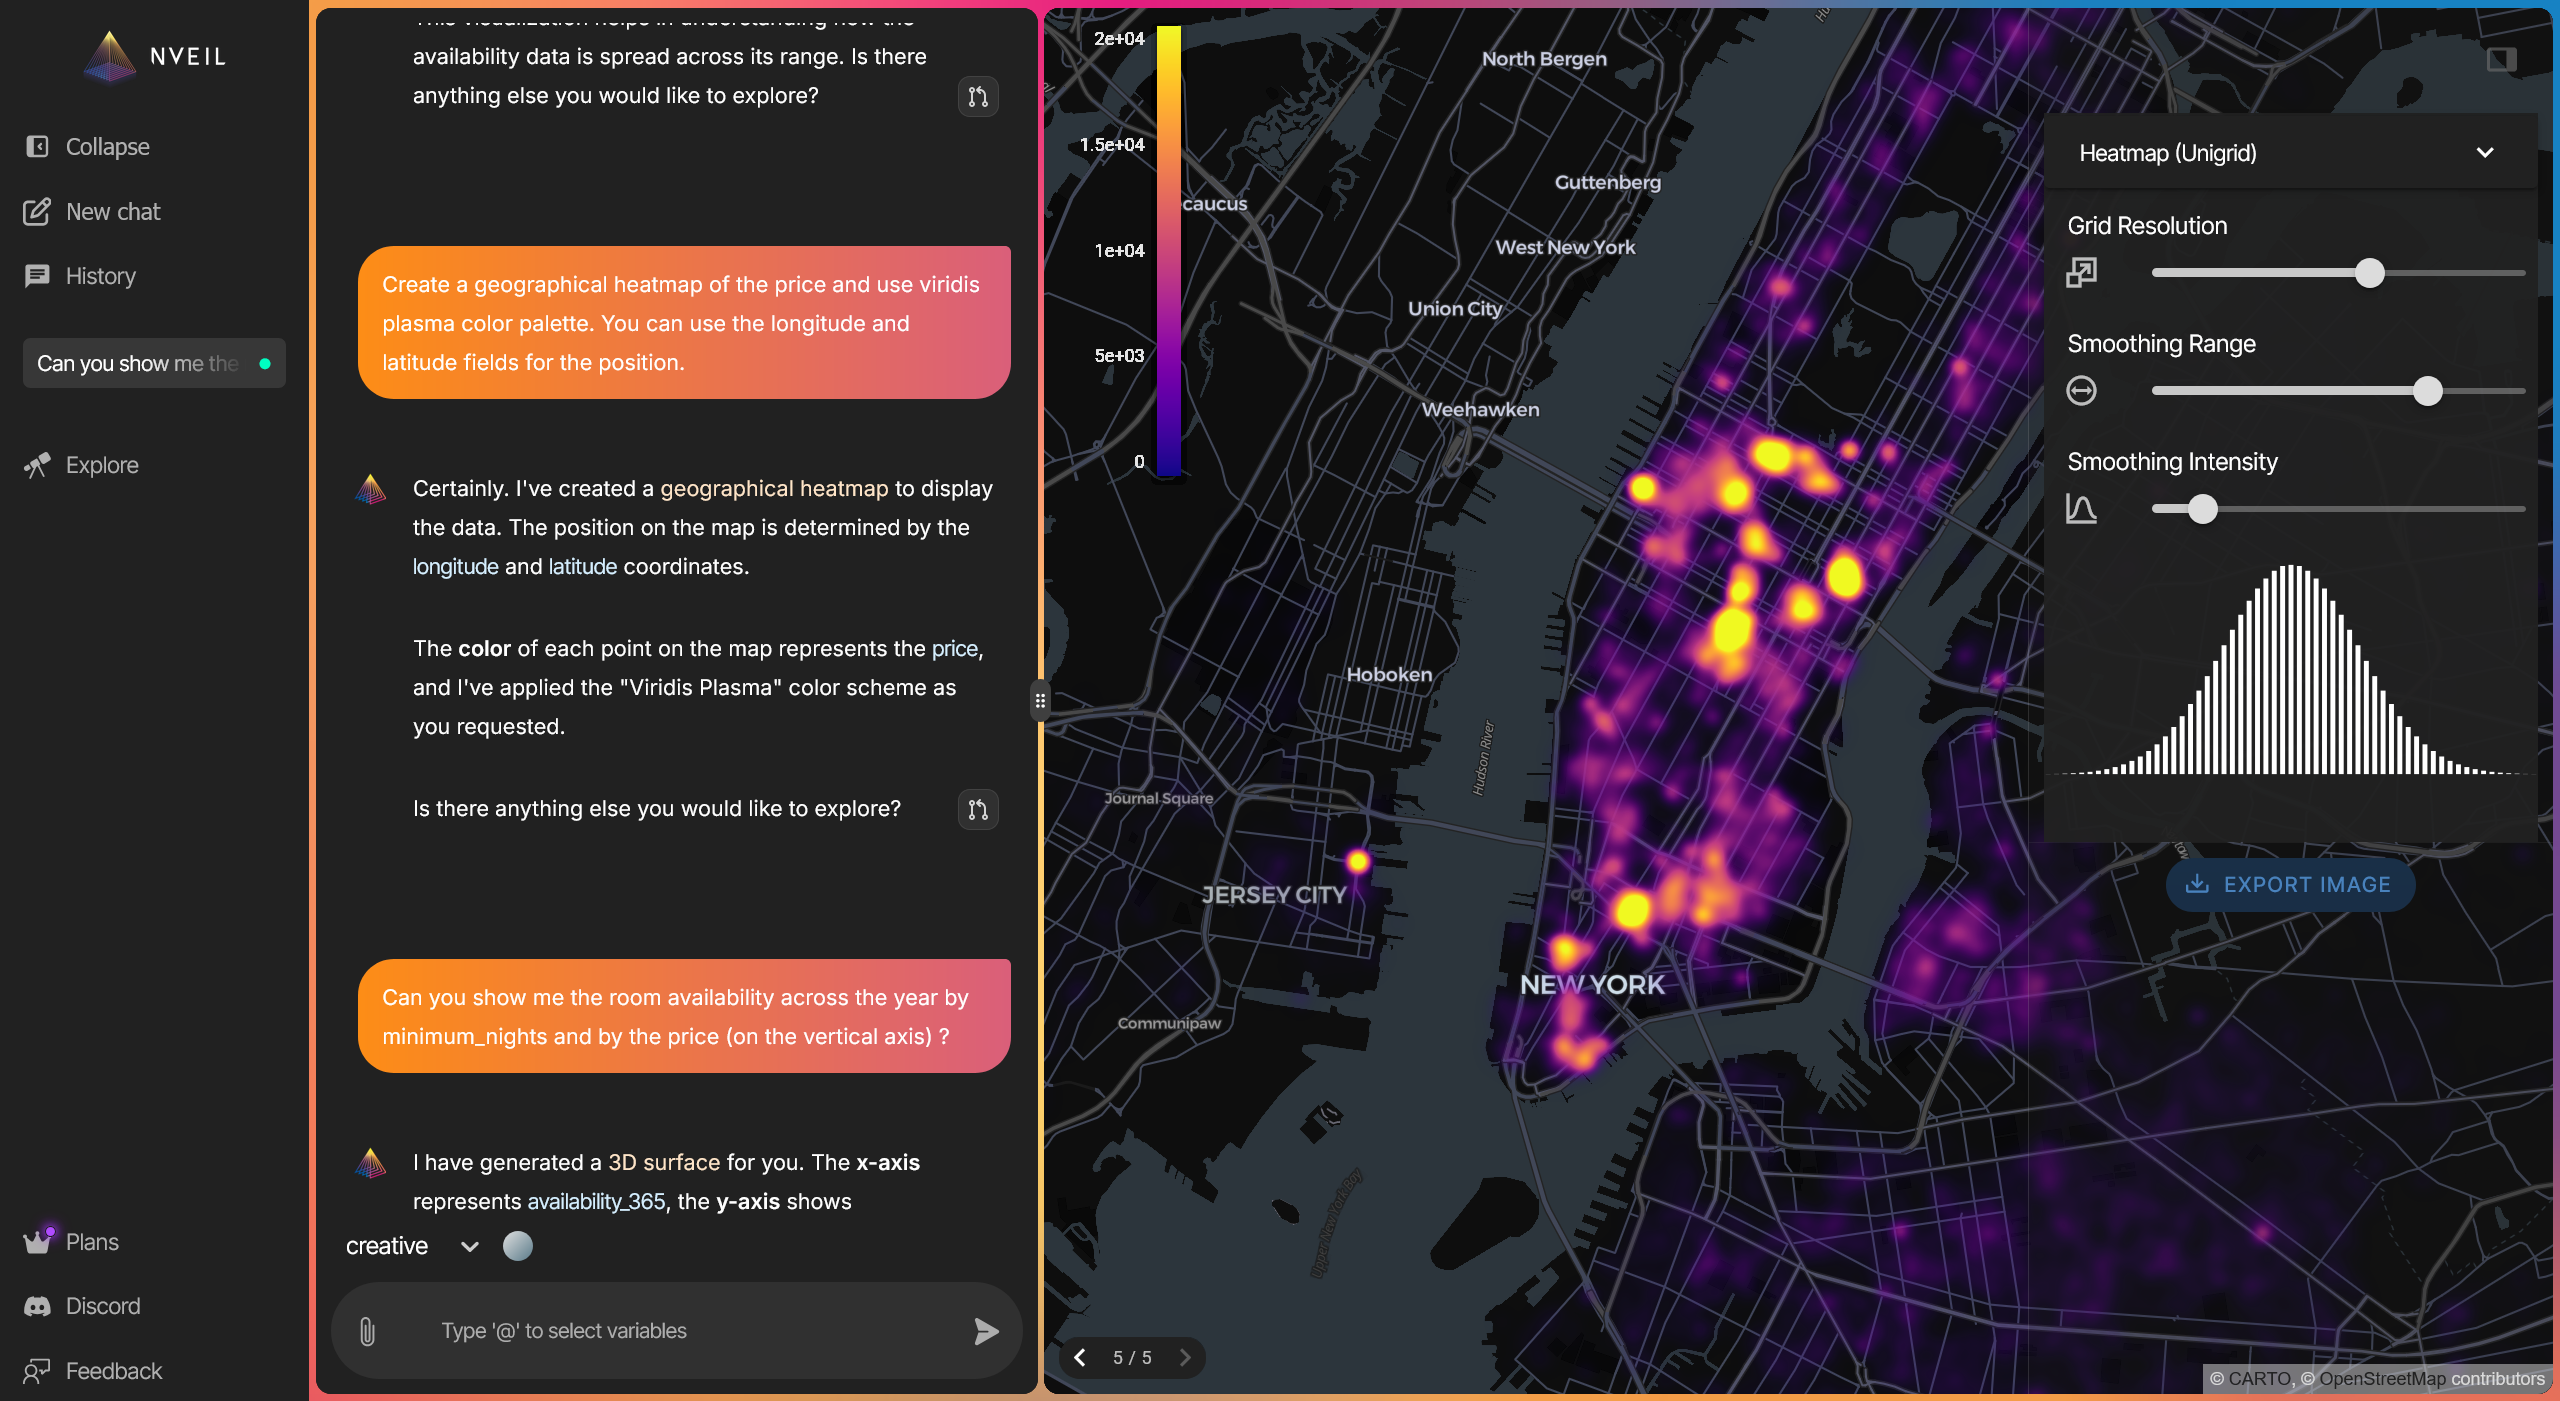
NVEIL handles geospatial heatmaps, 3D volumes, scientific visualizations, medical imaging (DICOM), network graphs, and 50+ other visualization types — all from natural language.
Save Once, Render Forever
# Generate once (API call)
spec = nveil.generate_spec("Monthly trend by category", df)
spec.save("trend.nveil")

# Reload anywhere — no API call, no server, no cost
spec = nveil.load_spec("trend.nveil")
fig = spec.render(fresh_data)
nveil.save_image(fig, "report.png")
Installation
pip install nveil
Requirements: Python 3.10+
Getting Started
- Create an account at app.nveil.com
- Generate an API key in Settings
- Start visualizing
import os
import nveil

nveil.configure(api_key=os.environ["NVEIL_API_KEY"])

spec = nveil.generate_spec("scatter plot of price vs area", df)
fig = spec.render(df)
nveil.show(fig)
See the examples/ directory for more usage patterns.
Documentation
Full documentation is available at docs.nveil.com:
- Quickstart Guide
- Core Concepts — sessions, specs, and the two-stage flow
- API Reference — full reference for all public functions
- Privacy Model — what data is sent, what stays local
- Examples — bar charts, multi-dataset, offline rendering
Contributing
NVEIL is proprietary software. Bug reports and feature requests are welcome via GitHub Issues.
License
Proprietary. See LICENSE for details.
Release history Release notifications | RSS feed


Download files
Download the file for your platform. If you're not sure which to choose, learn more about installing packages.
Source Distributions
Built Distribution
Filter files by name, interpreter, ABI, and platform.
If you're not sure about the file name format, learn more about wheel file names.
Copy a direct link to the current filters
File details
Details for the file nveil-1.1.2-py3-none-any.whl.
File metadata
- Download URL: nveil-1.1.2-py3-none-any.whl
- Upload date:
- Size: 42.0 kB
- Tags: Python 3
- Uploaded using Trusted Publishing? No
- Uploaded via: twine/6.2.0 CPython/3.13.3
File hashes
| Algorithm | Hash digest | |
|---|---|---|
| SHA256 |
b95179691e299908cca1aead06eb0e07c65e7caa927e994408c36b797922379b
|
|
| MD5 |
3c326c6e416e13b97862852dc52a8056
|
|
| BLAKE2b-256 |
5c97bbcd238b5c5d3ad61d939355350bd7dc1acbb74d9772a14f9926c0eab3d0
|






