
ollama-watch
Terminal observability for local model status via Ollama



Live prefill and decode progress from Ollama's runner.
Standard library only. No dependencies.
ollama serves models for that various harnesses consume (OpenCode, Hermes, Pi, etc). but they're built for low-latency, high throughput remote servers. When running locally, high latency, slow prefills and a lack of observability for these is bad UX.
ollama-watch is a parser of the ollama server logs, that formats them and displays them conveniently either as a log or CLI dashboard.
Dashboard · Library · Quickstart · Tests · Contributing
Contents
Quickstart
pip install ollama-watch
Or with uv:
uv pip install ollama-watch
Run it:
ollama-watch
With a historical log + pinned bottom current state:
✔ 16:23:34 200 32.243998125s | input 48.2k cached 47.9k processed 343 @ 44 tok/s (7.8s) | out ~307 @ ~13 tok/s (23.6s) mtp_accept_rate 0.79 | peak 32.78 GiB
✔ 16:24:15 200 26.539759625s | input 48.5k cached 48.2k processed 231 @ 51 tok/s (4.5s) | out ~194 @ ~9 tok/s (21.9s) mtp_accept_rate 0.80 | peak 34.38 GiB
✔ 16:26:54 200 2m27s | input 48.8k cached 48.5k processed 282 @ 60 tok/s (4.7s) | out ~1632 @ ~11 tok/s (2m21s) mtp_accept_rate 0.67 | peak 32.83 GiB

[qwen3.8:27b-mlx 34GB 100%GPU ctx65536 ∞] Processing input ███████████████████████████░  99.3% 48.7k/49.1k cached 48.7k
Ctrl+Cprints a session summary: median input and output rates, total tokens, cache hit share, and failure count.
Or run it straight from a clone:
PYTHONPATH=src python3 -m ollama_watch.cli
Options
ollama-watch                       # follow live, one status line
ollama-watch -d                    # full-screen dashboard
ollama-watch --replay              # replay this log's history, then follow
ollama-watch --replay --no-follow  # history + summary, then exit
ollama-watch --log /path/to/server.log --host 127.0.0.1:11434
ollama-watch --no-server           # skip /api/ps (no model details in the header)
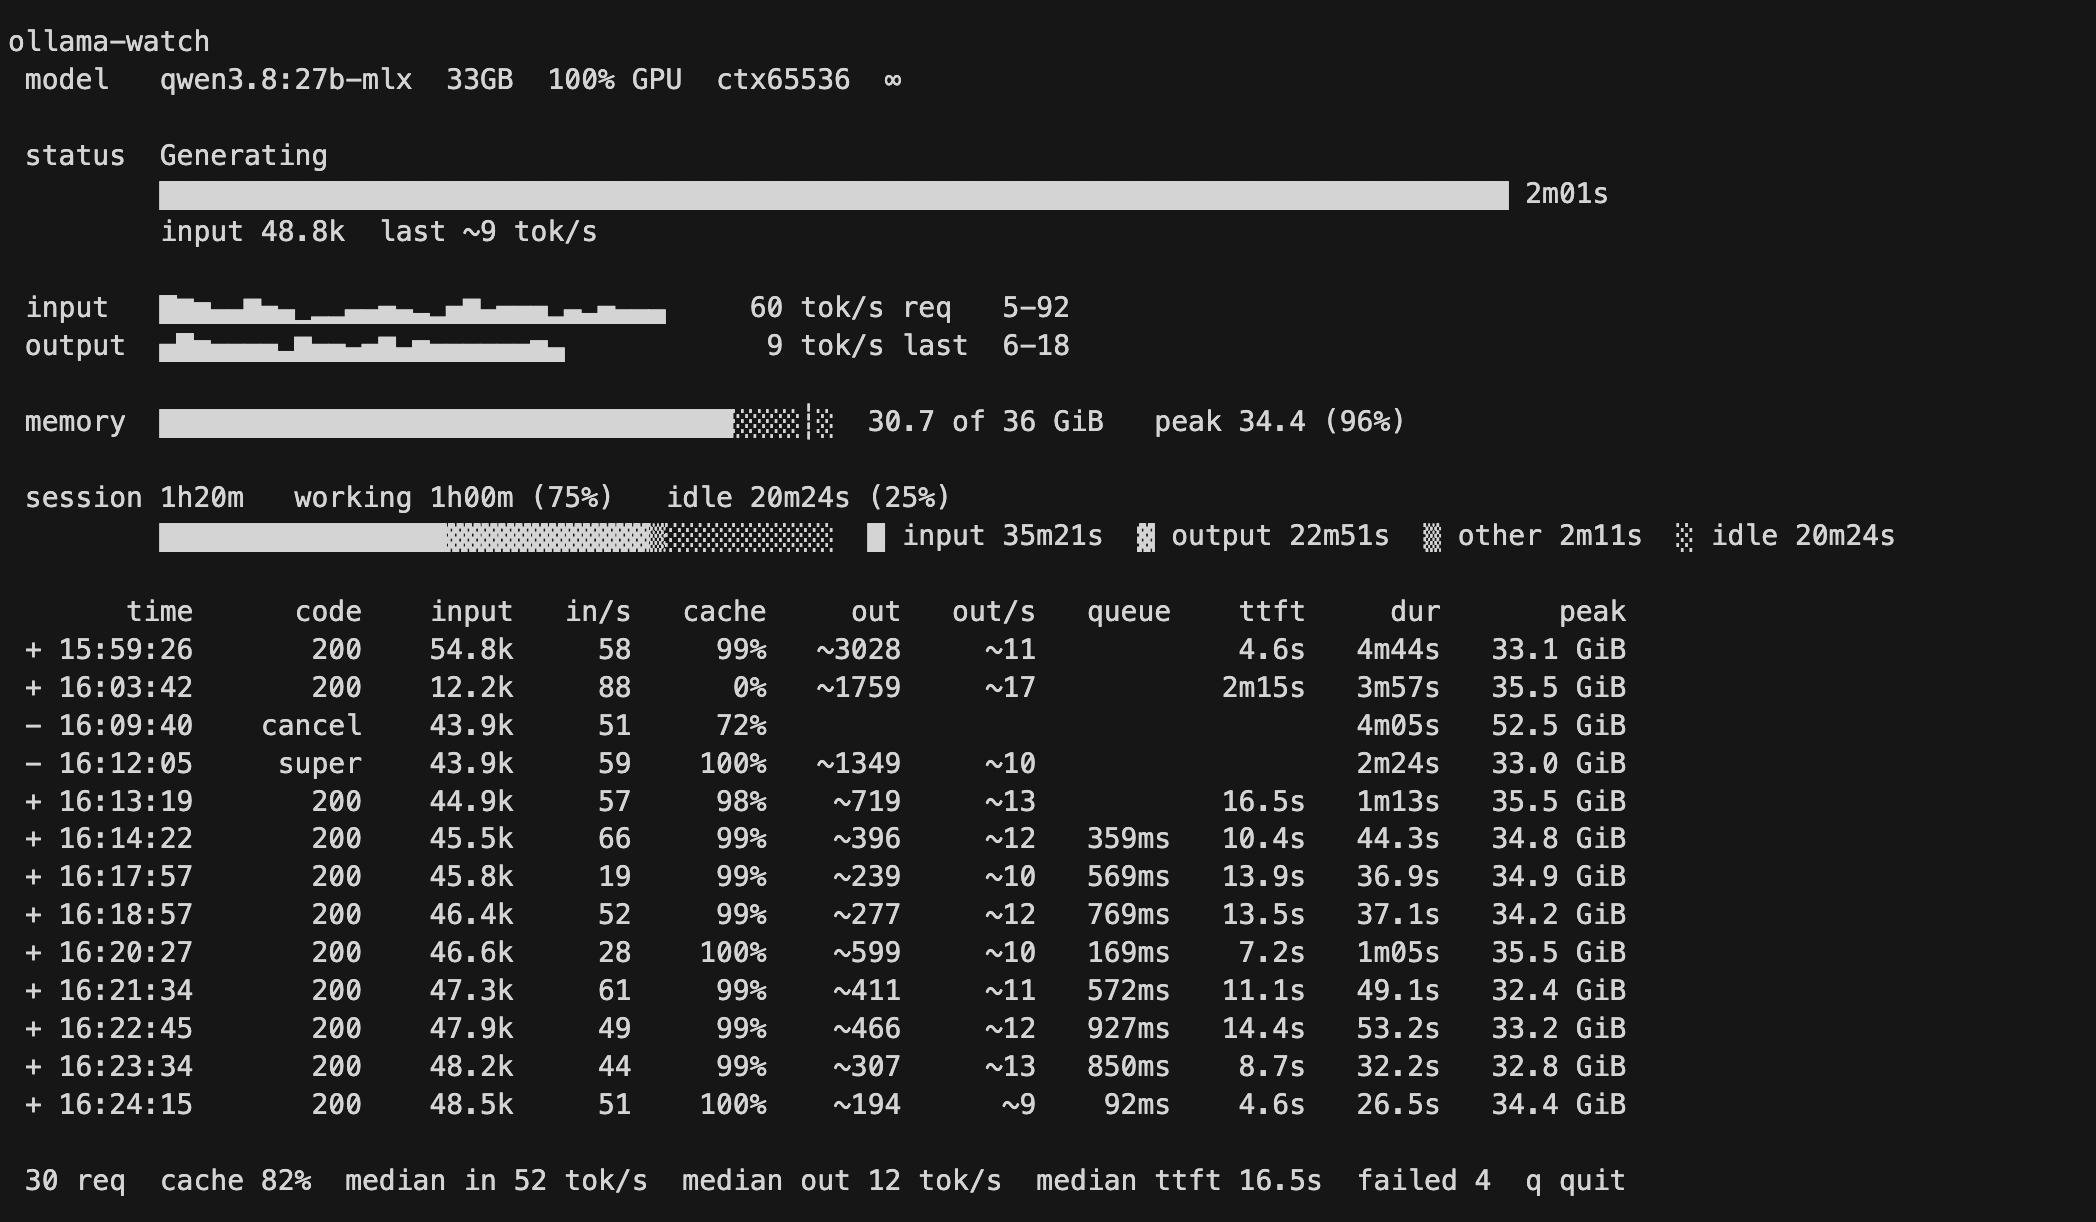
Dashboard
ollama-watch -d gives a full-screen view. q quits.
ollama-watch
 model   qwen3.8:27b-mlx  33GB  100% GPU  ctx65536  ∞

 status  Generating
         ████████████████████████████████████████████████████████████████████████████████ 2m01s
         input 48.8k  last ~9 tok/s

 input   █▇▆▄▄▇▅▄▁▂▂▄▄▅▄▃▂▅▇▄▅▅▅▂▄▃▅▄▄▄     60 tok/s req   5-92
 output  ▅█▆▅▅▅▅▃▇▅▅▄▅▇▄▆▅▅▅▅▅▅▆▄            9 tok/s last  6-18

 memory  ██████████████████████████████████░░░░┊░  30.7 of 36 GiB   peak 34.4 (96%)

 session 1h20m   working 1h00m (75%)   idle 20m24s (25%)
         █████████████████▓▓▓▓▓▓▓▓▓▓▓▓▒░░░░░░░░░░  █ input 35m21s  ▓ output 22m51s  ▒ other 2m11s  ░ idle 20m24s

       time      code    input   in/s   cache     out   out/s   queue    ttft     dur       peak
 + 15:59:26       200    54.8k     58     99%   ~3028     ~11            4.6s   4m44s   33.1 GiB
 + 16:03:42       200    12.2k     88      0%   ~1759     ~17           2m15s   3m57s   35.5 GiB
 - 16:09:40    cancel    43.9k     51     72%                                   4m05s   52.5 GiB
 - 16:12:05     super    43.9k     59    100%   ~1349     ~10                   2m24s   33.0 GiB
 + 16:13:19       200    44.9k     57     98%    ~719     ~13           16.5s   1m13s   35.5 GiB
 + 16:14:22       200    45.5k     66     99%    ~396     ~12   359ms   10.4s   44.3s   34.8 GiB
 + 16:17:57       200    45.8k     19     99%    ~239     ~10   569ms   13.9s   36.9s   34.9 GiB
 + 16:18:57       200    46.4k     52     99%    ~277     ~12   769ms   13.5s   37.1s   34.2 GiB
 + 16:20:27       200    46.6k     28    100%    ~599     ~10   169ms    7.2s   1m05s   35.5 GiB
 + 16:21:34       200    47.3k     61     99%    ~411     ~11   572ms   11.1s   49.1s   32.4 GiB
 + 16:22:45       200    47.9k     49     99%    ~466     ~12   927ms   14.4s   53.2s   33.2 GiB
 + 16:23:34       200    48.2k     44     99%    ~307     ~13   850ms    8.7s   32.2s   32.8 GiB
 + 16:24:15       200    48.5k     51    100%    ~194      ~9    92ms    4.6s   26.5s   34.4 GiB

 30 req  cache 82%  median in 52 tok/s  median out 12 tok/s  median ttft 16.5s  failed 4  q quit
Runner Support
Supports:
- mlx runner (native mlx models)
- llama.cpp runner (
.ggufmodels)
Note: mlx Runner with MTP and llama.cpp runner expose metrics that can be used to either approximate tokens per second or read them directly. mlx runner without MTP doesn't, and ollama-watch will not display tokens per second for those configurations.
Session Accounting
The session panel splits the wall clock into where it was spent: model-work time, idle time, etc.
Working time splits again into processing input, generating output, and the remainder of a request that is neither (queueing, tokenising, templating).
Time To First Token
Ollama's Gin times the whole HTTP handler, so a request's arrival is end - duration.
From that: queue is arrival until the runner started work, and ttft is arrival until input processing finished - the wait before the first token can appear. While a request is in flight the live panel shows ttft so far, which is a lower bound, since the figure is only final once the request ends.
Sparklines
Sparklines display recent history. One bar per finished request, oldest on the left, newest on the right.
The figure to the right of each sparkline is the min-max rate across its bars. Sparklines are padded to a fixed width so that figure stays in one column even though the two rows rarely hold the same number of bars.
Also, each sparkline is scaled to its own peak.
As A Library
Everything the CLI shows is available programmatically, so you can build your own CLI, your own dashboard, or feed the numbers into something else entirely — a status bar, a progress widget in your own Ollama client, a metrics exporter, etc.
watch() is the whole pipeline as a generator. It yields an Update whenever anything changes:
from ollama_watch import Phase, watch

for update in watch():
    state = update.state
    if state.phase is Phase.PREFILL:
        print(f"{state.fraction:.0%} of {state.prompt_tokens}, eta {state.eta_s:.0f}s")
    for receipt in update.receipts:
        print(receipt.status, receipt.prompt_tokens, receipt.decode_rate)
A twenty-line progress bar, which is roughly what ollama-watch without the dashboard is:
from ollama_watch import Phase, watch

last = None
for update in watch():
    state = update.state
    if state.phase is Phase.PREFILL and state.fraction != last:
        last = state.fraction
        filled = int(state.fraction * 40)
        eta = f"eta {state.eta_s:.0f}s" if state.eta_s else ""
        print(f"\r[{'#' * filled:<40}] {state.fraction:.0%} {eta}", end="", flush=True)
    for receipt in update.receipts:
        last = None
        mark = "ok" if receipt.ok else receipt.status
        ttft = f"ttft {receipt.ttft_s:.0f}s" if receipt.ttft_s else "ttft unknown"
        print(f"\r{mark} {receipt.prompt_tokens} in, {ttft}")
Tests
uv run --with pytest python -m pytest
Contributing
Found a bug? Have an idea? PRs welcome.
- Fork it
- Create your feature branch
- Write tests
- Submit a PR
1 maintainer

Metadata
1 maintainer
Release files for ollama-watch 0.1.0
For a detailed explanation of source distributions (sdists) and built distributions (wheels), please see the package formats documentation.
Source distribution (sdist)
| File | Size | Uploaded | |
|---|---|---|---|
| ollama_watch-0.1.0.tar.gz | 349.2 kB | Details |
Built distribution (wheel)
| File | Interpreter | ABI | Platform | Reset |
|---|---|---|---|---|
| ollama_watch-0.1.0-py3-none-any.whl | Python 3 | none | any | Details |
Total release size: 386.0 kB
Release files / ollama_watch-0.1.0.tar.gz
| Download URL | ollama_watch-0.1.0.tar.gz |
|---|---|
| Size | 349.2 kB |
| Tags | Source |
|
SHA-256 checksum How to use checksums |
5f9048d84ee44ab3a4a439fbd3a408783903d0348760572ea0c42240811e40f7
|
|
BLAKE2b-256 checksum How to use checksums |
a2ae49927bb02300a83ad5556aea60cd6e1c5cec419868c23f4e7b548595ebd7
|
| Upload date | |
|
Uploaded using Trusted Publishing? What is trusted publishing? |
No |
| Uploaded via |
uv/0.9.8
|
Release files / ollama_watch-0.1.0-py3-none-any.whl
| Download URL | ollama_watch-0.1.0-py3-none-any.whl |
|---|---|
| Size | 36.8 kB |
| Tags | Python 3 |
|
SHA-256 checksum How to use checksums |
b016c18c49ca3f6661df764dce271786d2bc5aa254585fa6fa2b57a69574a24b
|
|
BLAKE2b-256 checksum How to use checksums |
aaec02e93cc4b856cc66a4fa43b64e0accd3da04836549c4a1a761de9c4d30da
|
| Upload date | |
|
Uploaded using Trusted Publishing? What is trusted publishing? |
No |
| Uploaded via |
uv/0.9.8
|













