Publication-quality matplotlib figures for omics data

Project description
omicsplot
Publication-quality matplotlib figures for omics data, with two focuses:
-
omicsplot.heatmap— ComplexHeatmap-style heatmaps where the body is specified in absolute physical units (mm, cm, inch, pt). Surrounding panels (dendrograms, annotations, labels, colorbar, legend) grow outward without shrinking the body. Multi-panel composition with|(side-by-side) and/(stacked) keeps body positions exactly aligned across panels. Includes a chromosome-awaregenomic_heatmapfor binned signals (methylation, expression, copy number, accessibility). -
omicsplot.tracks— genome-wide track plots stacked vertically across per-chromosome subplot axes sized proportionally to chromosome lengths. Built-in track types: scatter, line segments, bar, step coverage, SV triangles. Trivially extensible by subclassing_BaseTrack.
Both submodules share a unit system inspired by R's grid::unit():
absolute (mm, cm, inch, pt), relative (npc), and flexible (null).
Install
pip install omicsplot
Requires Python ≥ 3.10. Depends on numpy, pandas, matplotlib, scipy, seaborn.
Quick start
The snippets below show the API for each value proposition. Complete runnable examples — including synthetic data generation — are in docs/scripts/render_readme.py, which produces the figures shown here.
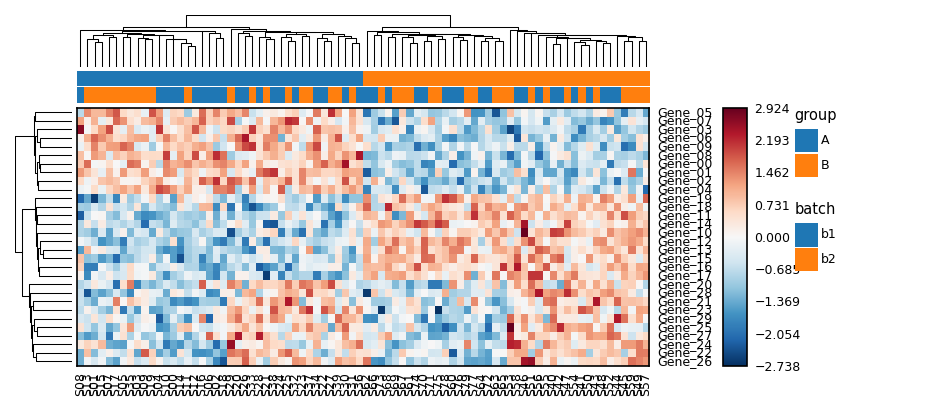
Heatmap with absolute physical sizing
from omicsplot import unit
from omicsplot.heatmap import Heatmap, HeatmapAnnotation

hm = Heatmap(
    df,
    width=unit(120, 'mm'),
    height=unit(50, 'mm'),
    row_dendrogram_size=unit(12, 'mm'),
    col_dendrogram_size=unit(10, 'mm'),
    z_score=0,                 # row-wise normalization
    cmap='RdBu_r',
    center=0,
)
hm.add_top_annotation(HeatmapAnnotation(
    group=sample_groups,
    batch=sample_batch,
    height=unit(3, 'mm'),
))
hm.draw()
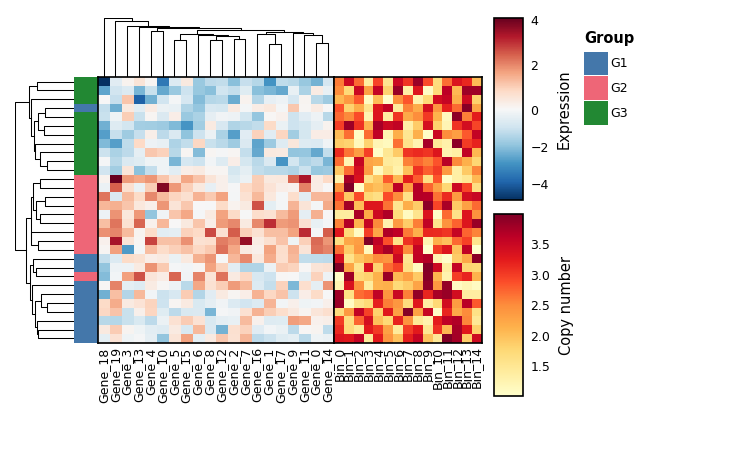
Multi-panel composition
Use | for side-by-side and / for stacked. With share_row_order=True
(side-by-side) or share_col_order=True (stacked), bodies stay aligned
across panels.
hm_a = Heatmap(mat_a, width=unit(40, 'mm'), height=unit(45, 'mm'),
               cmap='RdBu_r', center=0, name='Expression',
               show_row_names=False)
hm_a.add_left_annotation(HeatmapAnnotation(
    Group=groups, colors=group_colors, width=unit(4, 'mm'),
))

hm_b = Heatmap(mat_b, width=unit(25, 'mm'), height=unit(45, 'mm'),
               cmap='YlOrRd', col_cluster=False, name='Copy number',
               show_row_names=False)

(hm_a | hm_b).draw(share_row_order=True)
Compound layouts also work: (A | B) / C, A | B | C, etc.
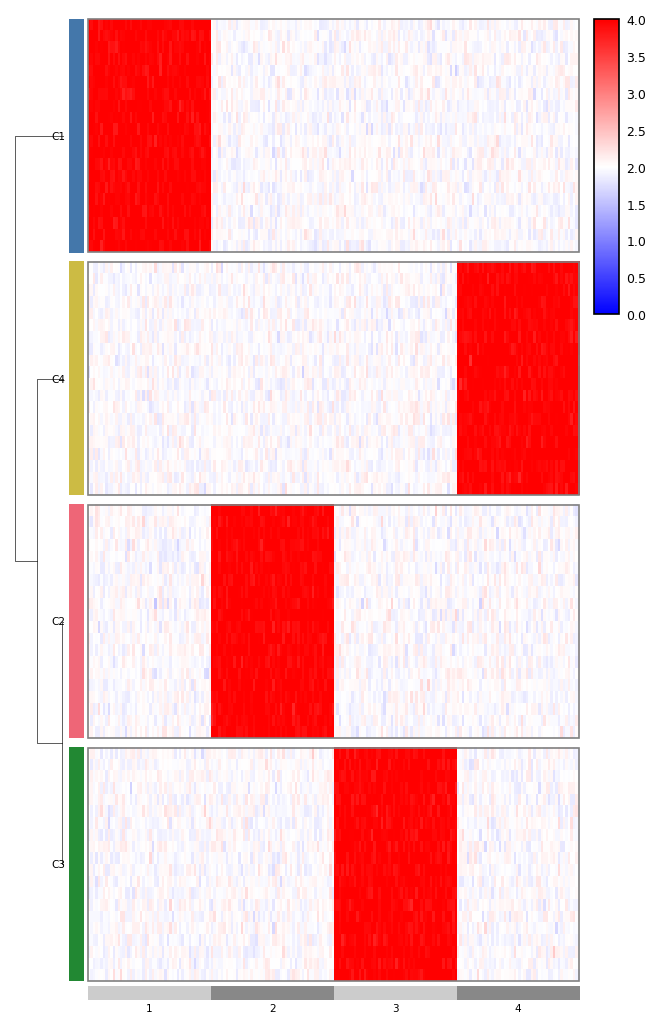
Chromosome-aware genomic heatmap
genomic_heatmap takes a long-form matrix with chrom/start/end
columns and arranges the columns into chromosome-proportional segments.
The optional cluster-of-clusters dendrogram (row_cluster_dendrogram)
shows relationships between groups, not individual rows.
from omicsplot.heatmap import genomic_heatmap

genomic_heatmap(
    matrix,                    # columns: chrom, start, end, then per-cell
    chrom_col='chrom',
    cmap='bwr', vmin=0, vmax=4, center=2,
    row_cluster=False,
    show_row_names=False,
    row_annotation={'Cluster': cluster_labels},
    row_annotation_colors={'Cluster': palette},
    row_gap=unit(2, 'mm'),
    row_cluster_dendrogram=cluster_link,             # leaves are groups
    row_cluster_dendrogram_size=unit(10, 'mm'),
)
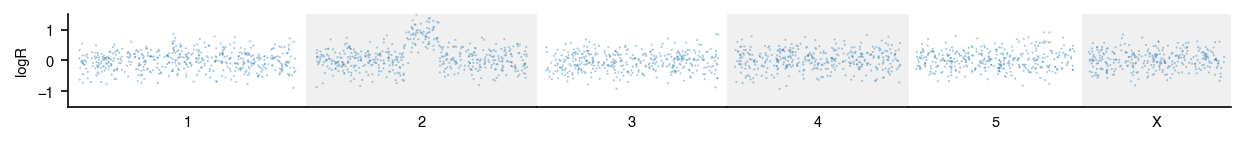
Genome-wide tracks
Each chromosome gets its own subplot axis sized proportionally to its
length. genome_range returns chromosome lengths for common builds.
from omicsplot import genome_range
from omicsplot.tracks import ScatterTrack, plot_tracks

gs = genome_range(genome='hg38')

scatter = ScatterTrack(
    points, x_column='start', y_column='value',
    ylabel='logR', ylim=(-1.5, 1.5),
    s=1, alpha=0.4,
)
plot_tracks(scatter, gs, figsize=(10, 0.8))
Status
Alpha. API may change before 1.0.
License
MIT.
Release history Release notifications | RSS feed

Download files
Download the file for your platform. If you're not sure which to choose, learn more about installing packages.
Source Distribution
Built Distribution
Filter files by name, interpreter, ABI, and platform.
If you're not sure about the file name format, learn more about wheel file names.
Copy a direct link to the current filters
File details
Details for the file omicsplot-0.1.0.tar.gz.
File metadata
- Download URL: omicsplot-0.1.0.tar.gz
- Upload date:
- Size: 58.1 kB
- Tags: Source
- Uploaded using Trusted Publishing? No
- Uploaded via: twine/6.2.0 CPython/3.11.15
File hashes
| Algorithm | Hash digest | |
|---|---|---|
| SHA256 |
8840d4e0ce3333c6c026401a3b6a7f94afa6c9f4b9da856389668b24e05f5813
|
|
| MD5 |
107db365ea229ed6d844eaa95678fc0f
|
|
| BLAKE2b-256 |
531b8f5d20d3c2f442b632559396d998da7e97eb620eabfbb51028e172d5016b
|
File details
Details for the file omicsplot-0.1.0-py3-none-any.whl.
File metadata
- Download URL: omicsplot-0.1.0-py3-none-any.whl
- Upload date:
- Size: 65.2 kB
- Tags: Python 3
- Uploaded using Trusted Publishing? No
- Uploaded via: twine/6.2.0 CPython/3.11.15
File hashes
| Algorithm | Hash digest | |
|---|---|---|
| SHA256 |
99e908db10d8c9d0df9f84476be734163340a1f4a4e116c709cac668ab3bc0db
|
|
| MD5 |
3b6e7cf07d555d754d827f865e2bd83c
|
|
| BLAKE2b-256 |
e3833c8908e393f928b72af2269751b6e8e58492f2484adfe9d72bbcd441f0f9
|


