A simple tool to measure the performance of ONNX models in Python.

Project description
onnx-perf-test - ONNX Performance Test
A simple Python tool to measure the performance of ONNX models.
Installation 
pip install onnx-perf-test
- onnxruntime is installed with the package, for other execution providers, make sure to install the appropriate version of onnxruntime.
Usage
onnx_perf_test {onnx_model} [--provider {provider}] [--num_runs {num_runs}] [--output_dir {output_dir}] [--draw] [--keep_profiling_file]
Arguments:
onnx_model: Path to the ONNX model file.--provider: Provider to use for inferencing. Default is uses onnxruntime.get_available_providers() to get the available providers. Options:TENSORRT,CUDA,CPU...--num_runs: Number of runs to average the performance. Default is 10.--output_dir: Output directory to save the results. Does not save the results if not provided.--draw: Draw the performance graph. Requiresmatplotlibto be installed. Default isFalse.--keep_profiling_file: Keep the profiling file generated by onnxruntime. Default isFalse.
Example
onnx_perf_test model.onnx --provider CUDA --num_runs 20 --output_dir results --draw
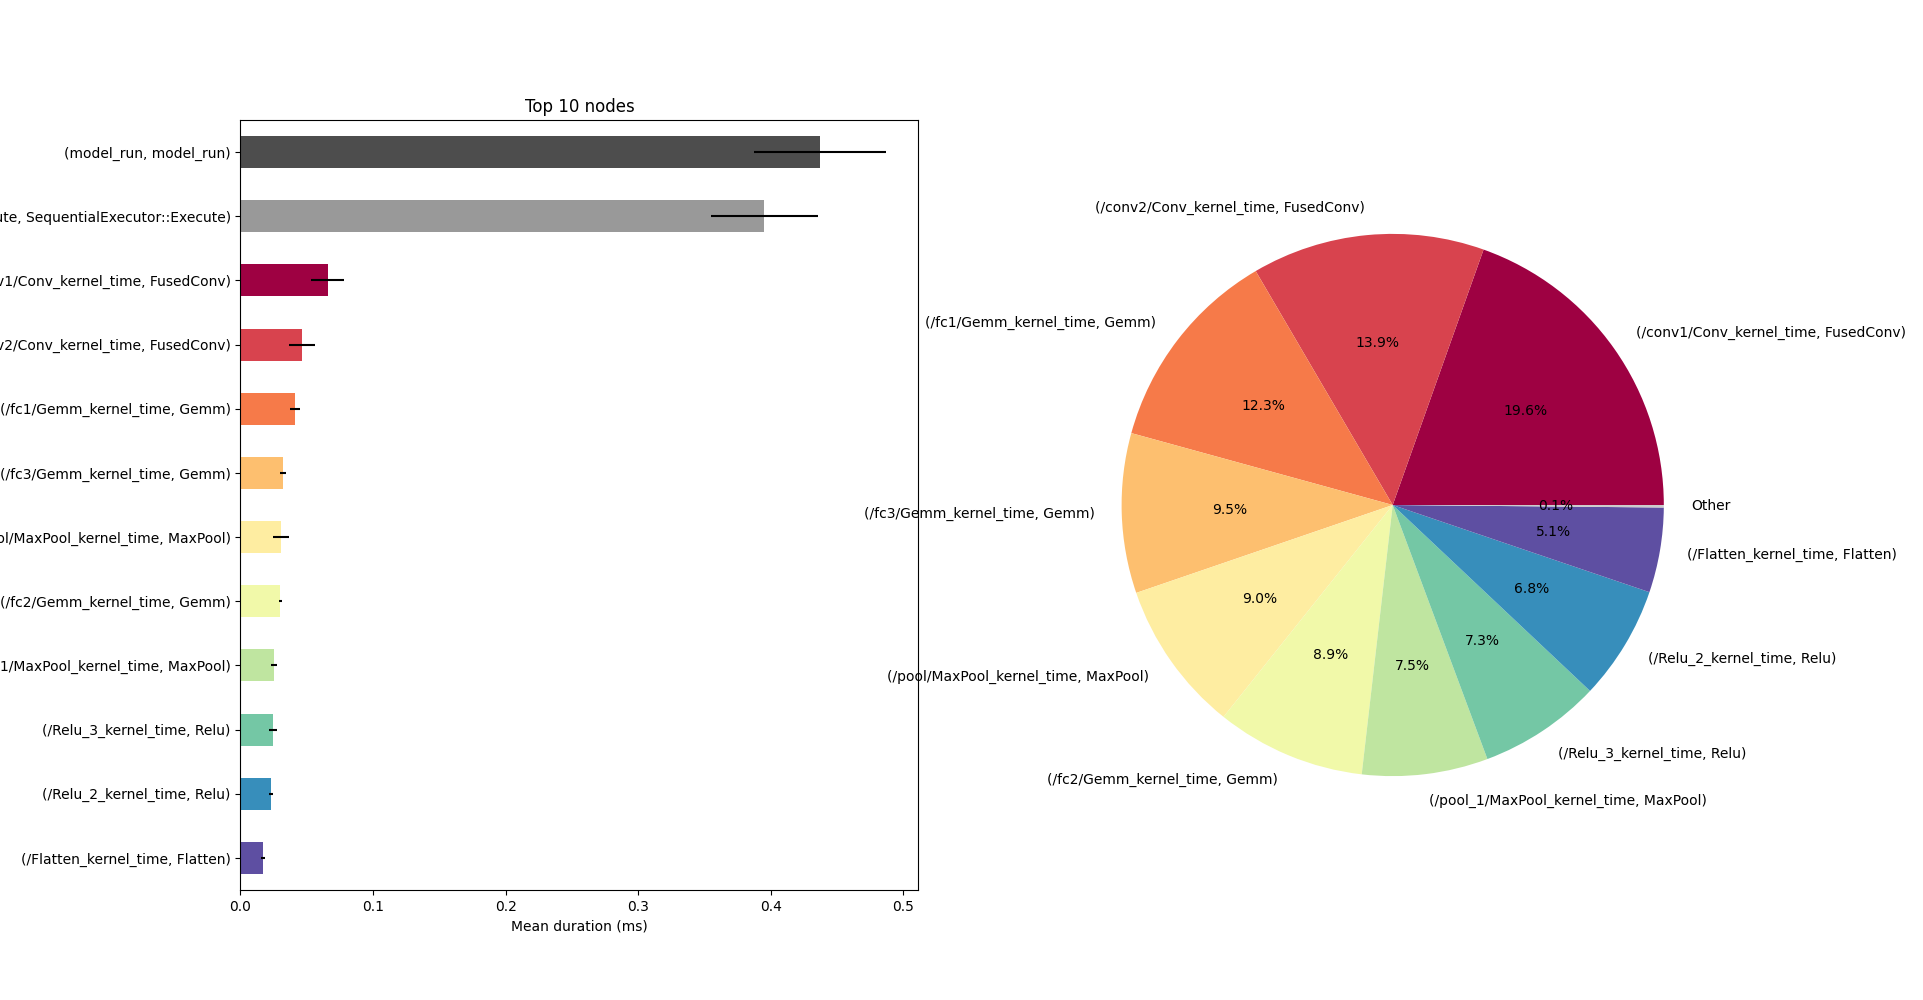
Output
Running performance test on .\model.onnx with provider DEFAULT
Model inputs:
        input.1 - Shape: [1, 3, 32, 32], Type: tensor(float)
Model outputs:
        22 - Shape: [1, 10], Type: tensor(float)

Warming up the session...
Starting performance test...
Run 1: 0.53 ms
Run 2: 0.41 ms
Run 3: 0.39 ms
Run 4: 0.40 ms
Run 5: 0.39 ms
Run 6: 0.41 ms
Run 7: 0.39 ms
Run 8: 0.41 ms
Run 9: 0.42 ms
Run 10: 0.39 ms

model_run: 0.39530000000000004 ± 0.033970739042757235 ms
        model_run: 0.39530000000000004 ± 0.033970739042757235 ms

SequentialExecutor::Execute: 0.3592 ± 0.02518288660534724 ms
        SequentialExecutor::Execute: 0.3592 ± 0.02518288660534726 ms

FusedConv: 0.0977 ± 0.013367040726270638 ms
        /conv1/Conv_kernel_time: 0.056999999999999995 ± 0.010749676997731395 ms
        /conv2/Conv_kernel_time: 0.0407 ± 0.003301514803843834 ms
        /conv2/Conv_fence_before: 0.0 ± 0.0 ms
        /conv2/Conv_fence_after: 0.0 ± 0.0 ms
        /conv1/Conv_fence_before: 0.0 ± 0.0 ms
        /conv1/Conv_fence_after: 0.0 ± 0.0 ms

Gemm: 0.0967 ± 0.00279085809185793 ms
        /fc1/Gemm_kernel_time: 0.038400000000000004 ± 0.0027568097504180435 ms
        /fc3/Gemm_kernel_time: 0.029800000000000004 ± 0.0016193277068654818 ms
        /fc2/Gemm_kernel_time: 0.028500000000000004 ± 0.0009718253158075512 ms
        /fc2/Gemm_fence_before: 0.0 ± 0.0 ms
        /fc3/Gemm_fence_before: 0.0 ± 0.0 ms
        /fc3/Gemm_fence_after: 0.0 ± 0.0 ms
        /fc2/Gemm_fence_after: 0.0 ± 0.0 ms
        /fc1/Gemm_fence_after: 0.0 ± 0.0 ms
        /fc1/Gemm_fence_before: 0.0 ± 0.0 ms

MaxPool: 0.049 ± 0.0024944382578492947 ms
        /pool/MaxPool_kernel_time: 0.026600000000000002 ± 0.0015776212754932302 ms
        /pool_1/MaxPool_kernel_time: 0.0224 ± 0.0014298407059684809 ms
        /pool_1/MaxPool_fence_after: 0.0 ± 0.0 ms
        /pool/MaxPool_fence_before: 0.0 ± 0.0 ms
        /pool_1/MaxPool_fence_before: 0.0 ± 0.0 ms
        /pool/MaxPool_fence_after: 0.0 ± 0.0 ms

Relu: 0.043199999999999995 ± 0.002699794230842212 ms
        /Relu_3_kernel_time: 0.0217 ± 0.0018885620632287062 ms
        /Relu_2_kernel_time: 0.0215 ± 0.001178511301977579 ms
        /Relu_3_fence_before: 0.0 ± 0.0 ms
        /Relu_3_fence_after: 0.0 ± 0.0 ms
        /Relu_2_fence_before: 0.0 ± 0.0 ms
        /Relu_2_fence_after: 0.0 ± 0.0 ms

Flatten: 0.0172 ± 0.0020439612955674524 ms
        /Flatten_kernel_time: 0.0172 ± 0.0020439612955674524 ms
        /Flatten_fence_after: 0.0 ± 0.0 ms
        /Flatten_fence_before: 0.0 ± 0.0 ms
Analyze ONNX Profiling File
Additionally, you can analyze your own .json profiling file generated by ONNXRuntime using the analyze_onnx_profiling.py script.
analyze_onnx_profile {onnx_profile_file} [--output_dir {output_dir}] [--draw]
Arguments:
onnx_profile_file: Path to the ONNX profiling file.--output_dir: Output directory to save the results. Does not save the results if not provided.--draw: Draw the performance graph. Requiresmatplotlibto be installed. Default isFalse.
Example
analyze_onnx_profile model_profile.json --output_dir results --draw


Download files
Download the file for your platform. If you're not sure which to choose, learn more about installing packages.
Source Distribution
onnx_perf_test-0.7.0.tar.gz
(7.0 kB
view details)
Built Distribution
File details
Details for the file onnx_perf_test-0.7.0.tar.gz.
File metadata
- Download URL: onnx_perf_test-0.7.0.tar.gz
- Upload date:
- Size: 7.0 kB
- Tags: Source
- Uploaded using Trusted Publishing? No
- Uploaded via: twine/5.1.1 CPython/3.11.0
File hashes
| Algorithm | Hash digest | |
|---|---|---|
| SHA256 | d761e1a4003a95dd5183d7e85df413976729e83e4fc4dd0155ab94c2d482d44e |
|
| MD5 | c12444d420141e48274d39bdce08466a |
|
| BLAKE2b-256 | 644ecf28243dac94a5c84587f854eef7b2c5ae56d77058c3cd3e9c93f14d243f |
File details
Details for the file onnx_perf_test-0.7.0-py3-none-any.whl.
File metadata
- Download URL: onnx_perf_test-0.7.0-py3-none-any.whl
- Upload date:
- Size: 8.0 kB
- Tags: Python 3
- Uploaded using Trusted Publishing? No
- Uploaded via: twine/5.1.1 CPython/3.11.0
File hashes
| Algorithm | Hash digest | |
|---|---|---|
| SHA256 | dc240d25c0a83493d2f8a606077cc60d8856d3c347c875b9e87ce14badff8b79 |
|
| MD5 | 6601817decb039bf039b43f8632bdcce |
|
| BLAKE2b-256 | 83bd174a4cfa8b046a36386c6cb1e5b299366d009b6b284c39d7e02ab4a068ce |


