A Python package for extracting and plotting the locations, directions, energy distributions of OpenMC source particles.


Project description


A Python package for plotting the positions, directions or energy distributions of OpenMC sources.
Installation
You will need to have OpenMC version 0.14.0 or newer installed first.
pip install openmc_source_plotter
Features
The package provides three plotting functions that can plot source data from openmc objects.
plot_source_energyplot_source_positionplot_source_directionplot_gamma_emission
Additionally the package provides a convienient method of sampling particles
sample_initial_particles
Example plots
Below are some basic examples, for more examples see the examples folder for example usage scripts.
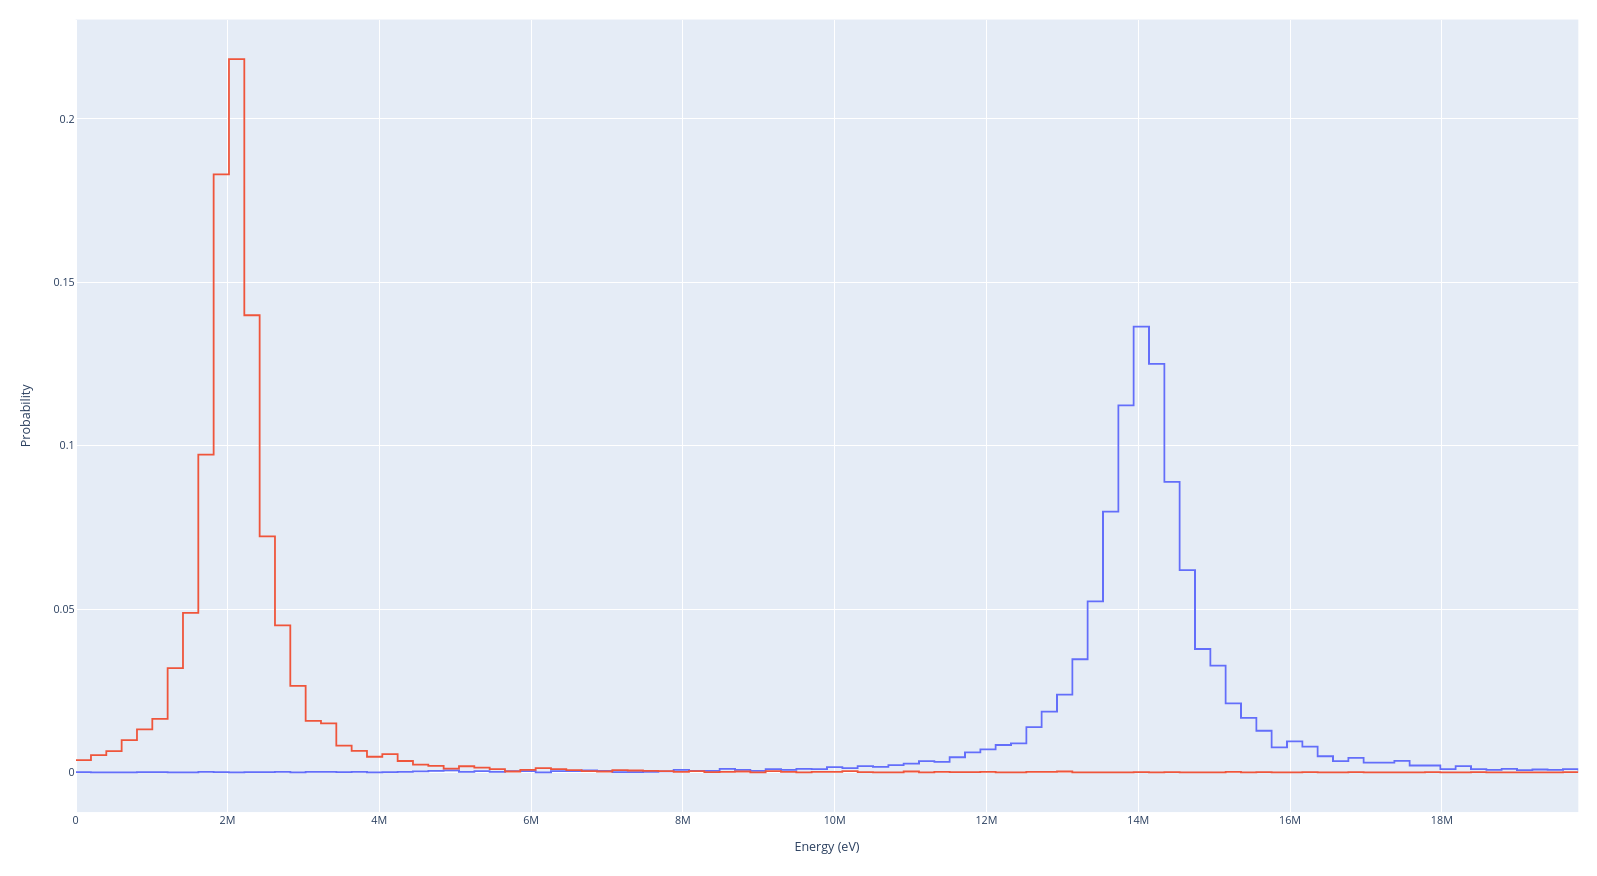
Plot of energy distribution of the source
:link:Link to example script.

Plot of energy distribution of two sources
:link:Link to example script.
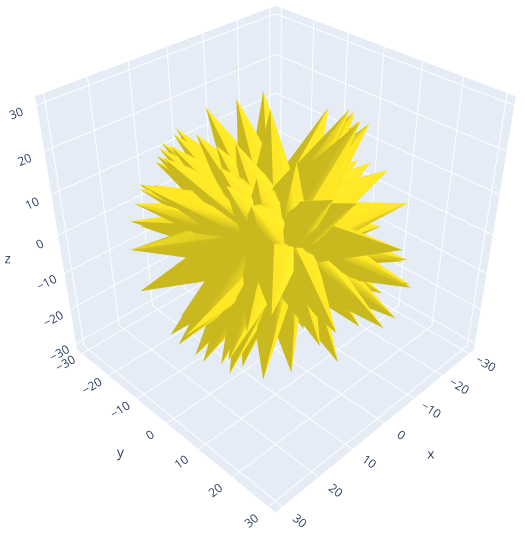
Plot direction of particles
:link:Link to example script.
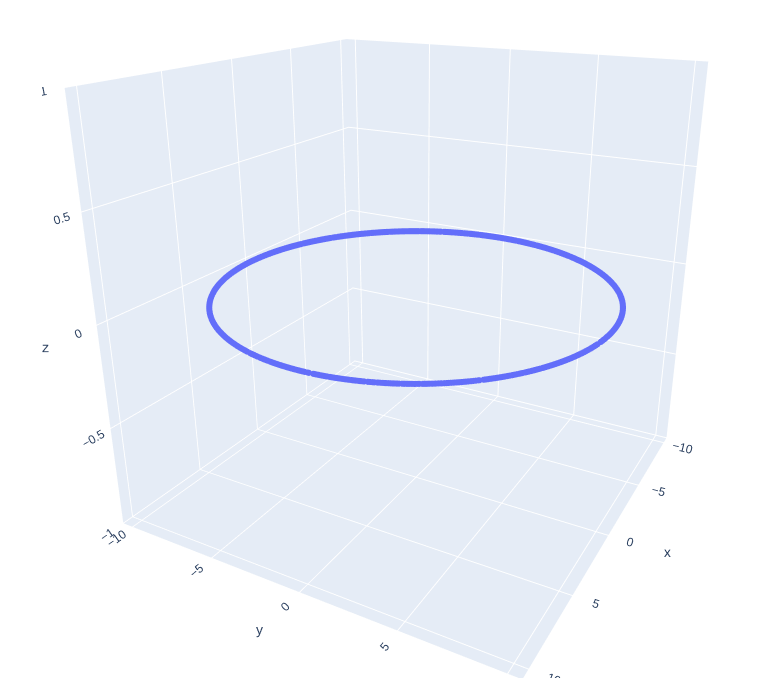
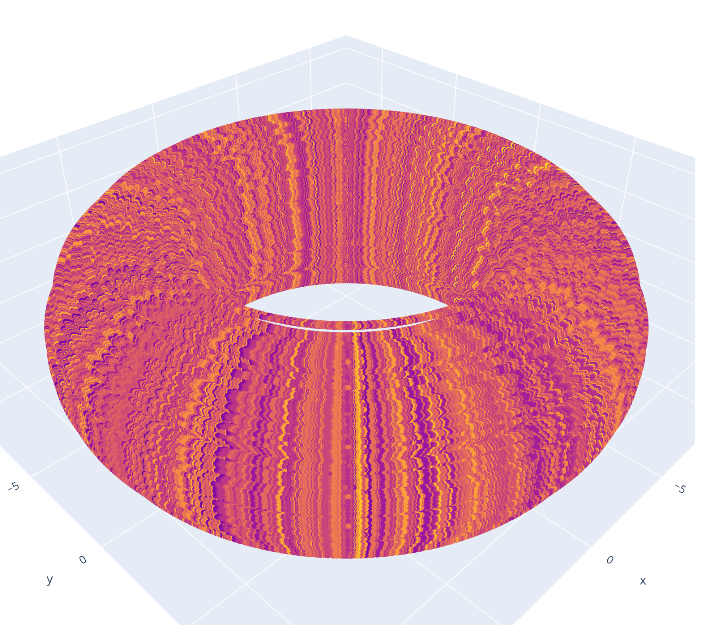
Plot position of particles
:link:Link to example script.
Plot labeled gamma lines from material
:link:Link to example script.

Extract particle objects
A list of openmc.Particle objects can be obtained using model.sample_initial_particles() or openmc.SourceBase.sample_initial_particles()
import openmc
from openmc_source_plotter import sample_initial_particles

settings = openmc.Settings()
settings.particles = 1
settings.batches = 1
my_source = openmc.IndependentSource()
my_source.energy = openmc.stats.muir(e0=14080000.0, m_rat=5.0, kt=20000.0)
settings.source = my_source
materials = openmc.Materials()
sph = openmc.Sphere(r=100, boundary_type="vacuum")
cell = openmc.Cell(region=-sph)
geometry = openmc.Geometry([cell])

model = openmc.Model(geometry, materials, settings)

particles = sample_initial_particles(this=model, n_samples=10)

print(particles)
>>>[<SourceParticle: neutron at E=1.440285e+07 eV>, <SourceParticle: neutron at E=1.397691e+07 eV>, <SourceParticle: neutron at E=1.393681e+07 eV>, <SourceParticle: neutron at E=1.470896e+07 eV>, <SourceParticle: neutron at E=1.460563e+07 eV>, <SourceParticle: neutron at E=1.420684e+07 eV>, <SourceParticle: neutron at E=1.413932e+07 eV>, <SourceParticle: neutron at E=1.412428e+07 eV>, <SourceParticle: neutron at E=1.464779e+07 eV>, <SourceParticle: neutron at E=1.391648e+07 eV>]

print(particles[0].E)
>>>1.440285e+07
Related packages
Tokamak sources can also be plotted using the openmc-plasma-source package
Release history Release notifications | RSS feed


Download files
Download the file for your platform. If you're not sure which to choose, learn more about installing packages.
Source Distribution
Built Distribution
Filter files by name, interpreter, ABI, and platform.
If you're not sure about the file name format, learn more about wheel file names.
Copy a direct link to the current filters
File details
Details for the file openmc_source_plotter-0.7.2.tar.gz.
File metadata
- Download URL: openmc_source_plotter-0.7.2.tar.gz
- Upload date:
- Size: 38.2 kB
- Tags: Source
- Uploaded using Trusted Publishing? No
- Uploaded via: twine/6.2.0 CPython/3.14.2
File hashes
| Algorithm | Hash digest | |
|---|---|---|
| SHA256 |
1889ae006bf7e034a9b0cad2292ecb92122ab8d612fbbe6d3f356b6a2ca91f3b
|
|
| MD5 |
9e175769a0d97ff122add2de3615eb66
|
|
| BLAKE2b-256 |
297ffdd4ce50502f5410b210de7a97ddcf29f49221c007c927504b4da59dbe22
|
File details
Details for the file openmc_source_plotter-0.7.2-py3-none-any.whl.
File metadata
- Download URL: openmc_source_plotter-0.7.2-py3-none-any.whl
- Upload date:
- Size: 8.8 kB
- Tags: Python 3
- Uploaded using Trusted Publishing? No
- Uploaded via: twine/6.2.0 CPython/3.14.2
File hashes
| Algorithm | Hash digest | |
|---|---|---|
| SHA256 |
177036a018d790ff4eaca2eb650973dbeab5252692195d2041f8c551bbdf7a8d
|
|
| MD5 |
b87da135d6eb6913091da68bb9589b38
|
|
| BLAKE2b-256 |
638c8be84668ca843e75e3cdbaeb040ff76481dac94c904fda6fc71510fd2c2d
|


