A comprehensive benchmark for real-world Sentinel-2 imagery super-resolution

Project description

A comprehensive benchmark for real-world Sentinel-2 imagery super-resolution


GitHub: https://github.com/ESAOpenSR/opensr-test
Documentation: https://opensr-test.readthedocs.io/
PyPI: https://pypi.org/project/opensr-test/
Paper: Coming soon!
Overview
In the domain of remote sensing, image super-resolution (ISR) goal is augmenting the ground sampling distance, also known as spatial resolution. Over recent years, numerous research papers have been proposed addressing ISR; however, they invariably suffer from two main issues. Firstly, the majority of these proposed models are tested on synthetic data. As a result, their applicability and performance in real-world scenarios remain unverified. Secondly, the frequently utilized evaluation metrics for these models, such as LPIPS and SSIM, are inherently designed for perceptual image analysis, not specifically for super-resolution.
In response to these challenges, 'opensr-test' has been introduced as a Python package, designed to provide users with three meticulously curated test datasets. These datasets are tailored to minimize spatial distortions between Low Resolution (LR) and High Resolution (HR) images, while calibrating differences in the spectral domain. Moreover, the 'opensr-test' package offers five distinct types of metrics aimed at accurately evaluating the performance of ISR algorithms, thus addressing the aforementioned shortcomings of conventional evaluation techniques.
Datasets
The utilization of synthetic data in benchmarking could potentially introduce biased conclusions, as there are no guarantees that a degradation method could not inadvertently incorporate some form of bias, i.e. the degradation does not match the real-world ground sampling distance of the LR image. Therefore, to avoid synthetic data potential errors, the datasets utilized in opensr-test are meticulously created following a cross-sensor approach that means that HR and LR comes from different sensor but they are aligned as closely as possible, i.e. harmonized. Due to the limited availability of open HR resolution data that correspond with Sentinel-2, we propose using three HR sensors: SPOT, VENµS, and NAIP.
| Dataset | Scale | # Scenes | HRsize | HR Reference |
|---|---|---|---|---|
| NAIP-19 | x4 | 200 | 512 | USDA Farm Production and Conservation - Business Center, Geospatial Enterprise Operations. |
| SPOTPAN-10 | x4 | 200 | 512 | European Space Agency, 2017, SPOT 1-5 ESA |
| Mini-SEN2VENµS | x2 | 200 | 512 | Vegetation and Environment monitoring on a New Micro-Satellite (SEN2VENμS). |
Metrics
We propose that evaluating the ISR process with a single metric is not adequate, and therefore, we suggest the use of five metrics, which will be detailed below.
Spectral consistency
Measured based on the comparison of LR and SR images. The reflectance values are then compared using spectral angle distance metrics. The LR and degraded SR values should not be identical but rather similar.Spatial consistency
Measured again from the comparison of the LR and SR images, ground control points are obtained using LightGlue + DISK. The difference between the reference points and a first-order polynomial is then calculated.High-frequency
Measured from the comparison of LR and SR images, we calculate the MTF between the LR-SR pairs to assess the improvement in ground sampling distance. The MTF curve represents the system's response in different spatial frequencies. A higher MTF value at a specific frequency indicates a better resolution and sharper image details. The reported metric is the comparison of the area under the MTF curve between the LR and SR images, from the Nyquist frequency of Sentinel2 to the super-resolved image.Omission
Error related to the inability to represent the actual high-frequency information from the landscape. The systematic error must be first removed.Hallucinations
Hallucinations refer to errors that are solely related to high-frequency information inducted by the super-resolution model, with no correlation to the real continuous space.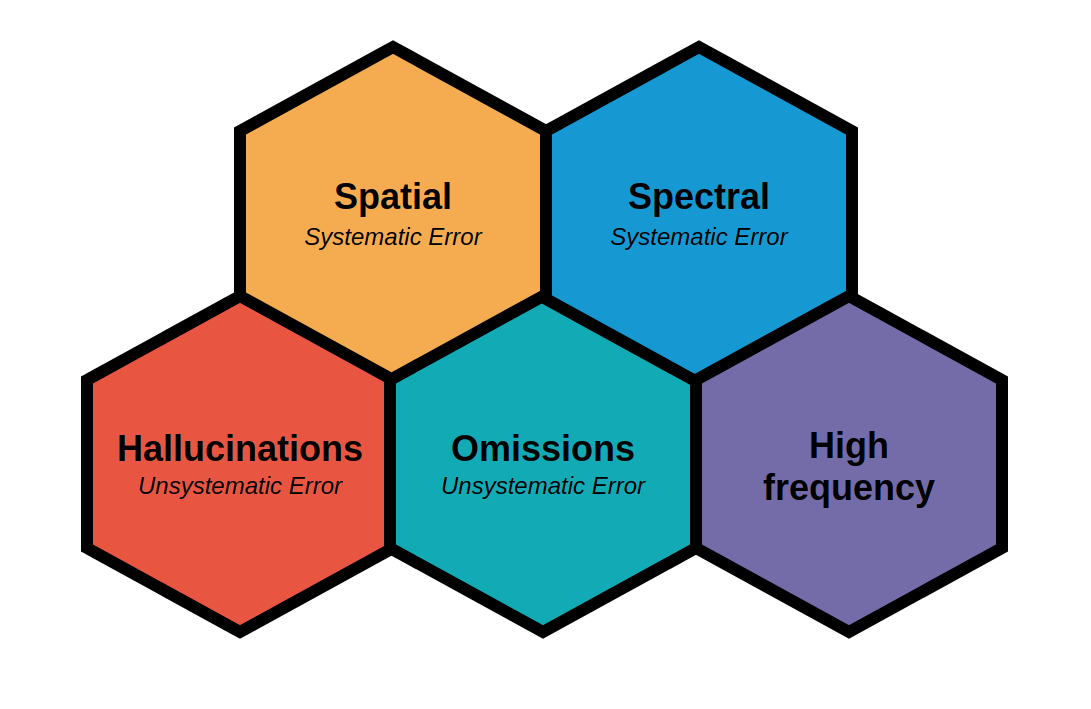
Installation
Install the latest version from PyPI:
pip install opensr-test
Upgrade opensr-test by running:
pip install -U opensr-test
Install the latest version from conda-forge:
conda install -c conda-forge opensr-test
Install the latest dev version from GitHub by running:
pip install git+https://github.com/ESAOpenSR/opensr-test
How does it work?
opensr-test needs either a PyTorch (torch.nn.Module, torch.jit.trace or torch.jit.script) or TensorFlow model. The following example shows how to run the benchmarks:
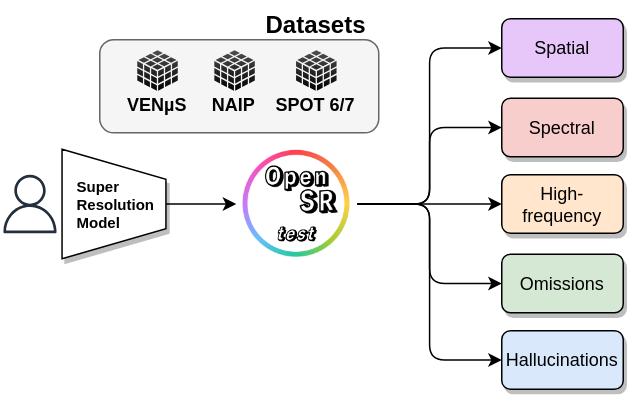
The following example shows how to run the benchmarks:
import torch
import opensr_test

# Load your model
model = torch.jit.load('/content/quantSRmodel.pt', map_location='cpu')

# Check if the model works
dataset = opensr_test.naip

opensr_test.check(model, dataset)
# { 'Spectral': 0.08, 'Spatial': 2.34, 'High-frequency': 1.32, 'Hallucination': 0.90, 'Omission': 1.03}
Pre-trained Models
Pre-trained models are available at various scales and hosted at the awesome huggingface_hub. By default the models were pretrained on DIV2K, a dataset of 800 high-quality (2K resolution) images for training, augmented to 4000 images and uses a dev set of 100 validation images (images numbered 801 to 900).
The leaderboard below shows the PSNR / SSIM metrics for each model at various scales on various test sets (Set5, Set14, BSD100, Urban100). The higher the better. All training was to 1000 epochs (some publications, like a2n, train to >1000 epochs in their experiments).
Scale x2
| Rank | Model | Params | Set5 | Set14 | BSD100 | Urban100 |
|---|---|---|---|---|---|---|
| 1 | drln-bam | 34m | 38.23/0.9614 | 33.95/0.9206 | 33.95/0.9269 | 32.81/0.9339 |
| 2 | edsr | 41m | 38.19/0.9612 | 33.99/0.9215 | 33.89/0.9266 | 32.68/0.9331 |
| 3 | msrn | 5.9m | 38.08/0.9609 | 33.75/0.9183 | 33.82/0.9258 | 32.14/0.9287 |
| 4 | mdsr | 2.7m | 38.04/0.9608 | 33.71/0.9184 | 33.79/0.9256 | 32.14/0.9283 |
| 5 | msrn-bam | 5.9m | 38.02/0.9608 | 33.73/0.9186 | 33.78/0.9253 | 32.08/0.9276 |
| 6 | edsr-base | 1.5m | 38.02/0.9607 | 33.66/0.9180 | 33.77/0.9254 | 32.04/0.9276 |
| 7 | mdsr-bam | 2.7m | 38/0.9607 | 33.68/0.9182 | 33.77/0.9253 | 32.04/0.9272 |
| 8 | awsrn-bam | 1.4m | 37.99/0.9606 | 33.66/0.918 | 33.76/0.9253 | 31.95/0.9265 |
| 9 | a2n | 1.0m | 37.87/0.9602 | 33.54/0.9171 | 33.67/0.9244 | 31.71/0.9240 |
| 10 | carn | 1.6m | 37.89/0.9602 | 33.53/0.9173 | 33.66/0.9242 | 31.62/0.9229 |
| 11 | carn-bam | 1.6m | 37.83/0.96 | 33.51/0.9166 | 33.64/0.924 | 31.53/0.922 |
| 12 | pan | 260k | 37.77/0.9599 | 33.42/0.9162 | 33.6/0.9235 | 31.31/0.9197 |
| 13 | pan-bam | 260k | 37.7/0.9596 | 33.4/0.9161 | 33.6/0.9234 | 31.35/0.92 |
Scale x3
| Rank | Model | Params | Set5 | Set14 | BSD100 | Urban100 |
|---|---|---|---|---|---|---|
| 1 | drln-bam | 34m | 35.3/0.9422 | 31.27/0.8624 | 29.78/0.8224 | 29.82/0.8828 |
| 1 | edsr | 44m | 35.31/0.9421 | 31.18/0.862 | 29.77/0.8224 | 29.75/0.8825 |
| 1 | msrn | 6.1m | 35.12/0.9409 | 31.08/0.8593 | 29.67/0.8198 | 29.31/0.8743 |
| 2 | mdsr | 2.9m | 35.11/0.9406 | 31.06/0.8593 | 29.66/0.8196 | 29.29/0.8738 |
| 3 | msrn-bam | 5.9m | 35.13/0.9408 | 31.06/0.8588 | 29.65/0.8196 | 29.26/0.8736 |
| 4 | mdsr-bam | 2.9m | 35.07/0.9402 | 31.04/0.8582 | 29.62/0.8188 | 29.16/0.8717 |
| 5 | edsr-base | 1.5m | 35.01/0.9402 | 31.01/0.8583 | 29.63/0.8190 | 29.19/0.8722 |
| 6 | awsrn-bam | 1.5m | 35.05/0.9403 | 31.01/0.8581 | 29.63/0.8188 | 29.14/0.871 |
| 7 | carn | 1.6m | 34.88/0.9391 | 30.93/0.8566 | 29.56/0.8173 | 28.95/0.867 |
| 8 | a2n | 1.0m | 34.8/0.9387 | 30.94/0.8568 | 29.56/0.8173 | 28.95/0.8671 |
| 9 | carn-bam | 1.6m | 34.82/0.9385 | 30.9/0.8558 | 29.54/0.8166 | 28.84/0.8648 |
| 10 | pan-bam | 260k | 34.62/0.9371 | 30.83/0.8545 | 29.47/0.8153 | 28.64/0.861 |
| 11 | pan | 260k | 34.64/0.9376 | 30.8/0.8544 | 29.47/0.815 | 28.61/0.8603 |
Scale x4
| Rank | Model | Params | Set5 | Set14 | BSD100 | Urban100 |
|---|---|---|---|---|---|---|
| 1 | drln | 35m | 32.55/0.899 | 28.96/0.7901 | 28.65/0.7692 | 26.56/0.7998 |
| 2 | drln-bam | 34m | 32.49/0.8986 | 28.94/0.7899 | 28.63/0.7686 | 26.53/0.7991 |
| 3 | edsr | 43m | 32.5/0.8986 | 28.92/0.7899 | 28.62/0.7689 | 26.53/0.7995 |
| 4 | msrn | 6.1m | 32.19/0.8951 | 28.78/0.7862 | 28.53/0.7657 | 26.12/0.7866 |
| 5 | msrn-bam | 5.9m | 32.26/0.8955 | 28.78/0.7859 | 28.51/0.7651 | 26.10/0.7857 |
| 6 | mdsr | 2.8m | 32.26/0.8953 | 28.77/0.7856 | 28.53/0.7653 | 26.07/0.7851 |
| 7 | mdsr-bam | 2.9m | 32.19/0.8949 | 28.73/0.7847 | 28.50/0.7645 | 26.02/0.7834 |
| 8 | awsrn-bam | 1.6m | 32.13/0.8947 | 28.75/0.7851 | 28.51/0.7647 | 26.03/0.7838 |
| 9 | edsr-base | 1.5m | 32.12/0.8947 | 28.72/0.7845 | 28.50/0.7644 | 26.02/0.7832 |
| 10 | a2n | 1.0m | 32.07/0.8933 | 28.68/0.7830 | 28.44/0.7624 | 25.89/0.7787 |
| 11 | carn | 1.6m | 32.05/0.8931 | 28.67/0.7828 | 28.44/0.7625 | 25.85/0.7768 |
| 12 | carn-bam | 1.6m | 32.0/0.8923 | 28.62/0.7822 | 28.41/0.7614 | 25.77/0.7741 |
| 13 | pan | 270k | 31.92/0.8915 | 28.57/0.7802 | 28.35/0.7595 | 25.63/0.7692 |
| 14 | pan-bam | 270k | 31.9/0.8911 | 28.54/0.7795 | 28.32/0.7591 | 25.6/0.7691 |
| 15 | han | 16m | 31.21/0.8778 | 28.18/0.7712 | 28.09/0.7533 | 25.1/0.7497 |
| 16 | rcan-bam | 15m | 30.8/0.8701 | 27.91/0.7648 | 27.91/0.7477 | 24.75/0.7346 |
Release history Release notifications | RSS feed


Download files
Download the file for your platform. If you're not sure which to choose, learn more about installing packages.
Source Distribution
Built Distribution
Filter files by name, interpreter, ABI, and platform.
If you're not sure about the file name format, learn more about wheel file names.
Copy a direct link to the current filters
File details
Details for the file opensr-test-0.0.3.tar.gz.
File metadata
- Download URL: opensr-test-0.0.3.tar.gz
- Upload date:
- Size: 7.5 kB
- Tags: Source
- Uploaded using Trusted Publishing? No
- Uploaded via: twine/4.0.1 CPython/3.8.10
File hashes
| Algorithm | Hash digest | |
|---|---|---|
| SHA256 |
666dbaa615ee6dfb977ffa20c5f68a01cbb58581d86e7c30c1ffb9253e5156f2
|
|
| MD5 |
4af3787f655a9ec48a426c6ddff1865b
|
|
| BLAKE2b-256 |
086578dec142c8298a5d064668fd588c4ffac950d1f390a80afe9cae6f9a86cd
|
File details
Details for the file opensr_test-0.0.3-py3-none-any.whl.
File metadata
- Download URL: opensr_test-0.0.3-py3-none-any.whl
- Upload date:
- Size: 6.9 kB
- Tags: Python 3
- Uploaded using Trusted Publishing? No
- Uploaded via: twine/4.0.1 CPython/3.8.10
File hashes
| Algorithm | Hash digest | |
|---|---|---|
| SHA256 |
b400af3ce373241cfa0a49a9f1b4905cbef5fc67f0158bb7a3e3a1a955cd434c
|
|
| MD5 |
d6242d3f58ae21942ceceb590e4b8438
|
|
| BLAKE2b-256 |
df334cc55cc40ff4c7c808296c12a31b90cb5d0a8daf63a29a8f896ea51a3a4b
|


