
OptBinning (slim fork)





Attribution
This is a maintenance fork of OptBinning, created and authored by Guillermo Navas-Palencia (g.navas.palencia@gmail.com).
The mathematical formulation, the algorithms and essentially all of the code in this repository are their work, published under the Apache License 2.0 and reproduced here under its terms. The per-module copyright headers are theirs and are kept intact. This fork was branched at upstream 0.21.0 and contributes no new algorithms — it exists only to keep that work running on current Python and a current dependency stack. If OptBinning is useful to you, the credit and the citations belong upstream.
Upstream documentation (this fork does not carry its own copy): http://gnpalencia.org/optbinning/ · Upstream repository: https://github.com/guillermo-navas-palencia/optbinning
OptBinning is a Python library implementing a rigorous and flexible mathematical programming formulation to solve the optimal binning problem for a binary, continuous and multiclass target, incorporating constraints not previously addressed.
About this fork
Despite the name, optbinning-slim is not a reduced version of the library.
"Slim" refers to the dependency and packaging surface, not the feature set.
What this fork changes
| Python | Requires >= 3.13. CI runs 3.13 and 3.14 on Linux, Windows and macOS. Upstream's matrix stops at 3.12. |
| Dependencies | Version floors raised to a current, coherent stack (see Dependencies). The ortools>=9.4,<9.12 upper cap was dropped — the fork tracks current OR-Tools. |
| Compatibility fixes | Fixes for behaviour changes in pandas 3.0 (string dtype detection in BinningProcess), NumPy 2.x and scikit-learn 1.7+. |
| Piecewise solvers | "clarabel" is accepted as a solver for the piecewise estimators, alongside "ecos", "osqp", "direct", "scs" and "auto". As of ropwr 1.2, "auto" resolves to "clarabel"; before that it resolved to "ecos". |
| Packaging | Metadata moved from setup.py to a PEP 621 pyproject.toml, which is now the only place dependencies are declared — requirements.txt and test_requirements.txt are gone, replaced by environment.yml for conda users. matplotlib is a hard requirement rather than an implicit one; ecos moved into the test extra, because test_binning_piecewise.py::test_solvers needs it. The distribution is named optbinning-slim on PyPI while the import package stays optbinning. |
| LocalSolver | solver="ls" and the LocalSolver integration were removed. localsolver is not on PyPI and the hexaly package that succeeds it provides no localsolver module, so the option was unusable for anyone installing this package. OptimalBinning accepts ("cp", "mip"), as every other estimator already did. |
| Documentation | Upstream's Sphinx sources (doc/) are not carried in this fork — they describe the library to its users and are maintained upstream. Read them at http://gnpalencia.org/optbinning/, or in the upstream repository. Docstrings in this repository remain the source of truth for behaviour and are kept current. |
Release notes are in CHANGELOG.md. Divergences from upstream, and the
reasoning behind each, are recorded in reports/DECISIONS.md so
that a future merge with upstream stays tractable.
What this fork does not change
No subsystem has been removed. Every one upstream ships is still here and still
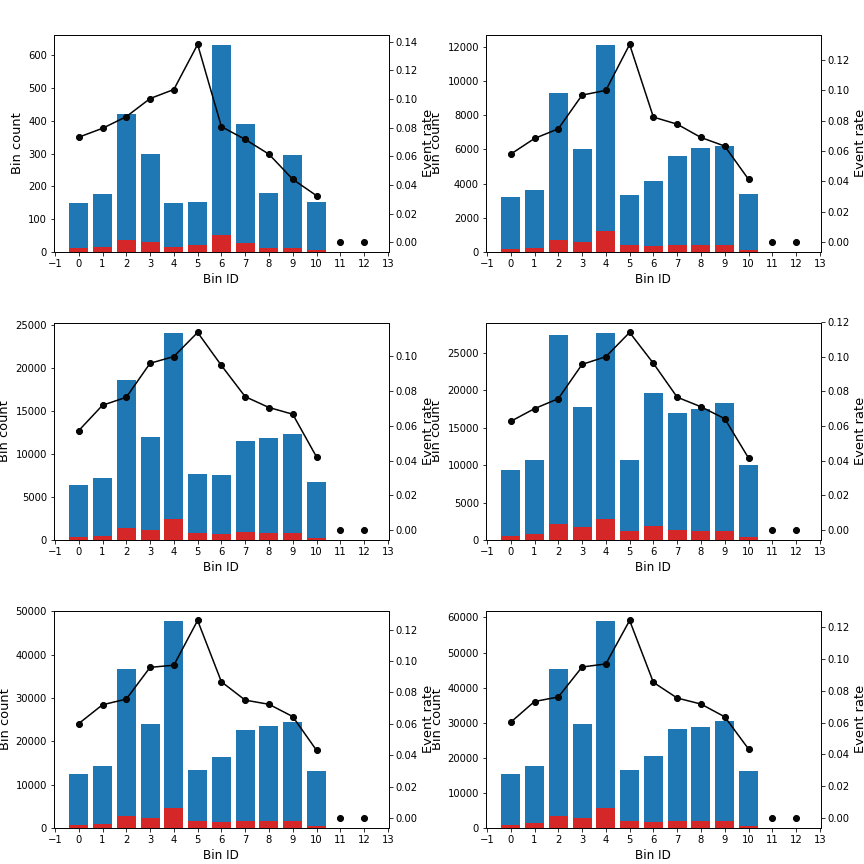
tested: distributed / sketch binning, uncertainty (scenario-based binning),
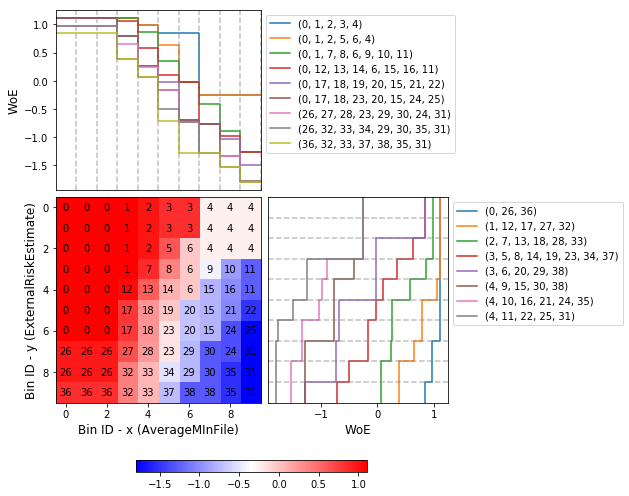
counterfactual explanations, multidimensional (2D) binning, piecewise binning, and
all plotting methods. Everything exported from optbinning/__init__.py is public API and
is expected to keep working:
BinningProcess          BinningProcessSketch      ContinuousOptimalBinning
ContinuousOptimalBinning2D                        ContinuousOptimalPWBinning
MDLP                    MulticlassOptimalBinning  OptimalBinning
OptimalBinning2D        OptimalBinningSketch      OptimalPWBinning
SBOptimalBinning        Scorecard
The one option that did go is solver="ls", whose dependency cannot be installed at all
— see the table above. No new algorithms are added either. Behaviour is intended to match
upstream except where a fix was required, and every such case is documented in
CHANGELOG.md.
Installation
On PyPI the distribution is named optbinning-slim; the import name stays
optbinning, so the fork is a drop-in replacement for upstream. For that same reason
optbinning and optbinning-slim must not be installed into the same environment —
they claim the same import package.
The package is prepared for release but has not been uploaded yet (as of 2026-08-23). Until it is, install from source:
git clone https://github.com/dennisdeh/optbinning-slim.git
cd optbinning-slim
pip install -e .
For the upstream release, use pip install optbinning instead.
With conda
environment.yml builds the optbinning development environment —
the interpreter from conda-forge, every project dependency resolved from
pyproject.toml:
conda env create -f environment.yml
conda activate optbinning
Optional extras
pip install -e ".[distributed]"        # batch and stream binning (sketch algorithms)
pip install -e ".[ecos]"               # the ECOS solver, used by piecewise binning
pip install -e ".[test]"               # test suite, linting and coverage
pip install -e ".[dev]"                # all of the above, plus build and twine
Dependencies
Requires Python >= 3.13. Dependencies are declared only in
pyproject.toml — there is no requirements.txt to keep in sync.
| Package | This fork | Upstream 0.21.0 |
|---|---|---|
matplotlib |
>=3.10 |
(unpinned) |
numpy |
>=2.3 |
>=1.16.1 |
ortools |
>=9.14 |
>=9.4,<9.12 |
pandas |
>=2.3 |
(unpinned) |
ropwr |
>=1.2 |
>=1.0.0 |
scikit-learn |
>=1.7 |
>=1.6.0 |
scipy |
>=1.15 |
>=1.6.0 |
Extras: distributed → pympler, tdigest. ecos → ecos.
test → coverage, ecos, flake8, pyarrow, pympler, pytest, tdigest.
dev → all extras plus build, twine.
Building a release
python -m build                   # sdist + wheel into dist/
python -m twine check --strict dist/*
python -m twine upload dist/*     # requires a PyPI token
Testing
Run the suite from the repository root — several tests write to relative paths
under tests/results/.
pytest                                                       # full suite
flake8 . --count --select=E9,F63,F7,F82 --show-source --statistics
Current status — measured 2026-08-23 on Python 3.13.15:
| Result | 212 passed, 0 failed (9 warnings) |
| Test modules | 20 |
| Wall clock | 188 s (binning problems are real solver runs; the suite is not instant) |
| Statement coverage | 89% — 11,301 statements, 1,244 uncovered |
| Lint gate | flake8 --select=E9,F63,F7,F82 → 0 issues |
Verified against: numpy 2.5.2, pandas 3.0.5, scipy 1.18.1, scikit-learn 1.9.0, ortools 9.15.6755, matplotlib 3.11.1, ropwr 1.2.0, ecos 2.0.14.
Coverage by subsystem:
| Area | Coverage |
|---|---|
scorecard/ (scorecard, monitoring, plots, counterfactual) |
94% |
binning/multidimensional/ (2D binning) |
92% |
binning/piecewise/ |
92% |
binning/distributed/ (sketch algorithms) |
86% |
binning/uncertainty/ (scenario binning) |
96% |
Core estimators (binning.py, continuous_binning.py, binning_process.py) |
82–93% |
| Overall | 89% |
The lowest-covered modules are binning/piecewise/binning_information.py (69%),
binning/multidimensional/mip_2d.py (73%) and binning/distributed/bsketch.py (75%) —
reporting paths and solver-specific branches that the default configuration does not
exercise. binning/mdlp.py and binning/distributed/plots.py, both largely untested
upstream, are now at 100%.
The suite is fully offline — no network access and no credentials are required.
Fixtures live in tests/data/ (breast_cancer.csv, boston_housing.csv,
breast_cancer.parquet). The distributed extra (tdigest, pympler) and ecos gate
whole test modules: without them those modules fail to import rather than skipping, so
install the extras before reporting a failure.
Open defects and planned improvements are tracked in
reports/OPEN_ITEMS.md and
reports/IMPROVEMENT_SUGGESTIONS.md.
Getting started
The library follows the scikit-learn contract — fit / transform / fit_transform —
plus the optbinning-specific binning_table, splits, status and information().
Upstream's documentation and tutorials apply unchanged to this fork:
- Optimal binning tutorials
- Binning process tutorials
- Scorecard and counterfactual tutorials
- Optimal piecewise binning tutorials
- Batch and stream optimal binning tutorials
- Optimal binning under uncertainty
- Optimal binning 2D
Papers
- Optimal binning: mathematical programming formulation — http://arxiv.org/abs/2001.08025
- Optimal counterfactual explanations for scorecard modelling — https://arxiv.org/abs/2104.08619
- Blog: Optimal binning for streaming data — http://gnpalencia.org/blog/2020/binning_data_streams/
 |
 |
 |
 |
Example: optimal binning with a binary target
Load a well-known dataset and choose a variable to discretize plus the binary target.
import pandas as pd
from sklearn.datasets import load_breast_cancer

data = load_breast_cancer()
df = pd.DataFrame(data.data, columns=data.feature_names)

variable = "mean radius"
x = df[variable].values
y = data.target
Instantiate an OptimalBinning object. We pass the variable name, its data type, and a
solver — here the constraint programming solver. Fit it with arrays x and y.
from optbinning import OptimalBinning

optb = OptimalBinning(name=variable, dtype="numerical", solver="cp")
optb.fit(x, y)
Check status and retrieve the optimal split points:
>>> optb.status
'OPTIMAL'

>>> optb.splits
array([11.42500019, 12.32999992, 13.09499979, 13.70499992, 15.04500008,
       16.92500019])
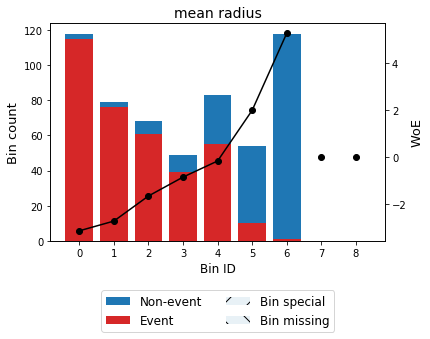
The optimal binning algorithms return a binning table, which displays the binned data
and several metrics for each bin. Call build(), which returns a pandas.DataFrame:
>>> optb.binning_table.build()
                   Bin  Count  Count (%)  Non-event  Event  Event rate       WoE        IV        JS
0        (-inf, 11.43)    118   0.207381          3    115    0.974576 -3.125170  0.962483  0.087205
1       [11.43, 12.33)     79   0.138840          3     76    0.962025 -2.710972  0.538763  0.052198
2       [12.33, 13.09)     68   0.119508          7     61    0.897059 -1.643814  0.226599  0.025513
3       [13.09, 13.70)     49   0.086116         10     39    0.795918 -0.839827  0.052131  0.006331
4       [13.70, 15.05)     83   0.145870         28     55    0.662651 -0.153979  0.003385  0.000423
5       [15.05, 16.93)     54   0.094903         44     10    0.185185  2.002754  0.359566  0.038678
6         [16.93, inf)    118   0.207381        117      1    0.008475  5.283323  2.900997  0.183436
7              Special      0   0.000000          0      0    0.000000  0.000000  0.000000  0.000000
8              Missing      0   0.000000          0      0    0.000000  0.000000  0.000000  0.000000
Totals                    569   1.000000        212    357    0.627417            5.043925  0.393784
(Output reproduced on this fork, 2026-08-23, with the dependency stack listed under Testing.)
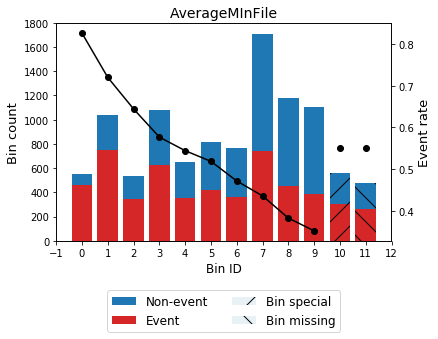
Use plot to visualize the histogram and the WoE or event rate curve. The Bin ID
corresponds to the binning table index.
>>> optb.binning_table.plot(metric="woe")
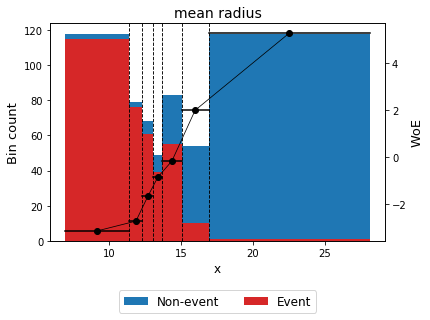
Optionally, show the binning plot with the actual bin widths:
>>> optb.binning_table.plot(metric="woe", style="actual", add_special=False, add_missing=False)
Now transform the original data into WoE or event rate values. Note that transform
returns a metric, not bin indices:
x_transform_woe = optb.transform(x, metric="woe")
x_transform_event_rate = optb.transform(x, metric="event_rate")
The analysis method performs a statistical analysis of the binning table, computing the
Gini index, Information Value (IV), Jensen-Shannon divergence and the quality score.
Several statistical significance tests between consecutive bins are also performed.
>>> optb.binning_table.analysis()
---------------------------------------------
OptimalBinning: Binary Binning Table Analysis
---------------------------------------------

  General metrics

    Gini index               0.87541620
    IV (Jeffrey)             5.04392547
    JS (Jensen-Shannon)      0.39378376
    Hellinger                0.47248971
    Triangular               1.25592041
    KS                       0.72862164
    HHI                      0.15727342
    HHI (normalized)         0.05193260
    Cramer's V               0.80066760
    Quality score            0.00000000

  Monotonic trend            descending

  Significance tests

    Bin A  Bin B  t-statistic       p-value  P[A > B]      P[B > A]
        0      1     0.252432  6.153679e-01  0.684380  3.156202e-01
        1      2     2.432829  1.188183e-01  0.948125  5.187465e-02
        2      3     2.345804  1.256207e-01  0.937874  6.212635e-02
        3      4     2.669235  1.023052e-01  0.955269  4.473083e-02
        4      5    29.910964  4.523477e-08  1.000000  9.814594e-12
        5      6    19.324617  1.102754e-05  0.999999  1.216668e-06
Print an overview of the option settings, problem statistics and the solution:
>>> optb.information(print_level=2)
optbinning (Version 0.22.0)
Copyright (c) 2019-2025 Guillermo Navas-Palencia, Apache License 2.0

  Begin options
    name                         mean radius   * U
    dtype                          numerical   * d
    prebinning_method                   cart   * d
    solver                                cp   * d
    divergence                            iv   * d
    max_n_prebins                         20   * d
    min_prebin_size                     0.05   * d
    min_n_bins                            no   * d
    max_n_bins                            no   * d
    min_bin_size                          no   * d
    max_bin_size                          no   * d
    min_bin_n_nonevent                    no   * d
    max_bin_n_nonevent                    no   * d
    min_bin_n_event                       no   * d
    max_bin_n_event                       no   * d
    monotonic_trend                     auto   * d
    min_event_rate_diff                    0   * d
    max_pvalue                            no   * d
    max_pvalue_policy            consecutive   * d
    gamma                                  0   * d
    class_weight                          no   * d
    cat_cutoff                            no   * d
    user_splits                           no   * d
    user_splits_fixed                     no   * d
    special_codes                         no   * d
    split_digits                          no   * d
    mip_solver                           bop   * d
    time_limit                           100   * d
    verbose                            False   * d
  End options

  Name    : mean radius
  Status  : OPTIMAL

  Pre-binning statistics
    Number of pre-bins                     9
    Number of refinements                  1

  Solver statistics
    Type                                  cp
    Number of booleans                    26
    Number of branches                    58
    Number of conflicts                    0
    Objective value                  5043922
    Best objective bound             5043922

  Timing
    Total time                          0.04 sec
    Pre-processing                      0.00 sec   (  0.33%)
    Pre-binning                         0.00 sec   (  5.54%)
    Solver                              0.04 sec   ( 93.03%)
      model generation                  0.03 sec   ( 85.61%)
      optimizer                         0.01 sec   ( 14.39%)
    Post-processing                     0.00 sec   (  0.30%)
Note on reproducibility. OR-Tools may return a different optimal solution of equal objective across versions and platforms. When comparing results, pin on the objective value and on
status, not on incidental split values.
Example: optimal binning 2D with a binary target
Choose two variables to discretize plus the binary target.
import pandas as pd
from sklearn.datasets import load_breast_cancer

data = load_breast_cancer()
df = pd.DataFrame(data.data, columns=data.feature_names)

variable1 = "mean radius"
variable2 = "worst concavity"
x = df[variable1].values
y = df[variable2].values
z = data.target
Instantiate OptimalBinning2D, passing the variable names and monotonic trends, then fit
with arrays x, y and z.
from optbinning import OptimalBinning2D

optb = OptimalBinning2D(name_x=variable1, name_y=variable2,
                        monotonic_trend_x="descending",
                        monotonic_trend_y="descending", min_bin_size=0.05)
optb.fit(x, y, z)
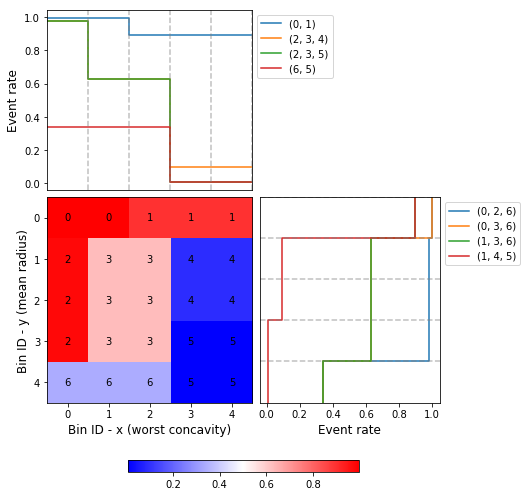
>>> optb.binning_table.build()
                Bin x         Bin y  Count  Count (%)  Non-event  Event  Event rate       WoE        IV        JS
0        (-inf, 13.70)  (-inf, 0.21)    219   0.384886          1    218    0.995434 -4.863346  2.946834  0.199430
1         [13.70, inf)  (-inf, 0.21)     48   0.084359          5     43    0.895833 -1.630613  0.157946  0.017811
2        (-inf, 13.09)  [0.21, 0.38)     48   0.084359          1     47    0.979167 -3.328998  0.422569  0.037010
3       [13.09, 15.05)  [0.21, 0.38)     46   0.080844         17     29    0.630435 -0.012933  0.000013  0.000002
4         [15.05, inf)  [0.21, 0.32)     32   0.056239         29      3    0.093750  2.789833  0.358184  0.034271
5         [15.05, inf)   [0.32, inf)    129   0.226714        128      1    0.007752  5.373180  3.229133  0.201294
6        (-inf, 15.05)   [0.38, inf)     47   0.082601         31     16    0.340426  1.182548  0.119920  0.014173
7              Special       Special      0   0.000000          0      0    0.000000  0.000000  0.000000  0.000000
8              Missing       Missing      0   0.000000          0      0    0.000000  0.000000  0.000000  0.000000
Totals                                  569   1.000000        212    357    0.627417            7.234600  0.503991
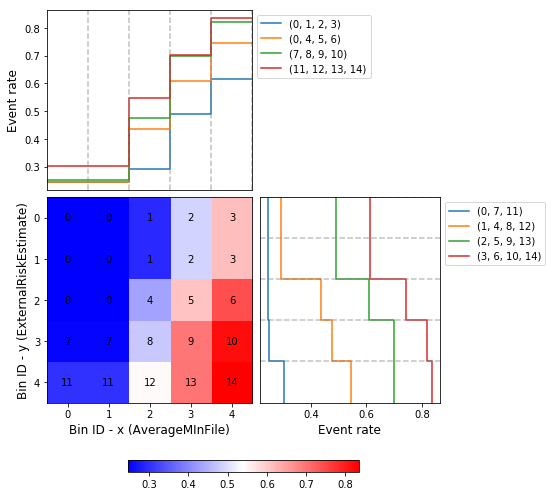
As with 1D binning, you can generate a 2D histogram to visualize WoE and event rate:
>>> optb.binning_table.plot(metric="event_rate")
Example: scorecard with a continuous target
Load the California housing dataset.
import pandas as pd

from sklearn.datasets import fetch_california_housing
from sklearn.linear_model import HuberRegressor

from optbinning import BinningProcess
from optbinning import Scorecard

data = fetch_california_housing()

target = "target"
variable_names = data.feature_names
X = pd.DataFrame(data.data, columns=variable_names)
y = data.target
Instantiate a binning process, an estimator, and a scorecard with a scaling method and reverse mode.
binning_process = BinningProcess(variable_names)

estimator = HuberRegressor(max_iter=200)

scorecard = Scorecard(binning_process=binning_process, estimator=estimator,
                      scaling_method="min_max",
                      scaling_method_params={"min": 0, "max": 100},
                      reverse_scorecard=True)

scorecard.fit(X, y)
Print an overview of the option settings, problem statistics, and the number of selected variables after the binning process.
>>> scorecard.information(print_level=2)
optbinning (Version 0.22.0)
Copyright (c) 2019-2025 Guillermo Navas-Palencia, Apache License 2.0

  Begin options
    binning_process                      yes   * U
    estimator                            yes   * U
    scaling_method                   min_max   * U
    scaling_method_params                yes   * U
    intercept_based                    False   * d
    reverse_scorecard                   True   * U
    rounding                           False   * d
    verbose                            False   * d
  End options

  Statistics
    Number of records                  20640
    Number of variables                    8
    Target type                   continuous

    Number of numerical                    8
    Number of categorical                  0
    Number of selected                     8

  Timing
    Total time                          2.31 sec
    Binning process                     1.83 sec   ( 79.00%)
    Estimator                           0.41 sec   ( 17.52%)
    Build scorecard                     0.08 sec   (  3.40%)
      rounding                          0.00 sec   (  0.00%)
Two scorecard styles are available: style="summary" shows the variable name, its bins
and the assigned points; style="detailed" adds information from the corresponding
binning table.
>>> scorecard.table(style="summary")
     Variable                 Bin     Points
0      MedInc        [-inf, 1.90)   9.869224
1      MedInc        [1.90, 2.16)  10.896940
2      MedInc        [2.16, 2.37)  11.482997
3      MedInc        [2.37, 2.66)  12.607805
4      MedInc        [2.66, 2.88)  13.609078
..        ...                 ...        ...
2   Longitude  [-118.33, -118.26)  10.470401
3   Longitude  [-118.26, -118.16)   9.092391
4   Longitude      [-118.16, inf)  10.223936
5   Longitude             Special   1.376862
6   Longitude             Missing   1.376862

[94 rows x 3 columns]
>>> scorecard.table(style="detailed")
     Variable  Bin id                 Bin  Count  Count (%)  ...  Zeros count       WoE        IV  Coefficient     Points
0      MedInc       0        [-inf, 1.90)   2039   0.098789  ...            0 -0.969609  0.095786     0.990122   9.869224
1      MedInc       1        [1.90, 2.16)   1109   0.053731  ...            0 -0.836618  0.044952     0.990122  10.896940
2      MedInc       2        [2.16, 2.37)   1049   0.050824  ...            0 -0.760779  0.038666     0.990122  11.482997
3      MedInc       3        [2.37, 2.66)   1551   0.075145  ...            0 -0.615224  0.046231     0.990122  12.607805
4      MedInc       4        [2.66, 2.88)   1075   0.052083  ...            0 -0.485655  0.025295     0.990122  13.609078
..        ...     ...                 ...    ...        ...  ...          ...       ...       ...          ...        ...
2   Longitude       2  [-118.33, -118.26)   1120   0.054264  ...            0 -0.011006  0.000597     0.566265  10.470401
3   Longitude       3  [-118.26, -118.16)   1127   0.054603  ...            0 -0.322802  0.017626     0.566265   9.092391
4   Longitude       4      [-118.16, inf)   6530   0.316376  ...            0 -0.066773  0.021125     0.566265  10.223936
5   Longitude       5             Special      0   0.000000  ...            0 -2.068558  0.000000     0.566265   1.376862
6   Longitude       6             Missing      0   0.000000  ...            0 -2.068558  0.000000     0.566265   1.376862

[94 rows x 14 columns]
Compute the score and the predicted target using the fitted estimator:
score = scorecard.score(X)
y_pred = scorecard.predict(X)
fetch_california_housingdownloads the dataset on first use, so this example needs network access. The test suite itself does not.
Example: counterfactual explanations for a scorecard
Changed in this fork. Upstream's version of this example called
sklearn.datasets.load_boston, which was removed in scikit-learn 1.2 — the example no longer runs as written. It is shown below using the Boston housing CSV bundled with this repository (tests/data/boston_housing.csv, loaded viatests.datasets), so it is offline and reproducible from a clone. The loader lives in the test package, not in the installed wheel, so run this from the repository root.
Build a scorecard, then fit a Counterfactual on the same data used to develop it.
import pandas as pd
from sklearn.linear_model import HuberRegressor

from optbinning import BinningProcess, Scorecard
from optbinning.scorecard import Counterfactual
from tests.datasets import load_boston

data = load_boston()
X = pd.DataFrame(data.data, columns=data.feature_names)
y = data.target

scorecard = Scorecard(binning_process=BinningProcess(list(data.feature_names)),
                      estimator=HuberRegressor(max_iter=200),
                      scaling_method="min_max",
                      scaling_method_params={"min": 0, "max": 100},
                      reverse_scorecard=True).fit(X, y)

cf = Counterfactual(scorecard=scorecard)
cf.fit(X)

query = X.iloc[0, :].to_frame().T
The scorecard predicts 24.88 for this sample. We want to know what would have to change for it to predict at least 30.
>>> query
      CRIM    ZN  INDUS  CHAS    NOX     RM   AGE   DIS  RAD    TAX  PTRATIO      B  LSTAT
0  0.00632  18.0   2.31   0.0  0.538  6.575  65.2  4.09  1.0  296.0     15.3  396.9   4.98

>>> scorecard.predict(query)
array([24.88133986])
Generate a single counterfactual explanation:
>>> cf.generate(query=query, y=30, outcome_type="continuous", n_cf=1, max_changes=3,
...             hard_constraints=["min_outcome"])

>>> cf.status
'OPTIMAL'

>>> cf.display(show_only_changes=True, show_outcome=True)
  CRIM ZN INDUS CHAS           NOX RM AGE DIS RAD               TAX PTRATIO                 B LSTAT    outcome
0    -  -     -    -  (-inf, 0.42)  -   -   -   -  [222.50, 267.50)       -  [393.71, 395.65)     -  30.063077
(Run on this fork, 2026-08-23. Exact values depend on the fitted estimator and on the solver; see the reproducibility note above.)
You can also request several counterfactuals at once, enforcing diversity on the feature values and restricting the search to actionable features:
>>> cf.generate(query=query, y=30, outcome_type="continuous", n_cf=3, max_changes=3,
...             hard_constraints=["diversity_values", "min_outcome"],
...             actionable_features=["CRIM", "NOX", "RM", "PTRATIO"])

>>> cf.status
'OPTIMAL'

>>> cf.display(show_only_changes=True, show_outcome=True)
Benchmarks
These are upstream's published benchmarks, reproduced here for reference. They were measured by the original author on the hardware and software versions stated below and have not been re-measured on this fork's dependency stack.
The following table shows how OptBinning compares to
scorecardpy 0.1.9.1.1 on a selection of
variables from the public
Home Credit Default Risk
Kaggle dataset (307,511 samples). The experiments were run on an Intel(R) Core(TM) i5-3317
CPU at 1.70 GHz, single core, on Linux. For scorecardpy, default settings were used, only
increasing bin_num_limit=20. For OptBinning, default settings were used
(max_n_prebins=20), only changing max_pvalue=0.05.
Using the shifted (by 1 second) geometric mean — the measure typically used in mathematical optimization benchmarks — OptBinning is 17x faster than scorecardpy, with an average IV increment of 12%, while also supporting many more constraints and monotonicity options.
| Variable | scorecardpy time | scorecardpy IV | optbinning time | optbinning IV |
|---|---|---|---|---|
| AMT_INCOME_TOTAL | 6.18 s | 0.010606 | 0.363 s | 0.011705 |
| NAME_CONTRACT_TYPE (C) | 3.72 s | 0.015039 | 0.148 s | 0.015039 |
| AMT_CREDIT | 7.10 s | 0.053593 | 0.634 s | 0.059311 |
| ORGANIZATION_TYPE (C) | 6.31 s | 0.063098 | 0.274 s | 0.071520 |
| AMT_ANNUITY | 6.51 s | 0.024295 | 0.648 s | 0.031179 |
| AMT_GOODS_PRICE | 6.95 s | 0.056923 | 0.401 s | 0.092032 |
| NAME_HOUSING_TYPE (C) | 3.57 s | 0.015055 | 0.140 s | 0.015055 |
| REGION_POPULATION_RELATIVE | 4.33 s | 0.026578 | 0.392 s | 0.035567 |
| DAYS_BIRTH | 5.18 s | 0.081270 | 0.564 s | 0.086539 |
| OWN_CAR_AGE | 4.85 s | 0.021429 | 0.055 s | 0.021890 |
| OCCUPATION_TYPE (C) | 4.24 s | 0.077606 | 0.201 s | 0.079540 |
| APARTMENTS_AVG | 5.61 s | 0.032247 (*) | 0.184 s | 0.032415 |
| BASEMENTAREA_AVG | 5.14 s | 0.022320 | 0.119 s | 0.022639 |
| YEARS_BUILD_AVG | 4.49 s | 0.016033 | 0.055 s | 0.016932 |
| EXT_SOURCE_2 | 5.21 s | 0.298463 | 0.606 s | 0.321417 |
| EXT_SOURCE_3 | 5.08 s | 0.316352 | 0.303 s | 0.334975 |
| TOTAL | 84.47 s | 1.130907 | 5.087 s | 1.247756 |
(C): categorical variable. (*): max p-value between consecutive bins > 0.05.
Binning of variables with a peak or valley monotonicity trend can benefit from
monotonic_trend="auto_heuristic", at the expense of a suboptimal solution in some cases:
| Variable | auto time | auto IV | heuristic time | heuristic IV |
|---|---|---|---|---|
| AMT_INCOME_TOTAL | 0.363 s | 0.011705 | 0.322 s | 0.011705 |
| AMT_CREDIT | 0.634 s | 0.059311 | 0.469 s | 0.058643 |
| AMT_ANNUITY | 0.648 s | 0.031179 | 0.505 s | 0.031179 |
| AMT_GOODS_PRICE | 0.401 s | 0.092032 | 0.299 s | 0.092032 |
| REGION_POPULATION_RELATIVE | 0.392 s | 0.035567 | 0.244 s | 0.035567 |
| TOTAL | 2.438 s | 0.229794 | 1.839 s | 0.229126 |
CPU time is reduced by 25% while losing less than 1% in IV. The difference grows with the number of bins — see the large-scale tutorial.
Contributing
Contribute algorithms and features upstream. New capabilities, bug fixes in the core formulation and documentation improvements belong at guillermo-navas-palencia/optbinning, where they benefit every user.
This fork accepts only what is in scope for it: Python and dependency compatibility, packaging, and keeping the test suite green. Before opening an issue here, please check whether it reproduces upstream.
Who uses OptBinning?
The following list is maintained upstream and reproduced here; to be added to it, send a PR to the upstream repository.
Jeitto · Bilendo · Aplazame · Praelexis Credit · ING · DBRS Morningstar · Loginom · Risika · Tamara · BBVA AI Factory · N26 · Home Credit International · Farm Credit Canada
Citation
If you use OptBinning in your research or work, please cite the original author's papers — not this fork:
@article{Navas-Palencia2020OptBinning,
  title     = {Optimal binning: mathematical programming formulation},
  author    = {Guillermo Navas-Palencia},
  year      = {2020},
  eprint    = {2001.08025},
  archivePrefix = {arXiv},
  primaryClass = {cs.LG},
  volume    = {abs/2001.08025},
  url       = {http://arxiv.org/abs/2001.08025},
}

@article{Navas-Palencia2021Counterfactual,
  title     = {Optimal Counterfactual Explanations for Scorecard modelling},
  author    = {Guillermo Navas-Palencia},
  year      = {2021},
  eprint    = {2104.08619},
  archivePrefix = {arXiv},
  primaryClass = {cs.LG},
  volume    = {abs/2104.08619},
  url       = {http://arxiv.org/abs/2104.08619},
}
License
Apache License 2.0 — see LICENSE.
Copyright (c) 2019-2025 Guillermo Navas-Palencia. Fork modifications are released under the same license.
1 maintainer

Metadata
1 maintainer
Release files for optbinning-slim 0.22.0
For a detailed explanation of source distributions (sdists) and built distributions (wheels), please see the package formats documentation.
Source distribution (sdist)
| File | Size | Uploaded | |
|---|---|---|---|
| optbinning_slim-0.22.0.tar.gz | 1.4 MB | Details |
Built distribution (wheel)
| File | Interpreter | ABI | Platform | Reset |
|---|---|---|---|---|
| optbinning_slim-0.22.0-py3-none-any.whl | Python 3 | none | any | Details |
Total release size: 1.6 MB
Release files / optbinning_slim-0.22.0.tar.gz
| Download URL | optbinning_slim-0.22.0.tar.gz |
|---|---|
| Size | 1.4 MB |
| Tags | Source |
|
SHA-256 checksum How to use checksums |
d60edf92d200f9536f318a6f749185cb1f774151ca9f2d6791a4723d56af829a
|
|
BLAKE2b-256 checksum How to use checksums |
626c85d9fd4b17211c842c1c451712b2bdbe41020d6e210a477bc0f7065d2794
|
| Upload date | |
|
Uploaded using Trusted Publishing? What is trusted publishing? |
No |
| Uploaded via |
twine/7.0.0 CPython/3.13.15
|
Release files / optbinning_slim-0.22.0-py3-none-any.whl
| Download URL | optbinning_slim-0.22.0-py3-none-any.whl |
|---|---|
| Size | 225.7 kB |
| Tags | Python 3 |
|
SHA-256 checksum How to use checksums |
ad1a2788cda8c981068966c2132264ef5b5ae63f4deac267825f90a8f5508228
|
|
BLAKE2b-256 checksum How to use checksums |
0c75810b3662df490e85b4d7cc2394b84ac36d539078969f853e08be142f950f
|
| Upload date | |
|
Uploaded using Trusted Publishing? What is trusted publishing? |
No |
| Uploaded via |
twine/7.0.0 CPython/3.13.15
|














