Add-on containing widgets for system dynamics operations
Project description
Orange3 System Dynamics Add-on
This is an add-on for Orange3 allowing to perform simulation using System Dynamic Modeling (SDM) mechanism.
Orange Data Mining
ODM (Orange Data Mining) is an open source machine learning and data visualization tool. It allows to build data analysis workflows visually, with a large, diverse toolbox.
We develop a list of widgets to be used in ODM, each widget has a functionality to be mainly applied for System Dynamic Modeling.
Installation
Orange3 and the SDM Addon must be installed in the same Python environment.
Orange 3
pip install pyQt5 PyQtWebEngine
pip install orange3
System Dynamics Addon
pip install orange-system-dynamics
Usage
Orange3 can be run using the following command:
orange-canvas
or
python -m orange.canvas
New widgets should appear in the toolbox bar under the System Dynamics section.
Widgets Description
System Dynamics
System dynamics (SD) is an approach to understanding the nonlinear behaviour of complex systems over time using stocks, flows, internal feedback loops, table functions and time delays.
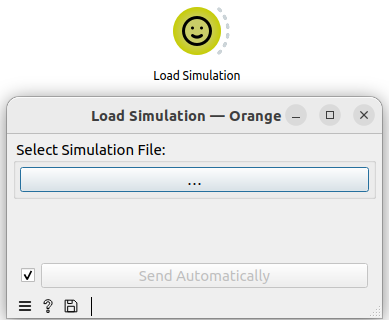
Load Simulation Widget
Load Simulation widget is used to load simulation models in .mdl or .xmile format,
it outputs the model for Simulation.
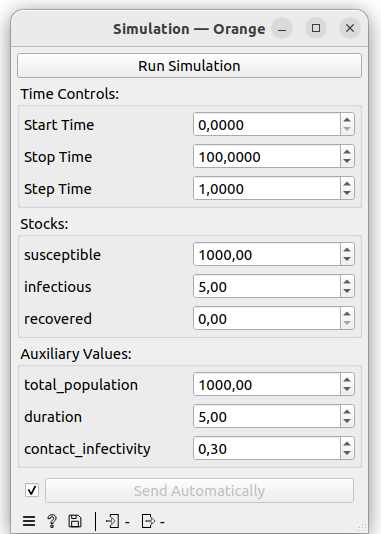
Simulation Widget
Once the model is loaded, the Simulation Widget is updated to show model's
variables grouped by:
- Time Controls: contains the initial time, the final time and defined time step
- Stocks: contains all model’s stocks, can be used to change any stock’s initial value
- Auxiliary Values: contains all the auxiliary values, can also be changed
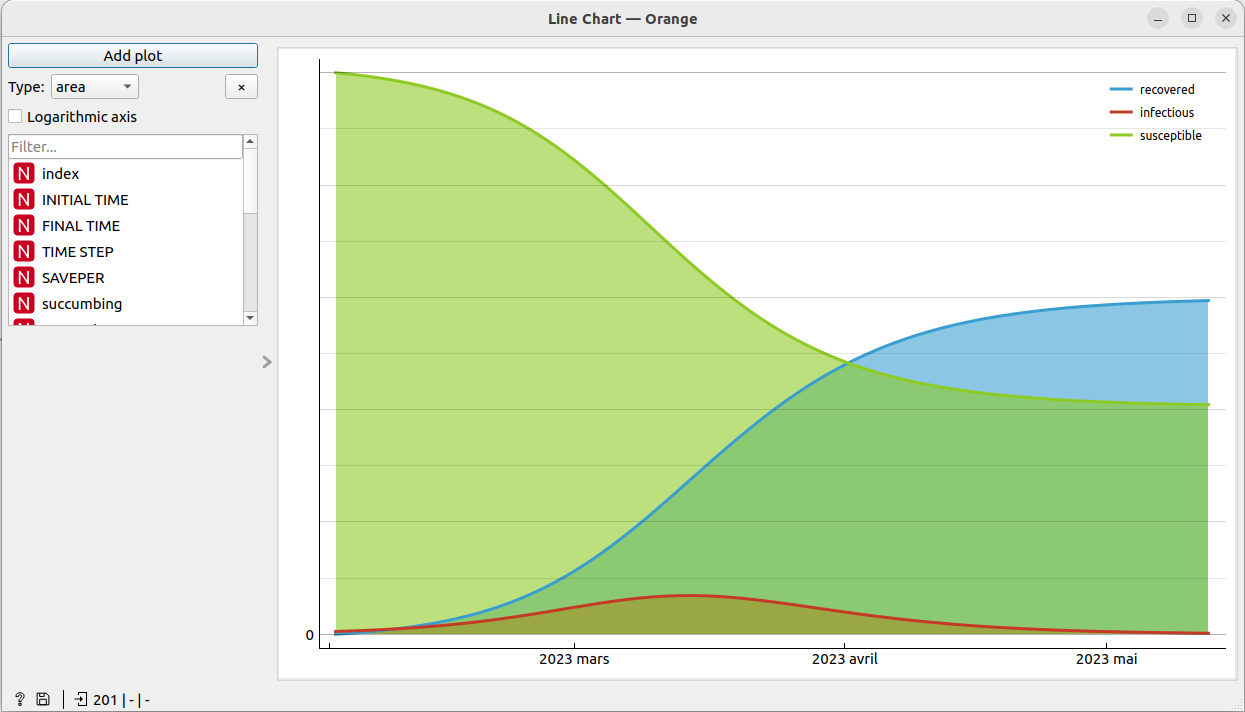
Once the Run Simulation button’s hit, the model is run, the widget outputs an
Orange Data Table, we use the Line Chart Widget to visualize results of
simulation:
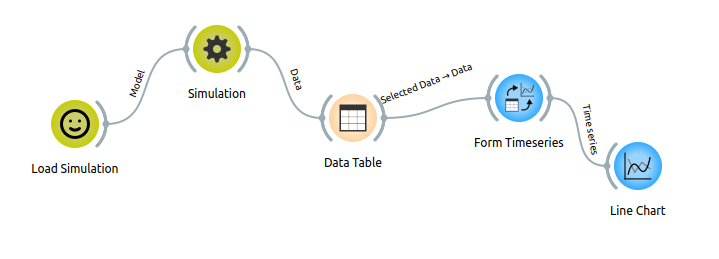
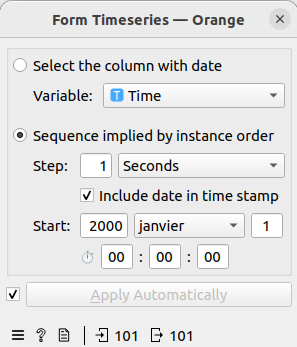
Other widgets have been used to perform step by step execution of simulation, by simply running the
results through Form Timeseries while indicating Time as the index variable:
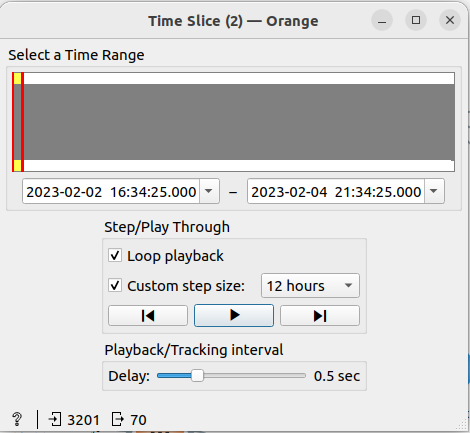
Next, using Time Slice which was adapted to commit a cumulative step by step simulation
to the Line Chart:
In another example; we run the simulation in two different regions:
-
Paris (France)
-
Algiers(Algeria) and Casablanca (Morocco)
with different simulation parameters each time, we variate the total population, contact infectivity and the stocks (infectious, recovered, susceptible). We simply add the results together using `Concatenate.
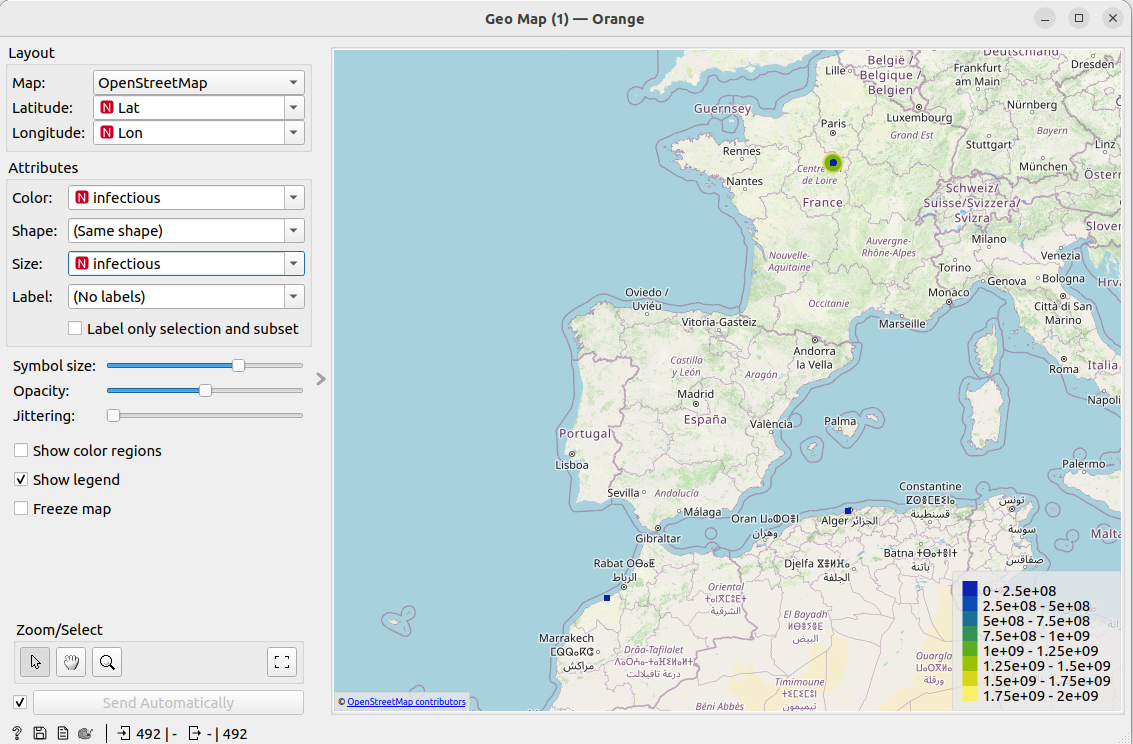
We can also show the results in Geo Map, after adding Latitude and Longitude information:
Agent Based Model
An agent-based model (ABM) is a computational model for simulating the actions and interactions of autonomous agents (both individual or collective entities such as organizations or groups) in order to understand the behavior of a system and what governs its outcomes.
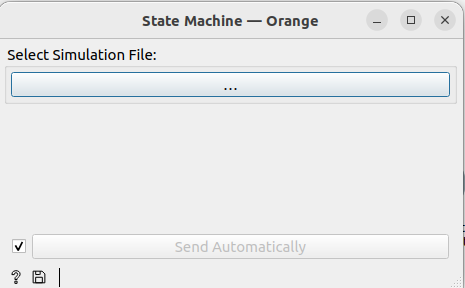
State Machine Widget
State Machine widget is used to read a .yaml file containing a statemachine.
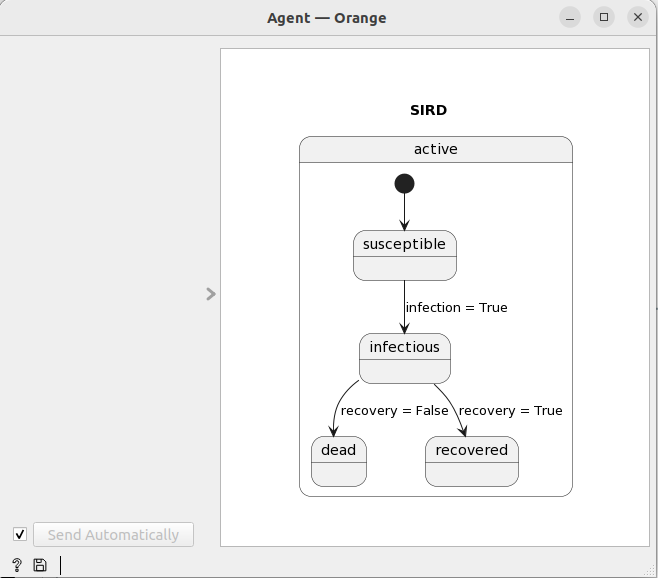
Agent Widget
̀Agent` widget creates an agent from a statemachine, it outputs the model used for creating multi-agent system environment.
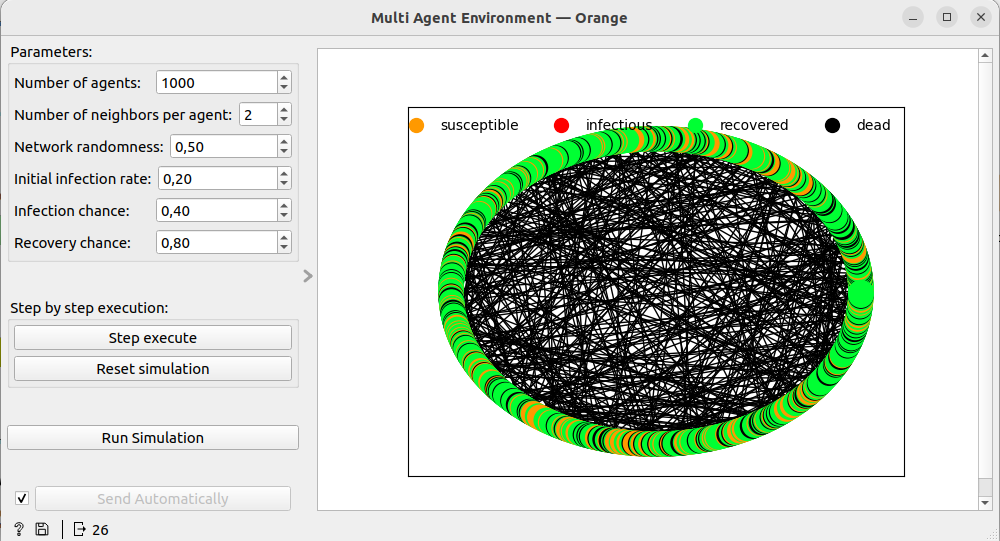
Multi Agent Environment is used to define interactions between agents
in a multi-agent system configuration.
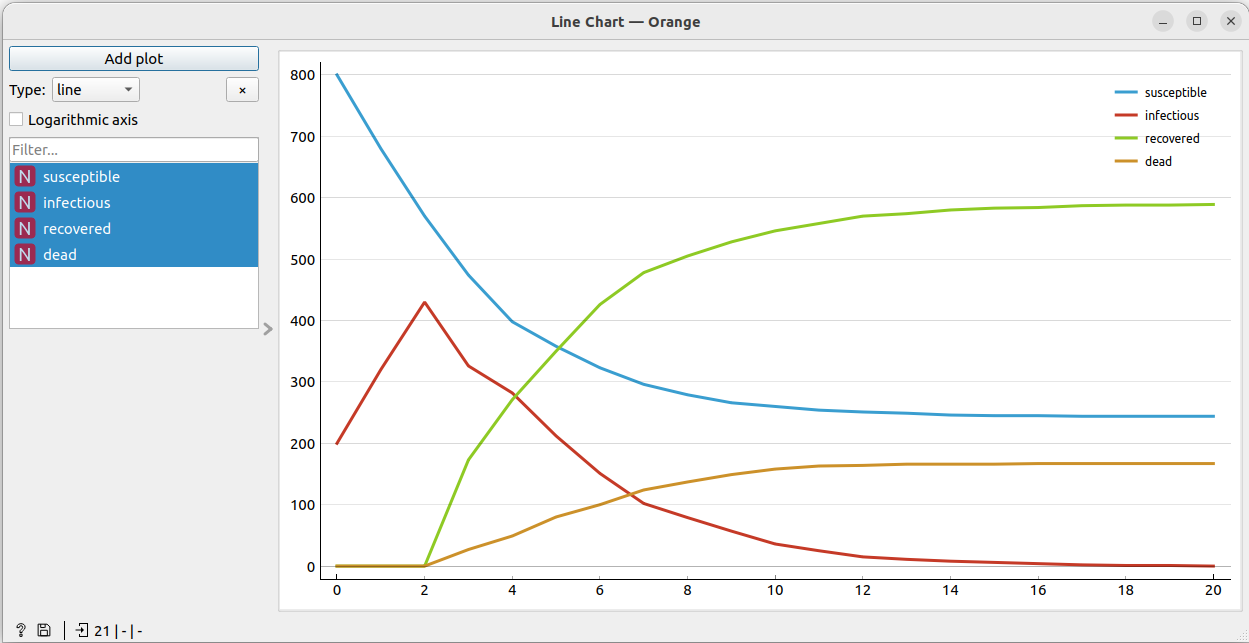
Once the Run Simulation button’s hit, the model is run, the widget outputs an
Orange Data Table, we use the Line Chart Widget to visualize results of
simulation:
Azure Digital Twin Model
Azure Digital Twins is an Internet of Things (IoT) platform that enables you to create a digital representation of real-world things, places, business processes, and people.
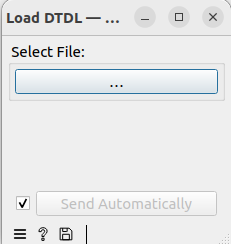
Load DTDL Widget
Load DTDL is used to load a JSON file containing the digital twin interface,
it generated a Twin Model to be used for creating Digital Twin(s).
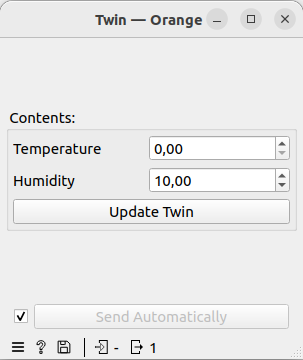
Twin Widget
Twin widget is used to create/update a twin from its model following DTDL.
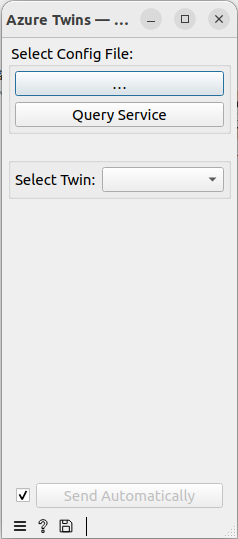
Azure Twins Widget
Azure Twins is used to retrieve available twins in MS Azure platform,
it needs a configuration file containing tenant id, client id and client secret and twins endpoint.
Here's a workflow example for using Orange widgets to create/update a digital twin from its DTDL description:
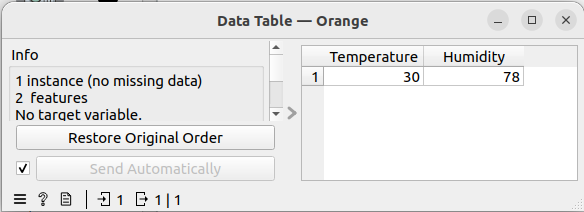
We can visualize our instance in a Data Table:
Project details
Release history Release notifications | RSS feed
Download files
Download the file for your platform. If you're not sure which to choose, learn more about installing packages.
Source Distribution
Built Distribution
Hashes for orange-system-dynamics-1.1.1.tar.gz
| Algorithm | Hash digest | |
|---|---|---|
| SHA256 | ecb1b0ee257dc87aa97ecc74b38aa0a2948b9ff17cb39b5320c7a73b19bd7db5 |
|
| MD5 | 3466e5120235862b735b6a97485d328e |
|
| BLAKE2b-256 | 15b333d67b1ecda57081feb43055b53bb6d0faa391714b1824df38fbbb007727 |
Hashes for orange_system_dynamics-1.1.1-py3-none-any.whl
| Algorithm | Hash digest | |
|---|---|---|
| SHA256 | 88a3436987112992b2454d84d39d3171981b8f698f155129b37fd2f5b1a6f85b |
|
| MD5 | c2440e5a18e63f3b42b06a6d756f0071 |
|
| BLAKE2b-256 | 1c22e80be5402e5a14f890b9c8d36f50aba092917bef4d963fa733fe8d8d158b |


