

OSP: Agentic Single-Cell QC and Annotation Pipeline
Better single-cell analysis starts with carefully reviewed samples.




Get started How it works FAQ Further reading
OSP combines sample-level quality control with AI-assisted cell-type annotation. It checks cell quality, finds cell populations, and uses an AI assistant to interpret marker genes and quality measurements together. You get proposed labels, supporting evidence, and a browser report to review before bringing samples together. OSP simply stands for "One Sample Pipeline".
OSP is part of ECA-RSI (Ensemble Cell Atlas: Recursive Self Improvement), an ecosystem for iterative quality review and cell-type annotation of single-cell datasets.
📰 News
-
2026-09-04: OSP 0.1.1. Backend-agnostic annotation agent with
--harness openai|deepseek|claude, explicit input and rerun contracts with atomic output writes, a pytest suite, and rewritten documentation with an interactive workflow diagram. See the full release notes. -
2026-09-02: OSP 0.1.0. First release on PyPI as
osp-sc.
🔬 Why start with one sample?
Better inputs make downstream results easier to trust. OSP adds a dedicated review before integration:
-
QC in the sample's own context. Adaptive checks use each sample's quality distribution, so differences in depth or contamination remain visible before pooling.
-
Problems are easier to locate. Within a single experimental batch, inspect suspicious populations without cross-sample batch differences complicating the picture.
-
Labels come with evidence. The AI assistant checks marker genes and QC profiles, can refine mixed clusters, and records uncertainty and proposed actions for your review.
Start with OSP, then use MSP: Multi-Sample Pipeline to integrate reviewed samples and continue annotation across samples.
📦 What you get
-
Cell-type labels with evidence. Proposed identities, supporting genes, uncertainties, and quality concerns for each cluster.
-
A report you can share. Quality measurements, cell populations, and annotation results together in one HTML file with embedded plots.
-
Data ready for further analysis. An analyzed H5AD with preserved raw counts, plus marker tables, individual plots, and a record of QC removals.
🔧 How it works
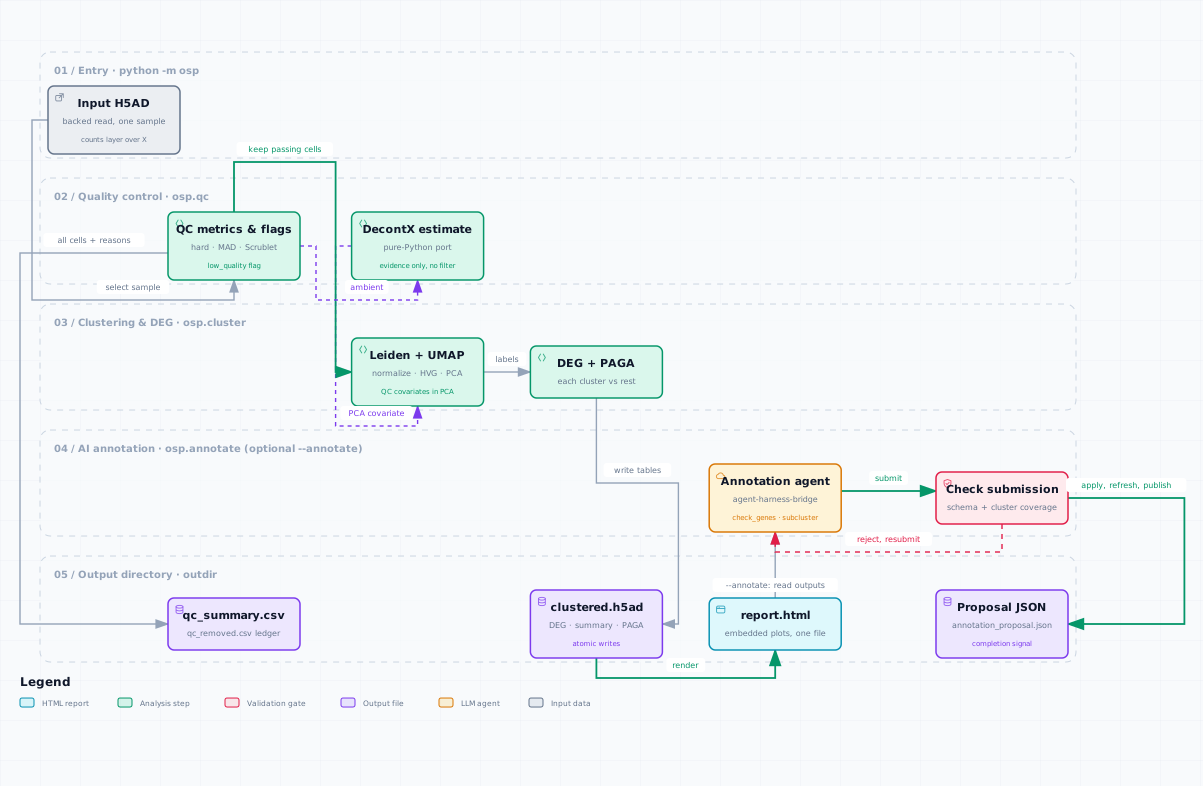
One run follows a single sample through the stages below. Click the diagram to open the interactive version, with pan, zoom, search, and guided views.
Quality control in context
OSP combines fixed and sample-adaptive thresholds with doublet detection and contamination estimates to assess cell quality in context.
QC measurements and filtering rules
OSP measures several aspects of cell quality together:
| Measurements | What they help assess |
|---|---|
| Total counts and number of detected genes | Library size and expression complexity |
| Fraction of counts in the top 20 genes | Whether expression is dominated by a small number of genes |
| Mitochondrial, ribosomal, and hemoglobin count fractions | Cell quality and expression composition in the context of the tissue |
| Scrublet doublet score and prediction | Possible capture of two cells in one droplet |
| DecontX contamination fraction and contaminating-gene rankings | How much ambient RNA is estimated, and which genes contribute to it |
| MALAT1 count fraction and dissociation-stress score | Additional cell-integrity and stress signals, when the relevant genes are present |
Filtering combines fixed thresholds with sample-adaptive thresholds. By default, fixed checks flag cells with fewer than 200 detected genes, fewer than 500 counts, or more than 15% mitochondrial counts. Adaptive checks flag observations more than five median absolute deviations (MADs) from the sample median for log1p counts, log1p gene counts, and the top-20-gene fraction. The additional mitochondrial flag requires a deviation of more than three MADs from the median and a mitochondrial fraction above 8%. Scrublet-predicted doublets are also flagged.
These checks combine baseline limits with the sample's own distribution. Their thresholds are configurable, and the report shows the resulting ranges and failure counts so you can assess whether they fit the biology. The full pipeline excludes cells flagged by these checks before cluster analysis and records the reasons. DecontX, ribosomal and hemoglobin fractions, MALAT1, and stress scores provide supporting evidence without directly triggering this filter.
Interpreting each cluster
The AI assistant combines marker genes, cluster relationships, and quality evidence to propose cell identities and flag populations for closer review.
How the assistant builds and checks each interpretation
The AI assistant is instructed to build and verify an explanation for every cluster using several kinds of evidence:
-
Place the cluster in context. Inspect the quality distributions and PAGA graph, which summarizes connections between cell populations. Connectivity provides context for interpreting related populations; marker and QC evidence support the biological interpretation.
-
Read differential expression with its coverage. OSP computes Wilcoxon differential expression for each primary cluster against the remaining cells, using the full normalized gene matrix. Marker tables include log fold changes, adjusted p-values, and the fractions of cells expressing each gene inside and outside the cluster (
pct1/pct2). These fractions help distinguish broadly expressed markers from signals carried by a small subset of cells. -
Actively verify the proposed identity. The assistant queries canonical and discriminating markers, including genes absent from the top DEG list. It receives mean expression and the percentage of cells expressing each queried gene across clusters.
-
Check whether quality explains the signal. Per-cluster QC summaries include medians and 90th percentiles. DecontX tables rank the estimated ambient contribution of individual genes from the difference between raw and corrected counts, helping assess whether apparent markers reflect contamination.
-
Resolve mixed populations more locally. When a cluster appears heterogeneous, the assistant can split it. OSP then computes DEG between the resulting subclusters within that parent population, giving a more focused comparison than the initial sample-wide contrast.
The assistant submits cell-type labels, supporting genes, confidence, unresolved questions, and QC proposals. OSP checks the submission's structure and cluster coverage before writing the results for review.
🚀 Get started
Recommended: let ECA-RSI coordinate the analysis
Prepare your data with ECA-PP, then let ECA-RSI organize samples and run OSP and the downstream analyses. ECA-PP handles counts validation, gene standardization, and sample or batch metadata identification. It can also recover counts from supported log-normalized data.
Follow the ECA-PP guide to prepare your data, then the ECA-RSI setup guide to run the workflow.
How ECA-PP recovers counts from log-normalized data
ECA-PP uses our stancounts method to recover integer counts from supported log1p-normalized matrices. It reverses the log transform and infers each cell's scaling factor from the discrete expression values, without requiring the original normalization target. Recovery depends on the retained count structure and precision; unsupported or ambiguous inputs are reported for review.
Run OSP on its own
For a standalone sample analysis, follow the three steps below.
1. Install
Use Python 3.10 or newer. Install the current GitHub version with AI support:
pip install "osp-sc[agent] @ git+https://github.com/chansigit/osp.git"
No R installation is required, including for DecontX and plotting.
Install a published release from PyPI
pip install "osp-sc[agent]"
The package is named osp-sc; its Python import and command use osp.
2. Prepare your input
Provide an H5AD file, the AnnData format commonly used with Scanpy, containing:
-
Raw expression counts in
layers["counts"], or inXif that layer is absent. Already normalized expression alone is not a counts input. -
A sample identifier for each cell, in
obs["sample"]by default.
The file may contain several samples; each run selects one. In the example
below, replace data.h5ad with your file and SAMPLE_A with a sample label
from your data. If your sample column has another name, add
--sample-col YOUR_COLUMN.
3. Run QC and AI annotation
The default AI backend uses Doubao through Volcengine Ark. Set your Ark API key, then run the analysis with annotation enabled. Replace the species and tissue below with your sample's context, and use a separate output directory for each sample.
export ARK_API_KEY="YOUR_ARK_API_KEY"
python -m osp data.h5ad --sample SAMPLE_A --outdir results/SAMPLE_A \
    --annotate --species mouse --tissue "bone marrow"
When the command finishes successfully, open
results/SAMPLE_A/report.html in your browser. If you ran OSP on a
remote server, download that HTML file to view it locally.
Start with the QC summary to see how many cells were retained and why. Then review the proposed cell types alongside their marker genes, quality profiles, and the assistant's notes.
The same directory also contains
| File | Contents |
|---|---|
clustered.h5ad |
Cells that passed QC, with raw counts preserved in a layer and proposed cell-type labels and QC actions after annotation. |
annotation_proposal.json |
Structured cell-type labels, supporting genes, uncertainties, and QC proposals. |
qc_removed.csv |
Cells removed during QC, with reasons and available quality measurements. |
de_top_genes_*.csv |
Genes that distinguish each primary cluster from the remaining cells. |
Review the annotation
The report brings proposed cell types together with their supporting genes, confidence, and open questions. Check whether the labels fit the marker expression and whether populations flagged for QC have a plausible biological explanation.
To annotate existing pipeline results, or rerun annotation without repeating QC and clustering:
python -m osp.annotate results/SAMPLE_A --species mouse --tissue "bone marrow"
See Does OSP remove cells? for how QC filtering and AI proposals affect your data.
❓ FAQ
Does OSP remove cells?
OSP preserves your original input file and writes a separate analysis
dataset. Cells flagged by the configured QC thresholds or doublet detection
are excluded from that output, with the reasons recorded in qc_removed.csv.
Review the thresholds against your sample's biology, especially for naturally
low-complexity populations.
The AI annotation stage only records proposed actions. Cells marked drop
by the assistant remain in OSP's clustered.h5ad for downstream processing.
For subsequent filtering, see MSP's output guide.
Can I use OSP without AI?
Yes. Omit --annotate to run QC, clustering, and report generation without
an API key. For installation without the AI dependencies, omit [agent]
from the package name.
Does DecontX change the expression matrix used for analysis?
OSP preserves raw counts and uses them as the starting point for normalization and clustering. DecontX stores corrected counts separately and provides contamination estimates for interpretation. Its contamination score does not directly trigger the initial QC filter.
Can I rerun an analysis?
Yes. Rerunning replaces results in the same output directory. Use a new directory to compare settings or preserve an earlier analysis, and check that a run finished successfully before relying on its output.
Can I use a large H5AD containing multiple samples?
Yes. The CLI loads only the selected sample's expression matrix into memory. Allow enough RAM for that sample and its analysis. For many samples, use ECA-RSI to manage the runs or adapt the Slurm job-array example.
📚 Further reading
Related projects in the ECA-RSI ecosystem
Use these companion projects to prepare inputs and continue from individual samples to a shared, iteratively reviewed analysis.
| Project | Role |
|---|---|
| ECA-PP | Prepare counts, gene identifiers, and metadata evidence for the analysis workflow. |
| OSP: One-Sample Pipeline | Review quality and cell populations within each sample before integration. |
| MSP: Multi-Sample Pipeline | Integrate reviewed samples, inspect populations across samples, and annotate cell types. |
| ZMIP: Zoom-In Pipeline | Refine retained cells within individual lineages after MSP, reviewing labels and remaining quality concerns. |
| ECA-RSI | Coordinate the wider curation workflow, including iterative review, annotation, and focused reanalysis. |
If these tools help your work, stars, issues, and feedback on the related repositories help others discover them and guide their development.
Documentation and examples
-
Input and output reference: matrix contents, output fields, Python return values, and completion rules.
-
Release notes: what changed in each version.
-
Interactive workflow diagram: the pipeline map above as an explorable page, generated from
docs/diagrams/osp-workflow.archify.json. -
Python sample driver: run one sample from a larger input file.
-
Slurm job-array example: process samples as separate cluster jobs.
-
Report an issue: describe a problem or suggest an improvement.
OSP is distributed under the MIT license. See third-party notices for included components.
1 maintainer

Metadata
1 maintainer
Release files for osp-sc 0.1.6
For a detailed explanation of source distributions (sdists) and built distributions (wheels), please see the package formats documentation.
Source distribution (sdist)
| File | Size | Uploaded | Provenance | |
|---|---|---|---|---|
| osp_sc-0.1.6.tar.gz | 82.1 kB | Without provenance | Details |
Built distribution (wheel)
| File | Interpreter | ABI | Platform | Reset |
|---|---|---|---|---|
| osp_sc-0.1.6-py3-none-any.whl | Python 3 | none | any | Details |
Total release size: 154.6 kB
Release files / osp_sc-0.1.6.tar.gz
| Download URL | osp_sc-0.1.6.tar.gz |
|---|---|
| Size | 82.1 kB |
| Tags | Source |
|
SHA-256 checksum How to use checksums |
3dc5f70b065eba345bae7b1fcb4bbb7312b83162e3fba23a670ec981ff3bb3cc
|
|
BLAKE2b-256 checksum How to use checksums |
4b725e0696cc83dd1c15ac9be8216904980fef68b15a1b0280587cea98e7ecd3
|
| Upload date | |
|
Uploaded using Trusted Publishing? What is trusted publishing? |
No |
| Uploaded via |
twine/7.0.0 CPython/3.12.1
|
Release files / osp_sc-0.1.6-py3-none-any.whl
| Download URL | osp_sc-0.1.6-py3-none-any.whl |
|---|---|
| Size | 72.5 kB |
| Tags | Python 3 |
|
SHA-256 checksum How to use checksums |
09147dabe05c09c92273e0bf6fe36a7bce6243ee8b5d7b6a3dff0dc54fc94a06
|
|
BLAKE2b-256 checksum How to use checksums |
2d9acb854b32aec94b8ec268b3e814d256bcbe917db876822d9d69c3ba21ab4b
|
| Upload date | |
|
Uploaded using Trusted Publishing? What is trusted publishing? |
No |
| Uploaded via |
twine/7.0.0 CPython/3.12.1
|
Security for osp-sc 0.1.6
Provenance
Provenance describes where a file came from. On PyPI, provenance is shared via attestations, which provide a verifiable record of the build or publishing details. View details, limitations and caveats.
No provenance found
None of the files in this release were uploaded with provenance metadata.
A note on package security
PyPI is a repository for distributing packages, not a service for auditing them. While third-party security researchers and our staff do their best to detect and remove malicious packages, PyPI cannot guarantee the quality, security or suitability of any given package.














