A package to visualize AMR data from the RAMSES code

Project description
Osiris
A python visualization utility for RAMSES data. It's purpose is to plot quick diagnostics while a simulation is running, and also produce publication grade figures.
Installation
You will need matplotlib installed on your system. Clone the Osiris repository and append its location to your PYTHONPATH.
From within ipython
#!python
import osiris
mydata = osiris.RamsesData(71,scale="au")
osiris.plot_slice(mydata.log_rho,direction="z",vec=mydata.velocity,dx=100)
Demo (see more demos here)
You can download the sample data here.
#!python
import osiris
# Load data
mydata = osiris.RamsesData(nout=71,center="max:density",scale="au")
# Create figure
fig = osiris.plt.figure()
ratio = 0.5
sizex = 20.0
fig.set_size_inches(sizex,ratio*sizex)
ax1 = fig.add_subplot(231)
ax2 = fig.add_subplot(232)
ax3 = fig.add_subplot(233)
ax4 = fig.add_subplot(234)
ax5 = fig.add_subplot(235)
ax6 = fig.add_subplot(236)
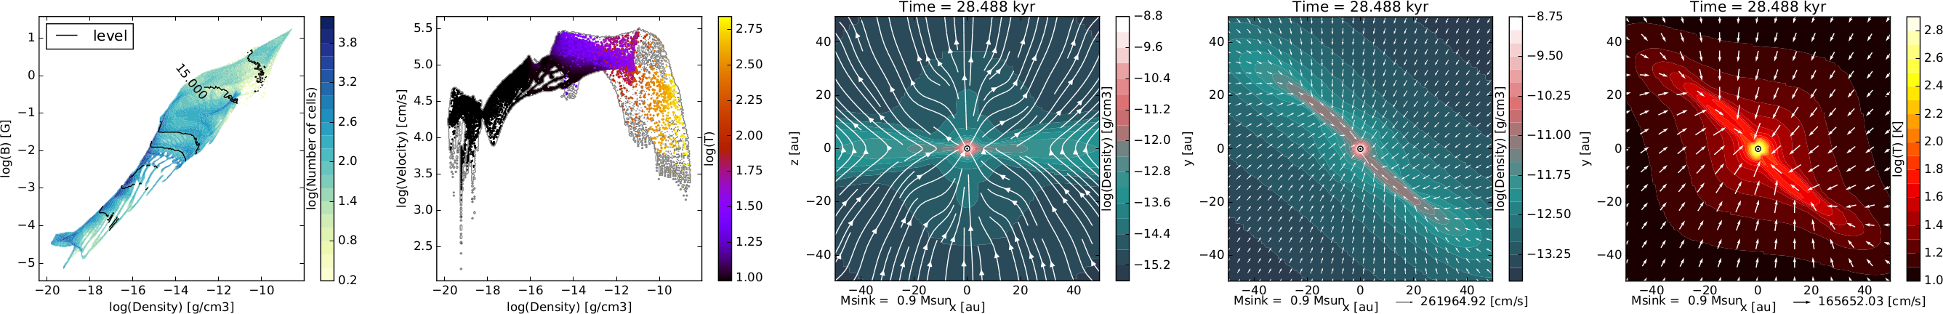
# Density vs B field with AMR level contours
osiris.plot_histogram(mydata.log_rho,mydata.log_B,axes=ax1,scalar=True,scalar_args={"cmap":"log,YlGnBu"},contour=mydata.level,contour_args={"fmt":"%i","label":True,"colors":"k","cmap":None,"levels":range(5,20),"cbar":False})
# Create new field with log of velocity
mydata.new_field(name="log_vel",operation="np.log10(np.sqrt(velocity_x**2+velocity_y**2+velocity_z**2))",unit="cm/s",label="log(Velocity)")
# Density vs log_vel in scatter mode with a grey outline
osiris.plot_histogram(mydata.log_rho,mydata.log_vel,axes=ax2,scatter=mydata.log_T,scatter_args={"iskip":100,"cmap":"gnuplot"},outline=True)
#x,z density slice with B field streamlines
osiris.plot_slice(mydata.density,direction="y",stream=mydata.B,dx=100,axes=ax3,scalar_args={"cmap":"log"})
# x,y density slice with velocity vectors in color
osiris.plot_slice(scalar=mydata.log_rho,direction="z",vec=mydata.velocity,dx=100,axes=ax4,vec_args={"cmap":"seismic","vskip":4})
# x,y temperature slice with velocity vectors
osiris.plot_slice(mydata.log_T,direction="z",vec=mydata.velocity,dx=100,axes=ax5,scalar_args={"cmap":"hot"},contour=mydata.level,contour_args={"fmt":"%i","label":True,"colors":"w","cmap":None,"levels":range(9,17)})
# Now update values with later snapshot
mydata.update_values(201)
# Re-plot x,y density slice with velocity vectors
osiris.plot_slice(mydata.log_rho,direction="z",vec=mydata.velocity,dx=100,axes=ax6)
fig.savefig("demo.pdf",bbox_inches="tight")
Have a problem or need a new feature?
Use the Issue tracker on the Bitbucket website.
Contributors
- Neil Vaytet (StarPlan/NBI)
- Tommaso Grassi (StarPlan/NBI)
- Matthias Gonzalez (CEA Saclay)
- Troels Haugbolle (StarPlan/NBI)
- Lucas Beeres
License
Osiris is distributed under the GPLv3 license.
Funding
Neil Vaytet gratefully acknowledges support from the European Commission through the Horizon 2020 Marie Sklodowska-Curie Actions Individual Fellowship 2014 programme (Grant Agreement no. 659706).

Release history Release notifications | RSS feed


Download files
Download the file for your platform. If you're not sure which to choose, learn more about installing packages.
Source Distribution
Built Distribution
Filter files by name, interpreter, ABI, and platform.
If you're not sure about the file name format, learn more about wheel file names.
Copy a direct link to the current filters
File details
Details for the file osyris-1.0.0.tar.gz.
File metadata
- Download URL: osyris-1.0.0.tar.gz
- Upload date:
- Size: 37.5 kB
- Tags: Source
- Uploaded using Trusted Publishing? No
- Uploaded via: twine/1.13.0 pkginfo/1.5.0.1 requests/2.22.0 setuptools/41.0.1 requests-toolbelt/0.9.1 tqdm/4.32.1 CPython/3.7.3
File hashes
| Algorithm | Hash digest | |
|---|---|---|
| SHA256 |
4aa1f82c4a7895092bb0109c63291b5fec13259f912eeebb20fa49c3d157789e
|
|
| MD5 |
73b92efeaf71c37e103d16d48853ea50
|
|
| BLAKE2b-256 |
1447f62a9e95950c9852b90872891f6490690d1816d81d97c18d7f40b62a95cc
|
File details
Details for the file osyris-1.0.0-py3-none-any.whl.
File metadata
- Download URL: osyris-1.0.0-py3-none-any.whl
- Upload date:
- Size: 51.6 kB
- Tags: Python 3
- Uploaded using Trusted Publishing? No
- Uploaded via: twine/1.13.0 pkginfo/1.5.0.1 requests/2.22.0 setuptools/41.0.1 requests-toolbelt/0.9.1 tqdm/4.32.1 CPython/3.7.3
File hashes
| Algorithm | Hash digest | |
|---|---|---|
| SHA256 |
81d28933ec632d9a90869af7586580059f245396fd75719b78a2f026867bf7a8
|
|
| MD5 |
a3c42d97a1d37a08439d3239e7f1b2ce
|
|
| BLAKE2b-256 |
284a77e1245eda56c442042a317ea97ee602e6fb842464319783e3d3a17edc44
|


