OWASP-compliant structured security event logger for Python applications.
Verified details
These details have been verified by PyPIProject links
GitHub Statistics
Maintainers

Project description
OWASP Logger


OWASP Logger is a Python library that provides structured, OWASP-compliant security logging.
It enables consistent and machine-readable logs for authentication, authorization, session management, and sensitive data access - built directly on top of the standard logging module.
📦 Installation
You can install the library with uv or pip:
# Standalone logger (without OpenTelemetry dependencies)
uv pip install owasp-logger
# With OpenTelemtry integration
uv pip install owasp-logger[otel]
🚀 Usage
Quick Start
from owasp_logger import OWASPLogger

# Initialize
owasp_log = OWASPLogger(appid="coconut.app")

# Log a security event
owasp_log.authn_login_fail(userid="banana-bob", description="Invalid password attempt")
Output (JSON structured log):
{
  "datetime": "2025-09-26T12:37:37.886421+02:00",
  "appid": "coconut.app",
  "event": "authn_login_fail:banana-bob",
  "level": "WARNING",
  "description": "Invalid password attempt"
}
Normal logging methods (e.g., .info(), .warning(), etc.) are all available and won't follow the OWASP format.
All logs emitted via the other functions are OWASP-structured.
See the examples/ folder for more demos:
nested_json.py- structured JSON loggingdedicated_audit_logs.py- dedicated audit log fileotel.py- logs with the OpenTelemetry instrumentationrandom_otel.py- synthetic OpenTelemetry logs for testing
OpenTelemetry Integration
Installing the package with the extra OpenTelemetry dependency (i.e., owasp-logger[otel]) allows you to emit OWASP-compliant logs in the OpenTelemetry format.
# Assuming you already instrumented your app with an OpenTelemetry logger
...

logger = getLogger("otel")  # OpenTelemetry logger

owasp_log = OWASPLogger(appid="secure-app", logger=logger)
owasp_log.authz_admin(
    userid="ananas-alex",
    admin_activity="watered_plants",
    description="Admin ananas-alex watered their plants",
))
Output (JSON structured log, in the OpenTelemetry format):
{
    "body": "Admin ananas-alex watered their plants",
    "severity_number": 13,
    "severity_text": "WARN",
    "attributes": {
        "owasp_event": {
            "datetime": "2025-10-12T18:24:33.887582+02:00",
            "appid": "example.appid",
            "event": "authz_admin:ananas-alex,watered_plants",
            "level": "WARNING",
            "description": "Admin ananas-alex watered their plants"
        },
        "code.file.path": "/home/aegis/Repositories/Canonical/owasp-logger/src/owasp_logger/logger.py",
        "code.function.name": "_log_event",
        "code.line.number": 35
    },
    "dropped_attributes": 0,
    "timestamp": "2025-10-12T16:24:33.887697Z",
    "observed_timestamp": "2025-10-12T16:24:33.887714Z",
    "trace_id": "0x00000000000000000000000000000000",
    "span_id": "0x0000000000000000",
    "trace_flags": 0,
    "resource": {
        "attributes": {
            "telemetry.sdk.language": "python",
            "telemetry.sdk.name": "opentelemetry",
            "telemetry.sdk.version": "1.33.1",
            "service.name": "example-service"
        },
        "schema_url": ""
    }
}
To learn how to instrument your Python application with OpenTelemetry, check out the official documentation:
🧾 Log Model
Each OWASP log event conforms to the structure presented in the OWASP Logging Vocabulary Cheat Sheet:
{
    # Required fields
    "datetime": "2021-01-01T01:01:01-0700",
    "appid": "foobar.netportal_auth",
    "event": "AUTHN_login_success:joebob1",
    "level": "INFO",
    # Optional fields
    "description": "User joebob1 login successfully",
    "useragent": "Mozilla/5.0 (Macintosh; Intel Mac OS X 10_14_6) AppleWebKit/537.36 (KHTML, like Gecko) Chrome/78.0.3904.108 Safari/537.36",
    "source_ip": "165.225.50.94",
    "host_ip": "10.12.7.9",
    "hostname": "portalauth.foobar.com",
    "protocol": "https",
    "port": "440",
    "request_uri": "/api/v2/auth/",
    "request_method": "POST",
    "region": "AWS-US-WEST-2",
    "geo": "USA"
}
This model is accurately reflected in the model.py file.
When an OWASP log is emitted as part of a structured log which is either OpenTelemetry format or an arbitrary JSON, its information will be nested under the owasp_event key.
🧭 Getting OWASP logs into Grafana Loki
OWASPLogger's logs can be sent to a Loki instance through OpenTelemetry Collector, which acts as a normalization and enrichment layer. The collector itself is available both as a charm and snap.
flowchart LR
    openstack[Openstack]
    sunbeam[Sunbeam]
    landscape[Landscape]
    landscapelog[["*Landscape log files*"]]
    cloud-init[["*cloud-init.log*"]]
    app["Any application"]
    otlplog[["*otlp.log*"]]
    something[Python application using<br>OTel SDK + OWASPLogger]
    cos-proxy["COS Proxy<br>**Charm**"]
    otelcol-snap[OpenTelemetry Collector **Snap**]
    otelcol-charm[OpenTelemetry Collector **Charm**]
    loki2[Loki 2]
    loki3[Loki 3]

    openstack -->|Logs are scraped by| cos-proxy
    sunbeam -->|*filelog* receiver| otelcol-charm
    app -->|Saves OTLP logs to file| otlplog
    otlplog -->|*filelog* receiver| otelcol-snap
    landscape -->|Saves logs to file| landscapelog
    landscapelog -->|*filelog* receiver| otelcol-snap
    cloud-init -->|*filelog* receiver| otelcol-snap
    something -->|Direct write in<br>OTLP format| loki3

    cos-proxy --> otelcol-charm
    otelcol-snap -->|OTLP format| loki3
    otelcol-charm -->|OTLP Format| loki3
    otelcol-charm -->|Loki Push API| loki2
The preferred backend is Loki 3, which preserves structured attributes for consistent search and dashboards.
Why an OpenTelemetry Collector?
Using an OpenTelemetry Collector ensures all logs share a consistent structure and labels, simplifying queries and dashboards. As mentioned in the log model, the OWASP information must be a nested attribute under the owasp_event key:
{
    "body": "Administrator banana-bob has updated privileges of user coconut-charlie from user to admin",
    "severity_number": 13,
    "severity_text": "WARN",
    "attributes": {
        "owasp_event": {
            "datetime": "2025-09-19T14:31:58.140099+02:00",
            "type": "security",
            "appid": "example.appid",
            "event": "authz_admin:coconut-charlie,user_privilege_change",
            "level": "WARNING",
            "description": "Administrator banana-bob has updated privileges of user coconut-charlie from user to admin"
        },
        "code.file.path": "/home/aegis/Repositories/Canonical/owasp-logger/src/owasp_logger/logger.py",
        "code.function.name": "_log_event",
        "code.line.number": 26
    },
    "dropped_attributes": 0,
    "timestamp": "2025-09-19T12:31:58.140189Z",
    "observed_timestamp": "2025-09-19T12:31:58.140207Z",
    "trace_id": "0x00000000000000000000000000000000",
    "span_id": "0x0000000000000000",
    "trace_flags": 0,
    "resource": {
        "attributes": {
            "telemetry.sdk.language": "python",
            "telemetry.sdk.name": "opentelemetry",
            "telemetry.sdk.version": "1.33.1",
            "service.name": "example-service"
        },
        "schema_url": ""
    }
}
The attributes will be mapped as-is to structured metadata in Loki.
Given that logs can have various formats depending on the application, the easiest way to get those attributes in place is to configure some custom processors to parse the OWASP information from your log line. The following sections explain how to do so.
How to configure OpenTelemetry Collector
Logs can arrive in different formts - this section explains how to parse them into OpenTelemetry attributes.
This README classifies logs according to the OpenTelemetry documentation.
Note that all configuration snippets are not complete configuration files, but only show the relevant sections for the sake of simplicity.
Structured logs
A structured log is a log whose textual format follows a consistent, machine-readable format. For applications, one of the most common formats is JSON.
OpenTelemetry format
If the application is already using the OpenTelemetry format for logs, OWASPLogger will make sure the OWASP information is in the correct place. Assuming you have a dedicated file for these JSON logs, you can use the filelog receiver to parse them:
receivers:
  filelog:
    include:
      - /path/to/your/file.log

processors:
  # Parse the OTel format from the JSON log lines in the file
  transform/parse-json:
    log_statements:
      - context: log
        error_mode: ignore  # Log the error and continue (ignore|silent|propagate)
        statements:
          - merge_maps(log.cache, ParseJSON(log.body), "upsert") where IsMatch(log.body, "^\\{")
          - set(log.body, log.cache["body"])
          - set(log.severity_number, Int(log.cache["severity_number"]))
          - set(log.severity_text, log.cache["severity_text"])
          - merge_maps(log.attributes, log.cache["attributes"], "upsert")
          - set(log.dropped_attributes_count, Int(log.cache["dropped_attributes"]))
          - set(log.time, Time(log.cache["timestamp"], "%FT%T.%fZ"))
          - merge_maps(resource.attributes, log.cache["resource"]["attributes"], "upsert")

service:
  pipelines:
    logs:
      receivers: [filelog]
      processors: [transform/parse-json]
More information on the OpenTelemetry log data model can be found here:
Generic JSON
If you have generic, arbitrarily-nested JSON logs in a file, you'll have to configure the transform processor accordingly in order to parse the relevant information.
transform/parse-json:
  log_statements:
    - context: log
      statements:
        - merge_maps(log.cache, ParseJSON(log.body), "upsert") where IsMatch(log.body, "^\\{")
        - # parse the relevant fields as needed
Semistructured Logs
A semistructured log is a log that does use some self-consistent patterns to distinguish data so that it’s machine-readable, but may not use the same formatting and delimiters between data across different systems. One example of this is juju debug-log.
You have to add some custom processors to the OpenTelemetry Collector configuration to parse the OWASP json blob from your logs.
[!NOTE] How do I configure custom processors?
In the charm, use thecustom_processorsJuju config option. In the snap, add the processors config under theprocessors:top-level key, then add the processor name in the related logs pipeline.
juju debug-log
juju debug-log embeds the OWASP event blob as a JSON in the Juju logs. Parsing its values into attributes is simple:
transform/parse-juju:
  log_statements:
    - context: log
      error_mode: ignore  # switch to ignore
      statements:
        - merge_maps(log.cache, ExtractPatterns(body, "^(?P<prefix>.*?)(?P<json>\\{.*\\}?)$"), "upsert")
        - merge_maps(log.attributes, ParseJSON(log.cache["json"]), "upsert")
Unstructured logs
Unstructured logs don't follow a consistent structure, and are thus more difficult to parse and analyze at scale. You need to write your own custom parsing logic in some processor in order to extract the attributes and fields you need.
📊 Visualizing OWASP Logs in Grafana
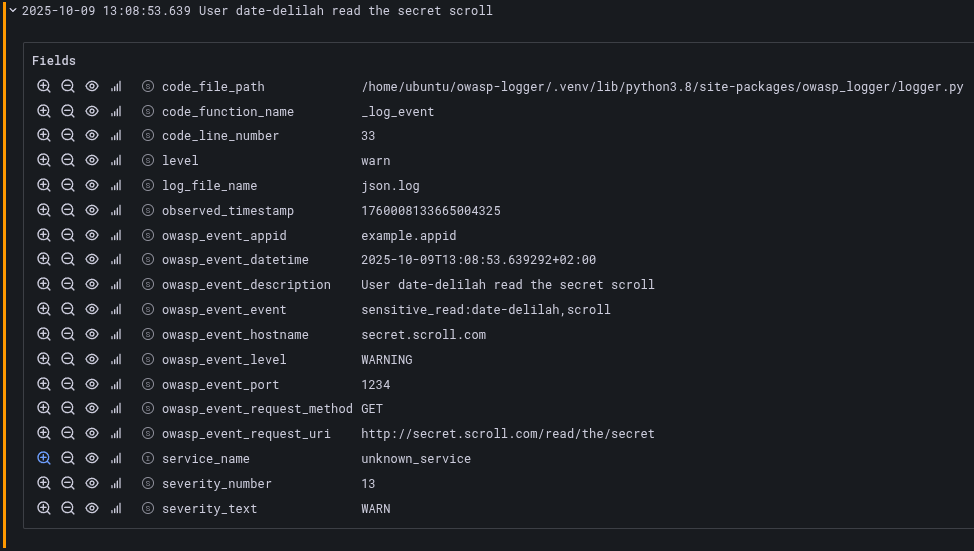
When OWASP logs reach Loki via the OpenTelemetry Collector used as a normalization point, they will contain the owasp_event as structured metadata.
Looking at the data via the Grafana datasource UI, this is how an example OWASP log looks like:
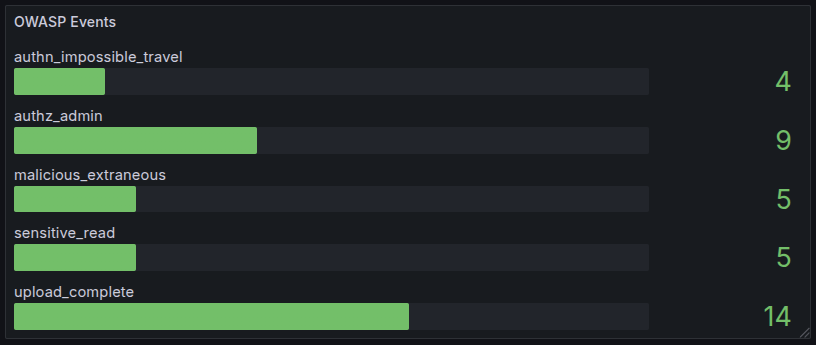
Here is an example query to count OWASP events by type:
sum by (owasp_event_name) (label_replace(count_over_time({service_name="example-service"}[$__auto] | owasp_event_event=~".+"), "owasp_event_name", "$1", "owasp_event_event", "^([^:]+):.*$"))
Using this query in a Grafana dashboard allows us to build a nice panel:
🔗 References
Project details
Verified details
These details have been verified by PyPIProject links
GitHub Statistics
Maintainers


Download files
Download the file for your platform. If you're not sure which to choose, learn more about installing packages.
Source Distribution
Built Distribution
Filter files by name, interpreter, ABI, and platform.
If you're not sure about the file name format, learn more about wheel file names.
Copy a direct link to the current filters
File details
Details for the file owasp_logger-0.1.6.tar.gz.
File metadata
- Download URL: owasp_logger-0.1.6.tar.gz
- Upload date:
- Size: 74.2 kB
- Tags: Source
- Uploaded using Trusted Publishing? Yes
- Uploaded via: uv/0.11.2 {"installer":{"name":"uv","version":"0.11.2","subcommand":["publish"]},"python":null,"implementation":{"name":null,"version":null},"distro":{"name":"Ubuntu","version":"24.04","id":"noble","libc":null},"system":{"name":null,"release":null},"cpu":null,"openssl_version":null,"setuptools_version":null,"rustc_version":null,"ci":true}
File hashes
| Algorithm | Hash digest | |
|---|---|---|
| SHA256 |
0e9d9f2f49da149babf5dcfad65eb13ab5b7f780b3228fca2856401f39ed979d
|
|
| MD5 |
dcd51d8a9ff13dc7ed20d6a654eeb1d0
|
|
| BLAKE2b-256 |
0e5f2bb17ea9e733c7429fcb65d4f1fd3e96387aab1d9cb1f0ecb6ecf7c0228c
|
File details
Details for the file owasp_logger-0.1.6-py3-none-any.whl.
File metadata
- Download URL: owasp_logger-0.1.6-py3-none-any.whl
- Upload date:
- Size: 10.9 kB
- Tags: Python 3
- Uploaded using Trusted Publishing? Yes
- Uploaded via: uv/0.11.2 {"installer":{"name":"uv","version":"0.11.2","subcommand":["publish"]},"python":null,"implementation":{"name":null,"version":null},"distro":{"name":"Ubuntu","version":"24.04","id":"noble","libc":null},"system":{"name":null,"release":null},"cpu":null,"openssl_version":null,"setuptools_version":null,"rustc_version":null,"ci":true}
File hashes
| Algorithm | Hash digest | |
|---|---|---|
| SHA256 |
8ed80527f6f6c4cc86a72ec1ef399ed7ae1eca3f491b471abd1d308fa5f74129
|
|
| MD5 |
d1ba67448ff82fbc4a4490e63161e5b9
|
|
| BLAKE2b-256 |
6dcedbd340b01c6cde5f9bdfa7c572db629e5d500a8d003b522cf14c8725f0bd
|


