Wrap scipy fft and numpy loadtxt within a simple GUI
Project description
This package implements a simple GUI to calculate real positive Fourier transforms from data stored in a .csv file, e.g., the recording data of an accelerometer. It aimts to be an educational resource for the structural dynamics course at the Barcelona School of Civil Engineering.
Installation
On the commandline, type the following command:
pip install owlfft
After that, you can call the package as a module from any location, like
python -m owlfft
Alternatively, you can download the file owlfft.py into a place of your choice and make sure all the dependencies are installed,
pip install numpy scipy matplotlib pyqt5 superqt
and then, run the python script:
python owlfft.py
Usage
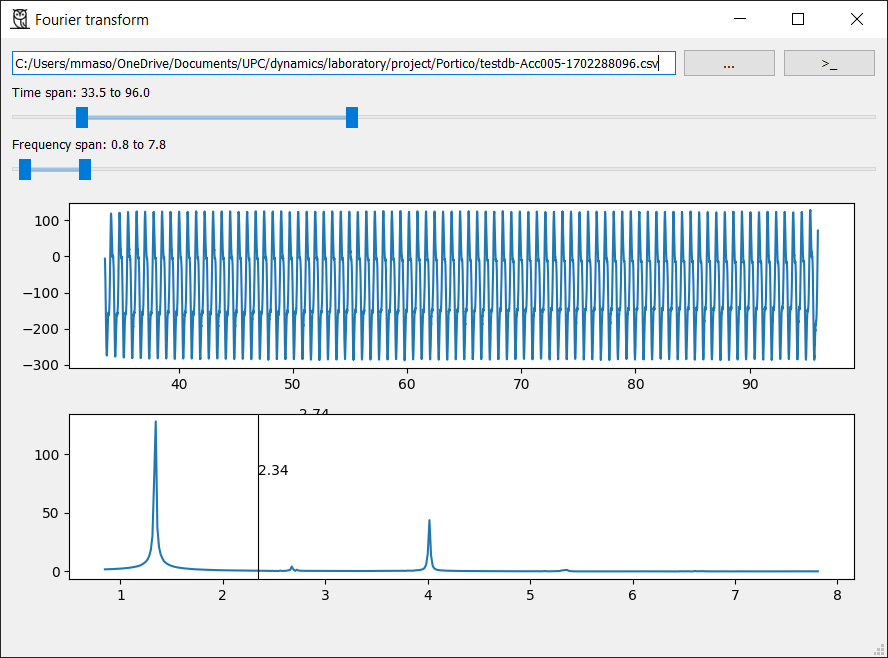
The above window will be opened. It allows to select a .csv file and to specify how to read it (custom delimiter, columns where to read data, etc.). There are also two range sliders to trim the time and the frequency domains. Finally, a cursor is added to the FFT spectrum plot.
Why an owl?
Because the python project must be unique, because the author likes birds and because the name is short.
Thanks
The author gratefully acknoledge Flaticon for the design of the icon.
Project details
Release history Release notifications | RSS feed
Download files
Download the file for your platform. If you're not sure which to choose, learn more about installing packages.


