
PacketPulse
Terminal network monitoring and analysis console.
Repository: https://github.com/tejppatil/PacketPulse
pip install packetpulse
packetpulse
A capture backend must be installed first — Npcap on Windows, libpcap on Linux and macOS. See Getting started for the exact steps on your platform.
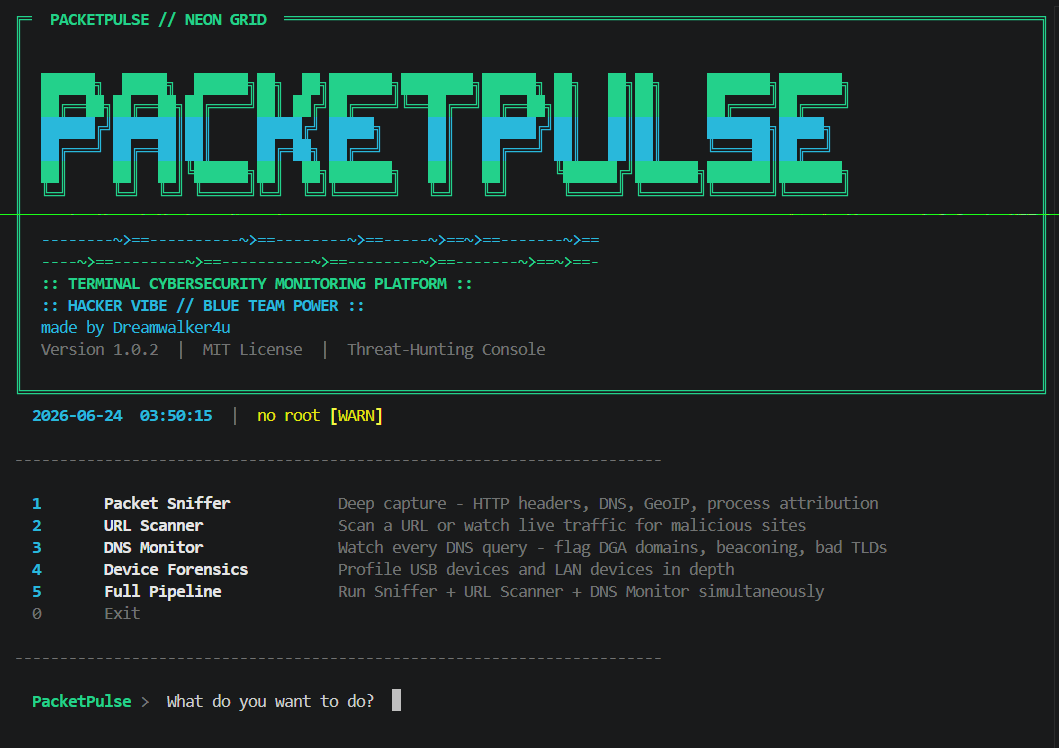
An interactive menu runs five modules. Every result PacketPulse prints or writes
comes from data it actually observed. Where something cannot be determined it
says UNKNOWN, NOT OBSERVED or UNAVAILABLE with a reason — it does not fill
the field with a guess.
What it does not do
Read this first. It is the shortest way to understand what the tool is for.
- It does not decrypt HTTPS. For TLS traffic you get endpoint metadata (addresses, ports, sizes, timing) and the SNI hostname from the ClientHello. Paths, headers, cookies and bodies are encrypted and are not recovered.
- It does not identify malware. Detections are structural and behavioural indicators with documented weights. A high score means several indicators fired, not that something is malicious.
- It does not guess which process sent a packet. Attribution requires an
exact socket four-tuple match. Anything less is reported as
UNKNOWN, or explicitly labelledINFERREDwith the reason. - It does not call query volume "beaconing". Periodicity is reported only when the intervals between queries are measurably regular.
- It does not contact external services unless you enable them. Reputation and online GeoIP lookups are off by default.
- A CLEAN verdict means no indicator fired. It is not a safety guarantee.
Getting started
PacketPulse needs a packet-capture backend from your operating system. Install that first, then the package. The startup steps differ by platform, so follow the section for yours.
Whichever platform you are on, the first thing to run is:
packetpulse -> 6 (Capabilities)
That prints exactly what works on your host and the reason for anything that does not. It needs no privileges and answers in under a second.
Windows
1. Install Npcap — the capture driver. There is no pip package for it.
Download from https://npcap.com and run the installer.
One installer checkbox decides whether you will need an Administrator terminal:
| Checkbox | Effect |
|---|---|
| Restrict Npcap driver's access to Administrators only | Ticked → capture requires an elevated terminal |
| Unticked → capture works as a normal user |
Leave WinPcap API-compatible mode ticked. The tool detects which mode you chose and tells you, so you do not have to remember.
2. Install PacketPulse
py -m pip install packetpulse
3. Run it
packetpulse
If capture reports UNAVAILABLE, re-open the terminal as Administrator (right-click → Run as administrator) and try again.
Verified on: Windows 11, Python 3.12, Npcap present, non-elevated — all five pipelines produced real data with verified artifacts.
What is limited on Windows
| Limitation | Detail |
|---|---|
| USB forensics unavailable | Requires Linux libudev. Reports UNAVAILABLE: requires Linux (libudev); this host is Windows — never an empty section |
| Process attribution | Without an elevated terminal the OS hides other users' sockets, so most packets report Process: UNKNOWN. Run elevated for EXACT attribution |
| NetBIOS / mDNS names | nmblookup and avahi-resolve do not exist on Windows; those fields report UNAVAILABLE |
| First capture may pause | The capture engine loads once per run. Normally ~2 seconds; on a host with many virtual adapters it can take longer, and the tool prints a message while it waits so it is not mistaken for a freeze |
Everything else — sniffer, DNS monitor, URL scanner, host profiling, LAN discovery, nmap, and the full pipeline — works on Windows.
Linux (Debian, Ubuntu, Kali)
1. Install the capture library and Python tooling
sudo apt update
sudo apt install -y libpcap0.8 python3-pip python3-venv
libpcap0.8 is the runtime library. Without it PacketPulse reports:
Packet capture UNAVAILABLE: libpcap not found —
  install libpcap (Debian/Kali: apt install libpcap0.8; Fedora: dnf install libpcap)
2. Install PacketPulse
python3 -m venv ~/.venvs/packetpulse
~/.venvs/packetpulse/bin/pip install packetpulse
pyudev is pulled in automatically on Linux, which is what enables USB
forensics.
3. Run it — pick one of two ways
Packet capture needs raw-socket access. Either run as root:
sudo ~/.venvs/packetpulse/bin/packetpulse
…or grant the capability once and run as your normal user:
sudo setcap cap_net_raw,cap_net_admin+eip \
    "$(readlink -f ~/.venvs/packetpulse/bin/python3)"

~/.venvs/packetpulse/bin/packetpulse
PacketPulse tests the permission by opening a raw socket rather than assuming
root, so the capability route is detected and reported as
libpcap.so.1 via granted capability (CAP_NET_RAW).
4. Optional extras — each is probed, and a missing one is named with the package that provides it rather than leaving a blank field:
sudo apt install -y nmap net-tools samba-common-bin avahi-utils
| Tool | Package | Used for |
|---|---|---|
nmap |
nmap |
Active port scan in Device Forensics |
arp |
net-tools |
ARP table (not installed by default on current Kali) |
nmblookup |
samba-common-bin |
NetBIOS host names |
avahi-resolve |
avahi-utils |
mDNS host names |
blkid |
util-linux (already present) |
USB filesystem detail |
Verified on: Ubuntu 26.04, Python 3.14.4, psutil 7.2.2, scapy 2.7.0,
pyudev 0.24.4 — full test suite passed, USB enumeration ran against real
pyudev, and the no-libpcap/no-root path refused cleanly with the message
above.
What is limited on Linux
| Limitation | Detail |
|---|---|
| Capture needs root or CAP_NET_RAW | Without either, capture reports UNAVAILABLE with both remedies. It does not half-run |
dmesg is root-restricted |
Most distributions set kernel.dmesg_restrict; the kernel-log section then reports UNAVAILABLE with that reason |
| Some tools absent by default | Current Kali ships without net-tools, so the ARP table section reports UNAVAILABLE until you install it |
| scapy 2.6+ on unusual kernels | See below |
If scapy cannot read your IPv6 route table
On kernels whose rtnetlink does not report an address scope field, scapy
2.6 and later raise KeyError: 'scope' while building their IPv6 routing
table — during import, which would otherwise stop PacketPulse from starting at
all. Observed on WSL2 (kernel 4.4.0-Microsoft):
| scapy | Result |
|---|---|
| 2.5.0 | imports cleanly |
| 2.6.1 | KeyError: 'scope' |
| 2.7.0 | KeyError: 'scope' |
PacketPulse detects this and disables scapy's IPv6 route autoload
(conf.route6_autoload, scapy's own supported switch) so capture proceeds.
IPv6 packets are still decoded. The workaround is recorded in every report's
limitations, so you always know it was applied. If it ever fails outright, the
tool names the remedy:
pip install 'scapy==2.5.0'
macOS
python3 -m venv ~/.venvs/packetpulse
~/.venvs/packetpulse/bin/pip install packetpulse
sudo ~/.venvs/packetpulse/bin/packetpulse
libpcap ships with macOS. Capture requires root. USB forensics is unavailable
(it needs Linux libudev) and is reported as such.
Not verified — macOS support is reasoned from the POSIX code paths, which were tested on Linux. Run option 6 first to see what your host reports.
Platform support at a glance
| Module | Windows | Linux / Kali | macOS |
|---|---|---|---|
| Packet Sniffer | Yes (Npcap) | Yes (root or CAP_NET_RAW) | Yes (root) |
| DNS Monitor | Yes | Yes | Yes |
| URL Scanner — single URL | Yes | Yes | Yes |
| URL Scanner — live watch | Yes | Yes | Yes |
| Full Pipeline | Yes | Yes | Yes |
| Forensics — host profile | Yes | Yes | Yes |
| Forensics — LAN discovery | Yes | Yes | Yes |
| Forensics — nmap | If installed | If installed | If installed |
| Forensics — USB | No (needs Linux) | Yes | No (needs Linux) |
| Process attribution | EXACT only when elevated | EXACT under root | EXACT under root |
Choosing the right interface
On a host with a VPN or tunnel adapter active, the platform's default capture interface is often not the one carrying internet traffic. PacketPulse asks the OS which interface it actually routes through and offers that first, using native system calls rather than scapy's enumeration.
This matters more than it sounds. On the development host, DNS traffic was completely invisible on the default interface and fully visible on the tunnel adapter — a capture on the wrong one would have produced an empty report that looked like a successful scan.
If you capture on the wrong interface you will typically see only local broadcast traffic (mDNS, LLMNR, SSDP) and no internet traffic at all. Every report records which interface was used and warns when it differs from the routing interface.
The five modules
1 — Packet Sniffer
Captures live packets and writes a verified artifact set.
Extracted per packet, when actually present:
- L2 — source/destination MAC (absent on tunnel interfaces with no Ethernet header)
- L3 — IPv4/IPv6 addresses, TTL
- L4 — TCP/UDP ports, TCP flags, sequence, window; ICMP; ARP
- L7 — DNS queries and answers; HTTP request line, headers and body only when the traffic is genuinely plaintext
Each packet gets an observation, a signal level and a score:
OBSERVED   Potential credential submission over cleartext HTTP  signal=STRONG  score=65/100
  +15   HTTP service port — port 80 (cleartext) with public peer
  +15   Cleartext HTTP — request/response readable on the wire
  +30   Credential-bearing POST over cleartext — POST to path containing 'login'
  +5    External web request — Host header 'example.com' on a public peer
The score is the sum of the indicator weights listed beneath it. There are no fixed confidence percentages: every number shown is one the tool computed and can show its working for.
Artifacts (in pcap_store/): .pcap, .ndjson (one record per packet),
.html, .pdf, .json.
The PCAP is streamed to disk as packets arrive and is complete. If the terminal cannot keep up, rendering drops packets and the report says how many — the capture file never does. After capture the PCAP is re-read and its frame count is compared with the session counter; a mismatch is reported.
2 — URL Scanner
Single URL — four checks, of which only those that actually run are reported:
- Structure — TLD, IP-as-host, length, subdomain depth, entropy, encoding evasion, punycode, suspicious parameters, executable extensions
- TLS — real certificate validation with verification enabled; expiry, protocol version, hostname match
- Reputation — VirusTotal, Google Safe Browsing, PhishTank. Optional. Not configured, not enabled or not reachable are each reported distinctly, and never as a clean result
- Content — fetched only when enabled, with certificate verification on and a 2 MB response cap
Verdict is derived from the accumulated score (CLEAN < 25 ≤ SUSPICIOUS < 60 ≤ MALICIOUS), or forced to MALICIOUS by a conclusive finding such as a Safe Browsing listing.
Live watch — extracts URLs from real traffic only:
| Source | What is observed |
|---|---|
| HTTP | Full URL from the request line and Host header |
| HTTPS | SNI hostname only — the payload is encrypted |
| DNS | The queried name |
| Browser sockets | Destination, resolved by reverse DNS; skipped if it does not resolve |
Scans run on a bounded worker pool. If traffic outruns capacity the excess is counted and reported, not silently dropped.
3 — DNS Monitor
Observes plaintext DNS on UDP/53. DNS-over-HTTPS and DNS-over-TLS are encrypted and are invisible to this module — if your resolver uses them, this module will correctly report that it saw nothing.
Indicators, each reported with its measurement:
- Algorithmically generated names — combines character entropy, bigram frequency against common letter pairs, vowel ratio and digit ratio. Three or more indicators is required before a name is called suspicious
- High query frequency — count, window and rate
- Periodicity — computed from inter-query intervals as a coefficient of
variation. Reported as
REGULAR INTERVALS OBSERVEDonly when intervals are genuinely regular; otherwiseIRREGULARorNOT ESTABLISHED - High-abuse TLDs, keyword tokens, long names, hyphen count, punycode
Reverse-DNS (.arpa) and link-local (.local) zones are exempt from structural
checks, which they would otherwise fail by definition.
4 — Device Forensics
Every section is labelled OBSERVED, INFERRED or UNAVAILABLE.
- Host — hostname, OS, CPU, memory, disks, interfaces, open sockets,
listening ports, network processes. All read from OS APIs via
psutil - USB — Linux only, via
pyudev. Product, manufacturer, serial, VID/PID, driver, speed, power, and session history - LAN — ARP sweep, MAC vendor lookup, hostname resolution, and optional
nmapport scan when the binary is present. Without elevation nmap runs a TCP connect scan (-sT); with elevation it uses SYN scan and OS detection. Discovered ports and services come from nmap's own output — nothing is inferred when the scan does not run
OS fingerprinting from TTL and window size is labelled a heuristic and shows its evidence. It is never presented as an identification:
Likely OS: Windows
Evidence : observed TTL 128 implies initial TTL 128 (0 hops away)
Method   : TTL/window heuristic
Confidence: heuristic - not an identification
Only scan networks you are authorised to scan. The nmap option performs an active scan and is off by default.
5 — Full Pipeline
Runs the Sniffer, URL Scanner and DNS Monitor concurrently against one shared interface, one duration and one stop signal. When the duration expires every module is signalled, drained, joined and its reports written before control returns. If a module fails, the failure is reported and the others are shut down cleanly — the pipeline does not claim success.
Configuration
All secrets come from the environment. Nothing is read from source.
export PACKETPULSE_VT_KEY="..."           # VirusTotal (optional)
export PACKETPULSE_GSB_KEY="..."          # Google Safe Browsing (optional)
export PACKETPULSE_PHISHTANK_KEY="..."    # PhishTank (optional)
export PACKETPULSE_GEOIP_DB="/path/GeoLite2-City.mmdb"   # offline GeoIP (optional)
A .env file is loaded if present, searched in this order: the current working
directory, then ~/.packetpulse/.env, then the project directory.
GeoIP
- With
PACKETPULSE_GEOIP_DBset, lookups are local, fast and private. - Without it, GeoIP is reported as
UNAVAILABLEwith the reason. - Online lookup via ip-api.com exists but is off by default: it transmits every observed address to a third party and is rate limited. When enabled, reports state that it was used and that results are approximate.
Failed lookups are never cached as facts, so one offline session does not permanently degrade later reports.
External reputation
Off by default. When you enable it:
- Single-URL mode sends the URL you typed.
- Live mode sends the registered domain only — never full URLs, which would transmit paths and query strings for every site on the monitored network.
- Requests are rate limited locally against the free-tier quotas.
Reading a report
Every report identifies the session that produced it:
| Field | Meaning |
|---|---|
| Session ID | Unique per run. Artifacts from different runs never mix |
| Status | PASS (completed, nothing missing), PARTIAL (completed, something unavailable or errored), FAIL (did not complete) |
| Requested vs measured duration | Measured from timestamps, never echoed back from the request |
| Duration honoured | Whether the capture window matched the request |
| Counters | Only what was actually observed |
| Unavailable features | What could not run, and why |
| Limitations | What this report cannot establish |
| Errors | Failures that occurred, never swallowed |
"No threats observed in captured data" and "analysis incomplete — capture failed" mean different things, and the reports say which one applies.
Values you will see, and what they mean:
| Value | Meaning |
|---|---|
UNKNOWN |
Could not be determined from available evidence |
NOT OBSERVED |
Did not appear during the capture window |
UNAVAILABLE |
The capability required is not present — reason given |
NOT RESOLVED |
A lookup was attempted and did not return |
INFERRED |
Derived, not confirmed — basis stated alongside |
Development
git clone https://github.com/tejppatil/PacketPulse
cd PacketPulse
pip install -e ".[dev]"
pytest
The test suite covers packet parsing against crafted fixtures, the analysis heuristics, session lifecycle and stop control, and security regressions for path traversal, command injection and HTML injection.
Synthetic packets exist only inside tests. The application itself never fabricates traffic, devices or results.
Security
PacketPulse commonly runs with elevated privileges and parses data controlled by other parties on the network. Accordingly:
- Names observed on the wire (DNS names, USB serials, URLs) are sanitised and containment-checked before they are used in a filename
- Captured values are escaped before they enter an HTML report
- Notification text is sanitised and never interpolated into a shell command
- TLS verification is never disabled
- Network responses are size-capped
- Subprocesses are invoked with argument arrays, never
shell=True
Report security issues via the repository issue tracker.
License
MIT. See LICENSE.
1 maintainer

Release files for packetpulse 2.0.0
For a detailed explanation of source distributions (sdists) and built distributions (wheels), please see the package formats documentation.
Source distribution (sdist)
| File | Size | Uploaded | |
|---|---|---|---|
| packetpulse-2.0.0.tar.gz | 133.9 kB | Details |
Built distribution (wheel)
| File | Interpreter | ABI | Platform | Reset |
|---|---|---|---|---|
| packetpulse-2.0.0-py3-none-any.whl | Python 3 | none | any | Details |
Total release size: 254.1 kB
Release files / packetpulse-2.0.0.tar.gz
| Download URL | packetpulse-2.0.0.tar.gz |
|---|---|
| Size | 133.9 kB |
| Tags | Source |
|
SHA-256 checksum How to use checksums |
af72ed95ffcb10ea6887ae6f0f2c49aa502da185d1abd3b36695b1844a036e4f
|
|
BLAKE2b-256 checksum How to use checksums |
d52aefba78d45e2b2b41f5df3d32be2e65b8a0cac7fead48bd0477b35b1d403e
|
| Upload date | |
|
Uploaded using Trusted Publishing? What is trusted publishing? |
Yes |
| Uploaded via |
twine/7.0.0 CPython/3.13.14
|
Provenance
Provenance describes where a file came from. On PyPI, provenance is shared via attestations, which provide a verifiable record of the build or publishing details. View details, limitations and caveats.


PyPI Publish Attestation
PyPI verified that this artifact, at this checksum, originated from the publisher listed below.
Signed by GitHub Actions, verified by PyPI on Aug 24, 2026.
Transparency logRelease files / packetpulse-2.0.0-py3-none-any.whl
| Download URL | packetpulse-2.0.0-py3-none-any.whl |
|---|---|
| Size | 120.3 kB |
| Tags | Python 3 |
|
SHA-256 checksum How to use checksums |
fda76c2de69e0830dbe12434acc9180e3931690fd0b933fcbf67629696f13285
|
|
BLAKE2b-256 checksum How to use checksums |
2e591d5feb53bd996289d839a0edb91b193bec1fbed4264bfedba7817b00675d
|
| Upload date | |
|
Uploaded using Trusted Publishing? What is trusted publishing? |
Yes |
| Uploaded via |
twine/7.0.0 CPython/3.13.14
|
Provenance
Provenance describes where a file came from. On PyPI, provenance is shared via attestations, which provide a verifiable record of the build or publishing details. View details, limitations and caveats.
PyPI Publish Attestation
PyPI verified that this artifact, at this checksum, originated from the publisher listed below.
Signed by GitHub Actions, verified by PyPI on Aug 24, 2026.
Transparency log













