
Visualization tool for collective categorical data

Project description
Palette diagram
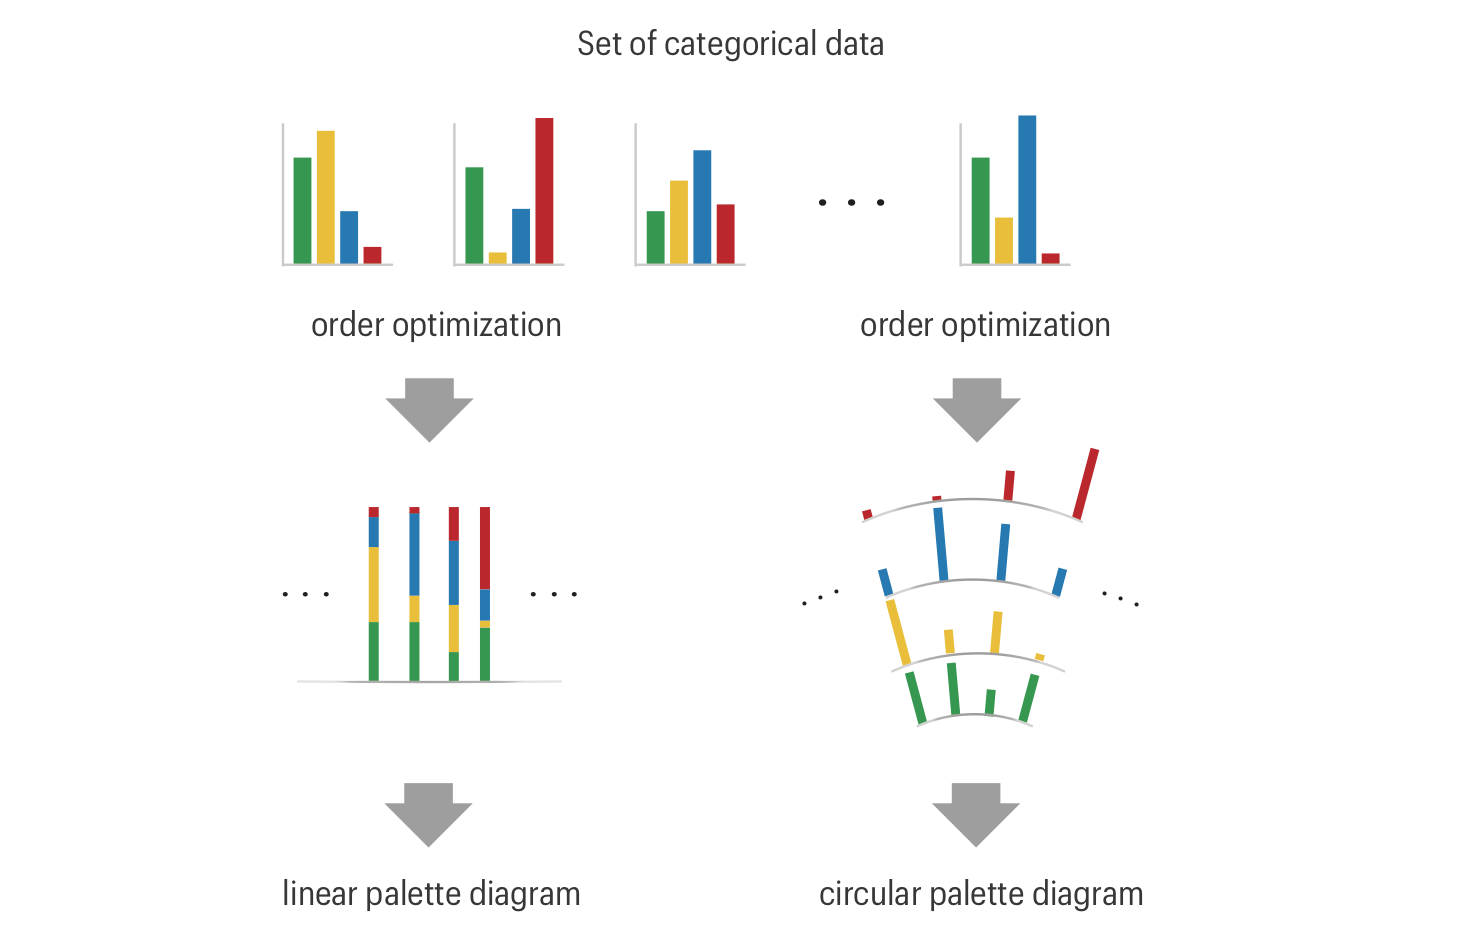
A palette diagram is a visualization tool for a large number of categorical datasets, each comprising several categories.
Linear palette diagram
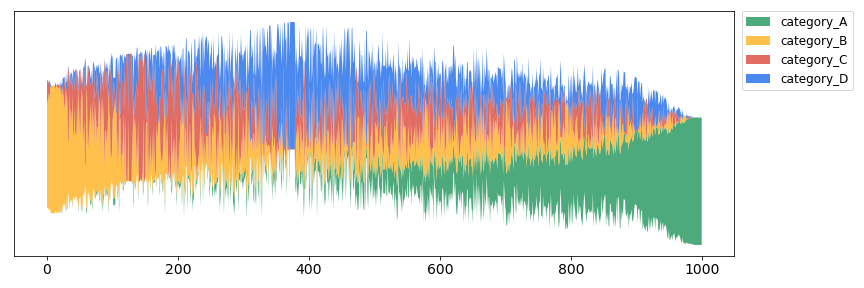
This is a stream plot, which is usually used for plotting time series data. Each categorical dataset is stacked vertically, and these stacked plots are aligned horizontally so that the neighboring datasets have similar vertical patterns.
Circular palette diagram
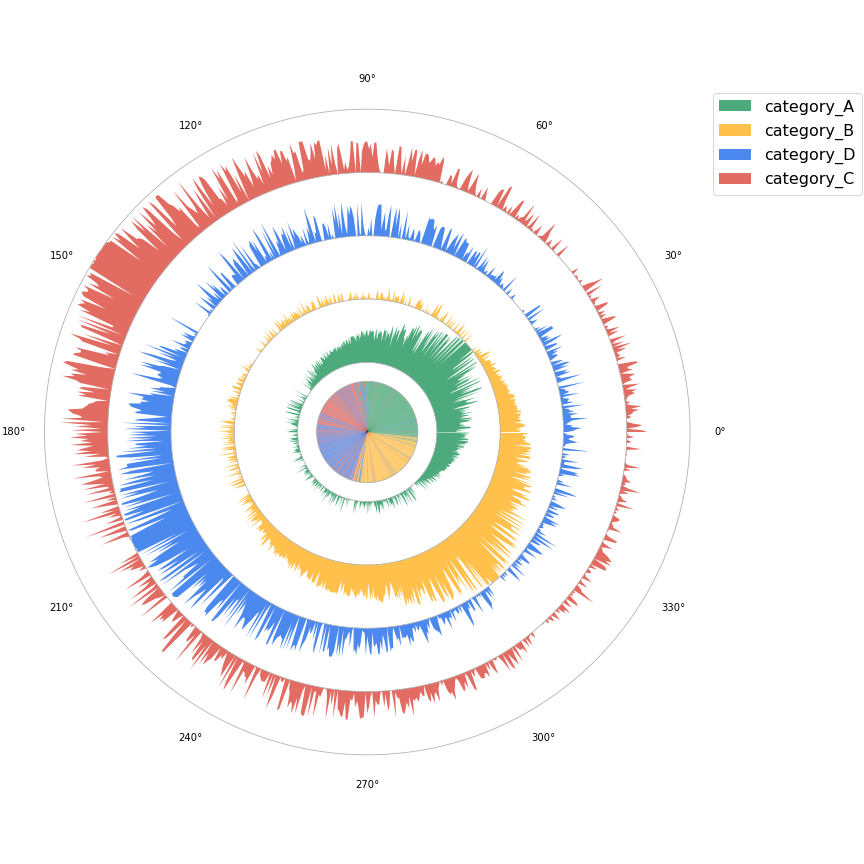
Each categorical dataset is represented along the radial coordinate: Each layer corresponds to a category and the thickness represents the normalized (or unnormalized) quantity within a category. The set of categorical data is aligned along the angular coordinate.
The central part shows indicates the color of the dominant category within a categorical dataset (i.e., the maximum a posteriori estimate).
Installation
palette-diagram can be installed from PyPI:
pip install palette-diagram
Demo
You can find a demo here.
Usage
This function generates a linear or circular palette diagram from a data table.
import pandas as pd
import palette_diagram as pt

df = pd.read_csv('your_dataset.csv')

pt.palette_diagram(df)
Input
A data table df in pandas DataFrame.
Each row represents a categorical dataset.
Here is how the DataFrame should look like:
| category A | category B | category C | category C |
|---|---|---|---|
| 15 | 31 | 2 | 8 |
| 24 | 0 | 45 | 112 |
| 9 | 11 | 83 | nan |
| ... | ... | ... | ... |
- The (i,k) element in the DataFrame represents a quantity for kth category in ith dataset.
- The DataFrame must have column names representing the category labels.
- The value of each cell has to be non-negative.
- A dataset is allowed to have missing cells (
nan). The missing cells are filled with zeros.
Input with dataset indices
If the DataFrame has a column representing the index for each row (i.e., dataset), the column will be omitted in a palette diagram, and the indices will be used as the dataset ID in data_ordering.csv. For example, if your DataFrame looks like
| data_id | category A | category B | category C | category C |
|---|---|---|---|---|
| A001 | 15 | 31 | 2 | 8 |
| A002 | 24 | 0 | 45 | 112 |
| A003 | 9 | 11 | 83 | nan |
| ... | ... | ... | ... | ... |
then you can generate a palette diagram and data_ordering.csv by
pt.palette_diagram(df, index='data_id')
Output
A linear palette diagram or circular palette diagram.
Optional parameters
| argument | type/values | default value | description |
|---|---|---|---|
| palette_type | {'circular', 'linear'} | 'circular' | 'circular': circular palette diagram 'linear': linear palette diagram |
| n_neighbors | integer | 100 | A hyperparameter for the linear palette diagram (see below for details) |
| n_epochs | integer | 100 | A hyperparameter for the circular palette diagram (see below for details) |
| lr | float | 0.0005 | A hyperparameter for the circular palette diagram (see below for details) |
| norm | boolean | True | If True, each categorical dataset (row in the datamatrix) will be normalized to unity. The diagram has non-uniform layer thickness when norm=False. |
| export | boolean | True | If True, the palette diagram will be saved as a PDF file in ./output/. |
| export_table | boolean | True | If True, the ordering of the datasets will be saved as a csv in ./output/. |
| category_labels | list of category labels | None | If provided, you can manually control the color assignment of each category by specifying the order of category labels. |
| cmap_name | string | None | If a qualitative color palette in matplotlib is provided, the specified color map is will be used. |
| remove_empty_sets | {0,1,2,-1} | -1 | 0: Remove all empty (zero-valued) rows (data) 1: Remove all empty (zero-valued) columns (categories) 2: Remove all empty (zero-valued) rows and columns -1: Ignored |
| index | string | None | If provided, the specified column in the DataFrame will be used as a set of dataset indices. If None, a set of consecutive numbers is assigned as the dataset indices. |
Order optimization
linear palette diagram
In the linear palette diagram, the order of the datasets are optimized through ISOMAP.
n_neighbors is a hyperparameter used to construct a k-nearest neighbor graph in ISOMAP.
circular palette diagram
In the circular palette diagram, the stochastic gradient descent (SGD) method is used for the order optimization.
n_epochs and lr are hyperparameters for the SGD: n_epochs is the number of epochs and lr is the learning rate.
We strongly recommend users to try various values of these hyperparameters, as the appropriate value varies depending on the input data table.
References
- Please cite the following paper when you use the palette diagram:
Chihiro Noguchi and Tatsuro Kawamoto, "Palette diagram: A Python package for visualization of collective categorical data," arXiv:2011.01934 (2020).
- You can find more details about the (linear) palette diagram in the following article:
Chihiro Noguchi and Tatsuro Kawamoto, "Evaluating network partitions through visualization," arXiv:1906.00699, unpublished (2019).


Download files
Download the file for your platform. If you're not sure which to choose, learn more about installing packages.
Source Distribution
Built Distribution
Filter files by name, interpreter, ABI, and platform.
If you're not sure about the file name format, learn more about wheel file names.
Copy a direct link to the current filters
File details
Details for the file palette_diagram-1.1.2.tar.gz.
File metadata
- Download URL: palette_diagram-1.1.2.tar.gz
- Upload date:
- Size: 7.5 kB
- Tags: Source
- Uploaded using Trusted Publishing? No
- Uploaded via: twine/3.2.0 pkginfo/1.5.0.1 requests/2.24.0 setuptools/50.3.2 requests-toolbelt/0.9.1 tqdm/4.47.0 CPython/3.8.3
File hashes
| Algorithm | Hash digest | |
|---|---|---|
| SHA256 |
b906417802d199b4313d99b10249823270e8a5b60ab67a50f0345077187fb939
|
|
| MD5 |
a7ff02db9deae0c1f23a37d784c2dd94
|
|
| BLAKE2b-256 |
440ba9758061e42e4a4217a1542021156ea9af2f5e9b06e9eae0e4985543aeb5
|
File details
Details for the file palette_diagram-1.1.2-py3-none-any.whl.
File metadata
- Download URL: palette_diagram-1.1.2-py3-none-any.whl
- Upload date:
- Size: 7.5 kB
- Tags: Python 3
- Uploaded using Trusted Publishing? No
- Uploaded via: twine/3.2.0 pkginfo/1.5.0.1 requests/2.24.0 setuptools/50.3.2 requests-toolbelt/0.9.1 tqdm/4.47.0 CPython/3.8.3
File hashes
| Algorithm | Hash digest | |
|---|---|---|
| SHA256 |
d2cdf45eda3cb3392af4fda700eecb6312e430f7e51a32243103927353d69b59
|
|
| MD5 |
f3d6983019640871590898bd496c64b7
|
|
| BLAKE2b-256 |
1e9f90a0bc1a60d94f7eb11d59627c48077284b2a08be01c1dfd0e7d04126d16
|






