




PAM Transformer Visualizer
A streamlit application for loading Passive Acoustic Monitoring (PAM) and Long-Term Spectral Average (LSTA) data and exploring different filtering techniques on the data.
Collaborators
| Name | Institution | Other | |
|---|---|---|---|
| Ivia Closset | Finnish Meteorological Institute | ivia.closset@fmi.fi | |
| Brijonnay Madrigal | University of California, San Diego | brmadrigal@ucsd.edu | |
| Aaron Mau | Voice of the Ocean Foundation | aaron.mau@voiceoftheocean.org | No PAM experience! |
Folder Structure
Background
This project originated from a common desire to explore the data processing aspects of PAM data. What is typically done when going from the raw file to the final product? How do these different filters modify the data, especially when compared with one another? Furthermore, what are the best ways to visualize these changes?
This grew when the project was proposed - hearing feedback that it would be helpful in the classroom and for new PAM data analysts alike fueled our group's desire to produce something that could be used as a learning tool for others - not just our own.
Goals
- Build a tool that can load some of the audio data from the PAM rodeo.
- Enable the user to pick from a list of methods that transform or modify the data, and visualize the pre-post changes.
- Load up the LTSA values provided by the hackathon organizers - such that the spectrograms can be compared to the source.
- List the data, with multiple channels if they are supported, such that the transformed values can be downloaded.
Methods
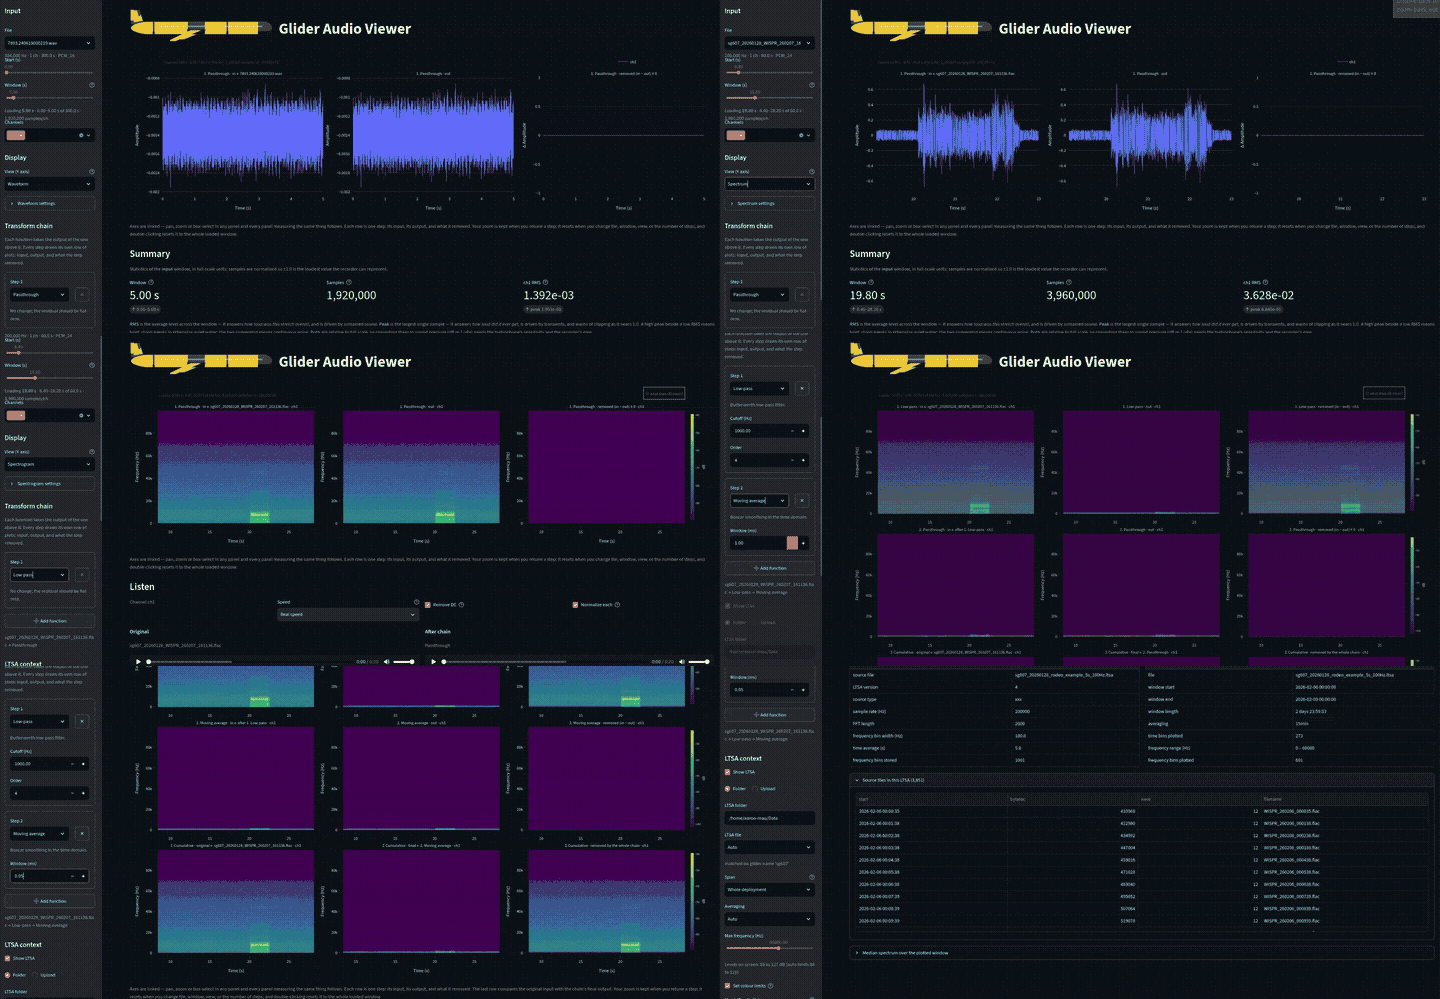
passthrough- nothing is done. The residual before and after will be 0 (when looking at magnitude - this is set to -200 dB to prevent log errors)lowpass- a simple Butterworth IIR filter, where the high frequencies are thrown outhighpass- the opposite of a low-pass filter, where the low frequencies are thrown outbandpass- a combination of the high- and low-pass filters, keeping a band of frequenciesnotch- the opposite of a bandpass, removing a "notch" of frequencies of a specified widthmoving_average- taking the average of nearby points and then moving forward with a specified window sizenormalize- modify the amplitudes to maximum peak sizeenvelope- Apply a Hilbert transform to estimate "envelopes" of repeating oscillations, combining multiple small signals togetherdownsample- reduce the number of samplesfft- filtering frequencies and breaking into sinusoidal componentsPSD (Welch)- similar to fft, but by averaging the spectrum from various chunks
Meanwhile, data are visualized in 4 ways:
Waveform. Amplitude on the Y axis, time on the X.Spectrum. Magnitude on the Y axis, frequency on the X.Spectrogram. Frequency on the Y axis, time on the X, magnitude on the Z. In the spectrogram viewer mode, there is functionality to listen to the visualized sound.Long term spectral average. Frequency on the Y axis, time on the X (days), magnitude on the Z.
Datasets
A subset of data collected from gliders in the Baltic Sea was provided by Ivia Closset to test the visualization tool.
Workflow
Lessons Learned
Next Steps
Glider Data. Does the upcast appear different than the downcast? What about individual glider states? Need to look at more data.Documentation. Generate more documentation to assess scientific validity of the methods, create a more detailed notebook for the classroom and initiate a literature review.
Documentation
All documentation can be found in the docs folder of this repository.
The original presentation from the glider rodeo can be found here: https://docs.google.com/presentation/d/1EysKwb2PTtAja1eO1xwhGM8LsgoKEaPa4V8nB1p2CXc/edit?usp=sharing
Next Steps
We ran our tool against a controlled subset of data. Looking at more data, including other makes and models, would be helpful to iron out bugs and confirm scenarios that should be supported.
- Pair to glider data
- Possibly "disable" the upcasts, or analyze the upcasts vs the downcasts
- Investigate the glider state. Is it noisier during inflections? Can we remove it when it's at the surface and getting splashed around?
- Save/load settings or a chain of transforms?
- Documentation
- Assess the scientific validity
- Simple English for a variety of audiences
- Detailed notebook to serve as a walkthrough
- Add some literature review, such that users can learn more about the applications and algorithms
Take criticism! If there are suggestions or improvements, we should take them as GitHub issues such that we can stay organized and the community can know its shortcomings.
References
We used the assistance of Claude AI for this project.
Acknowledgements
This project was part of a [Glider Rodeo Hackathon] which worked with (or was inspired by) PAM-Glider data collected by the NOAA Fisheries Glider Rodeo (2026). This weeklong event was hosted by NOAA Fisheries with support by Openscapes (JupyterHub, Support), Oregon State University (Zoom, Box data storage), Aquaview (technical support).

1 maintainer

Metadata
1 maintainer
Release files for pam-glider-viz 1.0.1
For a detailed explanation of source distributions (sdists) and built distributions (wheels), please see the package formats documentation.
Source distribution (sdist)
| File | Size | Uploaded | |
|---|---|---|---|
| pam_glider_viz-1.0.1.tar.gz | 54.8 kB | Details |
Built distribution (wheel)
| File | Interpreter | ABI | Platform | Reset |
|---|---|---|---|---|
| pam_glider_viz-1.0.1-py3-none-any.whl | Python 3 | none | any | Details |
Total release size: 111.9 kB
Release files / pam_glider_viz-1.0.1.tar.gz
| Download URL | pam_glider_viz-1.0.1.tar.gz |
|---|---|
| Size | 54.8 kB |
| Tags | Source |
|
SHA-256 checksum How to use checksums |
c8bb7df32f96acf325ccec418de2efa9fd0015e6169e4246975f9870b964b366
|
|
BLAKE2b-256 checksum How to use checksums |
fca2a8eb2db6ed5448823e972eb41d6d4161ddc53dee7339871be29b941d86df
|
| Upload date | |
|
Uploaded using Trusted Publishing? What is trusted publishing? |
Yes |
| Uploaded via |
twine/7.0.0 CPython/3.13.14
|
Provenance
Provenance describes where a file came from. On PyPI, provenance is shared via attestations, which provide a verifiable record of the build or publishing details. View details, limitations and caveats.


PyPI Publish Attestation
PyPI verified that this artifact, at this checksum, originated from the publisher listed below.
Signed by GitHub Actions, verified by PyPI on Oct 2, 2026.
Transparency logRelease files / pam_glider_viz-1.0.1-py3-none-any.whl
| Download URL | pam_glider_viz-1.0.1-py3-none-any.whl |
|---|---|
| Size | 57.1 kB |
| Tags | Python 3 |
|
SHA-256 checksum How to use checksums |
d30dde5cc762326183d559ca4386dba0047bb6dd197b4d66b255833212ed7504
|
|
BLAKE2b-256 checksum How to use checksums |
d5ef902c25f5822d22bd28c2bc7fcd3188aee3c156a5c6e2c9be024095c3d3ac
|
| Upload date | |
|
Uploaded using Trusted Publishing? What is trusted publishing? |
Yes |
| Uploaded via |
twine/7.0.0 CPython/3.13.14
|
Provenance
Provenance describes where a file came from. On PyPI, provenance is shared via attestations, which provide a verifiable record of the build or publishing details. View details, limitations and caveats.
PyPI Publish Attestation
PyPI verified that this artifact, at this checksum, originated from the publisher listed below.
Signed by GitHub Actions, verified by PyPI on Oct 2, 2026.
Transparency log













