
PandaMap: A Python Package for Visualizing Protein–Ligand Interactions
Protein AND ligAnd interaction MAPper — comprehensive detection, visualization, and empirical binding affinity estimation for protein–ligand complexes.



What's New in v4.3
Correctness release. Several fixes change which interactions are detected and what ΔG is reported — see Upgrading from 4.2.
| Change | Description |
|---|---|
| Halogen bonds now detect Cl, Br and I | The donor test was case-sensitive against BioPython's upper-cased element symbols ('BR'), so only fluorine was ever matched. Bromine, chlorine and iodine halogen bonds were undetectable |
| No more ΔG double-counting | Each ionic contact was scored as both ionic (−1.80) and salt_bridge (−1.50); cation_pi and pi_cation overlapped and scored one contact twice |
| Carboxylate salt bridges detected | Ligand anion perception excluded every carboxylate — the commonest anionic group in drug-like ligands |
| D–H···A angular criterion | With explicit hydrogens the true donor angle is measured and must exceed 100° (PLIP's threshold) |
| Metal coordination no longer scored as covalent | A Zn–His contact at 2.0 Å was being weighted −8.0 kcal/mol |
| Readable ligand depiction | Larger ligands collapsed into an unreadable blob; marker size now tracks bond length |
--csv and --plots outputs |
Machine-readable interaction table and a four-panel graphical report |
| 3D HTML no longer crashes | object of type 'Atom' has no len() on some ligands |
| Python API report fixed | generate_report() rendered every residue as UNK?? when passed mapper.interactions |
| Regression test suite | 18 tests, no external downloads |
--dpi, --title, --no-3d-cues now take effect |
All three were accepted by the CLI but never reached the renderer |
What's New in v4.2
| Feature | Description |
|---|---|
| Scientifically validated cutoffs | H-bond lower bound 2.5 Å, ionic/salt bridge 5.5 Å, halogen lower bound 2.5 Å — aligned with PLIP and crystallographic surveys |
| RDKit 2D coordinates | Chemically accurate 2D ligand layout when RDKit is available; PCA projection fallback requires no extra dependencies |
| Topology-based ring detection | Iterative leaf-node pruning on the bond graph — identifies rings of any size without SMILES |
| Exact aromatic atom filtering | Per-residue ring-atom name sets (PHE/TYR/TRP/HIS) eliminate false π-system contacts from β-carbons |
| Improved ΔG estimation | Per-residue deduplication + distance decay + rotatable bond entropy penalty; thermodynamically calibrated Kd labels at 298 K |
| Trajectory analysis | Multi-frame PDB/NMR ensemble analysis with per-interaction occupancy statistics and CSV export |
| Arc stagger in 2D diagram | Multiple interactions to the same residue fan out with alternating curvature — no marker overlap |
--deltaG CLI flag |
Estimate binding free energy directly from the command line |
Features
-
15 interaction classes detected with crystallographically validated distance thresholds:
- Hydrogen bonds (2.5–3.5 Å, N/O pairs, D–H···A ≥ 100° when hydrogens are present)
- π–π stacking, cation–π, pi–cation, carbon–π, donor–π, amide–π, alkyl–π
- Hydrophobic contacts (4.0 Å)
- Ionic / salt bridge (5.5 Å) — one class; see note below
- Halogen bonds (2.5–3.5 Å; F, Cl, Br, I)
- Metal coordination (2.8 Å)
- Covalent bonds (≤2.1 Å, CYS/SER/LYS/HIS)
- Attractive and repulsive charge interactions
Earlier releases advertised 16 classes by listing
ionicandsalt_bridgeseparately. They share one detection rule and one set of cutoffs, so they are reported as a single class and scored once. -
Five output formats: 2D PNG diagram, interactive 3D HTML (3Dmol.js), plain-text report, machine-readable CSV (
--csv), and a four-panel graphical report (--plots) -
Empirical ΔG scoring with per-residue deduplication, distance decay, and rotor penalty
-
Multi-frame trajectory analysis with occupancy statistics and CSV export
-
Solvent accessibility: DSSP (preferred) → Shrake–Rupley fallback → geometric fallback
-
Multi-format input: PDB, mmCIF/CIF, PDBQT (AutoDock Vina)
Installation
pip install pandamap
Optional dependencies
pip install pandamap[fancy]   # coloured CLI output (rich)
pip install pandamap[viz]     # programmatic 3D viewer (py3Dmol)
pip install pandamap[full]    # all extras
External optional: DSSP (accurate solvent accessibility)
brew install dssp                          # macOS
sudo apt-get install dssp                  # Linux
# Windows: https://swift.cmbi.umcn.nl/gv/dssp/
RDKit (for chemically accurate 2D ligand coordinates):
conda install -c conda-forge rdkit        # recommended
pip install rdkit                          # pip alternative
PandaMap works without RDKit — it falls back to PCA-based 2D projection automatically.
Quick Start
# 2D interaction diagram
pandamap structure.pdb

# Specify ligand, generate report and 3D viewer
pandamap complex.pdb --ligand PFL --report --3d

# Estimate binding free energy
pandamap complex.pdb --ligand PFL --deltaG

# Full analysis
pandamap complex.pdb --ligand LIG --report --3d --deltaG --dpi 300
Command-Line Reference
pandamap <structure_file> [options]

Positional arguments:
  structure_file          Path to PDB, mmCIF/CIF, or PDBQT file

Options:
  -l, --ligand NAME       Three-letter residue code of the ligand (default: auto-detect)
  -o, --output FILE       Output PNG file path
  -r, --report            Generate plain-text interaction report
  --report-file FILE      Path for text report
  --3d                    Generate interactive 3D HTML visualization
  --3d-output FILE        Path for 3D HTML file
  --deltaG                Estimate binding free energy (ΔG, kcal/mol)
  --csv [FILE]            Export every interaction as a tidy CSV
  --plots [FILE]          Four-panel graphical interaction report (PNG)
  --strict-halogens       Restrict halogen bonds to Cl/Br/I (see note below)
  --strict-hbond-geometry Also apply the heavy-atom angular proxy to
                          structures without explicit hydrogens
  --dpi DPI               Output PNG resolution (default: 300)
  -t, --title TEXT        Custom diagram title
  --width PX              3D viewer width in pixels (default: 800)
  --height PX             3D viewer height in pixels (default: 600)
  --no-surface            Hide protein surface in 3D viewer
  --no-3d-cues            Disable depth cues in 2D diagram
  -v, --version           Show version
  -h, --help              Show help
Python API
Single-structure analysis
from pandamap import HybridProtLigMapper

mapper = HybridProtLigMapper("complex.pdb", ligand_resname="LIG")
mapper.detect_interactions()

# 2D diagram
mapper.visualize(output_file="interactions.png")

# Text report — simplest route, identical output to `pandamap --report`
mapper.run_analysis(output_file="interactions.png",
                    generate_report=True,
                    report_file="report.txt")

# Machine-readable table of every contact
mapper.export_interactions_csv("interactions.csv")

# Four-panel graphical report
mapper.generate_interaction_plots("report.png")

# Inspect raw interactions
for itype, contacts in mapper.interactions.items():
    if contacts:
        print(f"{itype}: {len(contacts)} contacts")
If you need the report generator directly, the parameters are ligand_info
and interactions (earlier revisions of this README named them
ligand_metadata and interaction_data, which raises TypeError):
from pandamap.improved_interaction_detection import ImprovedInteractionDetection

ImprovedInteractionDetection().generate_report(
    ligand_info={
        'hetid': mapper.ligand_residue.resname,
        'chain': mapper.ligand_residue.parent.id,
        'position': mapper.ligand_residue.id[1],
        'longname': mapper.ligand_residue.resname,
        'type': 'LIGAND',
    },
    interactions=mapper.interactions,
    output_file="report.txt"
)
Fixed in 4.3. Passing
mapper.interactionstogenerate_report()previously produced lines readingUNK?? -- 2.79Å -- SU9, because the formatter expected flattenedrestype/resnr/reschainkeys that only the CLI code path filled in. Both paths now normalise their input, so the Python API and the CLI produce identical reports.
Empirical ΔG estimation
result = mapper.estimate_binding_affinity()

print(f"ΔG ≈ {result['dG_estimated']:.2f} kcal/mol")
print(result['interpretation'])
print(result['note'])

for itype, info in result['breakdown'].items():
    print(f"  {itype} (n={info['unique_residues']}): {info['contribution_kcal_mol']:+.2f} kcal/mol")
ΔG interpretation (298 K, ΔG = −RT·ln Kd):
| ΔG (kcal/mol) | Kd range | Label |
|---|---|---|
| < −12 | ~nM or better | Very strong binder |
| −9 to −12 | nM–µM | Strong binder |
| −6 to −9 | µM | Moderate binder |
| −3 to −6 | mM | Weak binder |
| ≥ −3 | — | Very weak / no binding |
Note: Empirical estimate ±2–3 kcal/mol. Not a substitute for FEP or MM-GBSA.
3D visualization
from pandamap.create_3d_view import create_pandamap_3d_viz

create_pandamap_3d_viz(
    mapper=mapper,
    output_file="interactions_3d.html",
    width=1024,
    height=768,
    show_surface=True
)
Multi-frame trajectory analysis
from pandamap import analyze_trajectory

summary = analyze_trajectory(
    trajectory_file="simulation.pdb",    # multi-MODEL PDB
    ligand_resname="LIG",
    output_dir="./trajectory_output",
    visualize_frames=False               # set True to generate per-frame PNGs
)

print(f"Frames analysed: {summary['n_frames']}")
print(f"Mean ΔG: {summary['mean_dG']:.2f} ± {summary['std_dG']:.2f} kcal/mol")
# Per-residue occupancy CSV written to ./trajectory_output/trajectory_analysis.csv
Distance Cutoffs
All cutoffs are validated against PLIP and published crystallographic surveys:
| Interaction | Cutoff | Reference |
|---|---|---|
| Hydrogen bond | 2.5–3.5 Å, D–H···A ≥ 100° | PLIP; Auffinger 2004 |
| π–π stacking | 5.5 Å (atom–atom) | McGaughey 1998 |
| Hydrophobic | 4.0 Å | Bissantz 2010 |
| Ionic / salt bridge | 5.5 Å | Kumar & Nussinov 1999 |
| Halogen bond | 2.5–3.5 Å | Auffinger 2004 |
| Metal coordination | 2.8 Å | CSD surveys |
| Covalent | 1.2–2.1 Å, non-metal ligand atom | — |
| Repulsion | 4.0 Å | — |
Hydrogen-bond geometry
The angular criterion is applied in two tiers:
- Explicit hydrogens present (neutron, ultrahigh-resolution, NMR, or
protonated models) — the true D–H···A angle is measured in both donor
directions and must exceed 100°, matching PLIP's
HBOND_DON_ANGLE_MIN. - No hydrogens (most X-ray structures) — distance only, as before. A
heavy-atom angular proxy is available via
--strict-hbond-geometry, but it is off by default: without hydrogens it cannot tell donor from acceptor and rejects many genuine bonds.
Each detected bond records angle and angle_source (explicit_H or
heavy_atom) so you can tell which rule applied.
Halogen bonds and fluorine
All four halogens — F, Cl, Br and I — are reported by default, matching PLIP, which also lists C–F···O contacts.
Note for interpretation: organic fluorine has a negligible σ-hole and is not a
halogen-bond donor in the strict sense of Auffinger et al. (2004), which
defines the interaction for Cl, Br and I. Every halogen contact therefore
carries a halogen_element field so fluorine can be separated during
analysis, and --strict-halogens restricts detection to Cl/Br/I if you want
the conservative definition.
Upgrading from 4.2
Version 4.3 fixes defects that affect reported results. Numbers will change:
- Ligands containing Cl, Br or I gain halogen bonds that were previously undetectable. On PDB 1US0 this recovers the Br···O(Thr113) bond at 2.97 Å.
- Ligands with carboxylate, phosphate or sulfonate groups gain ionic contacts that ligand anion perception previously missed.
- ΔG becomes less negative for anything with charged groups, because ionic contacts are no longer counted twice (−1.80 and −1.50). Benchmark shifts: 1ELS −21.97 → −18.10, 1M17 −1.43 → −0.86, 1US0 −10.52 → −13.92 (1US0 becomes more negative, since it gains the bromine bond and two carboxylate contacts).
If you have published numbers from 4.2, re-run rather than mixing versions.
Example Outputs
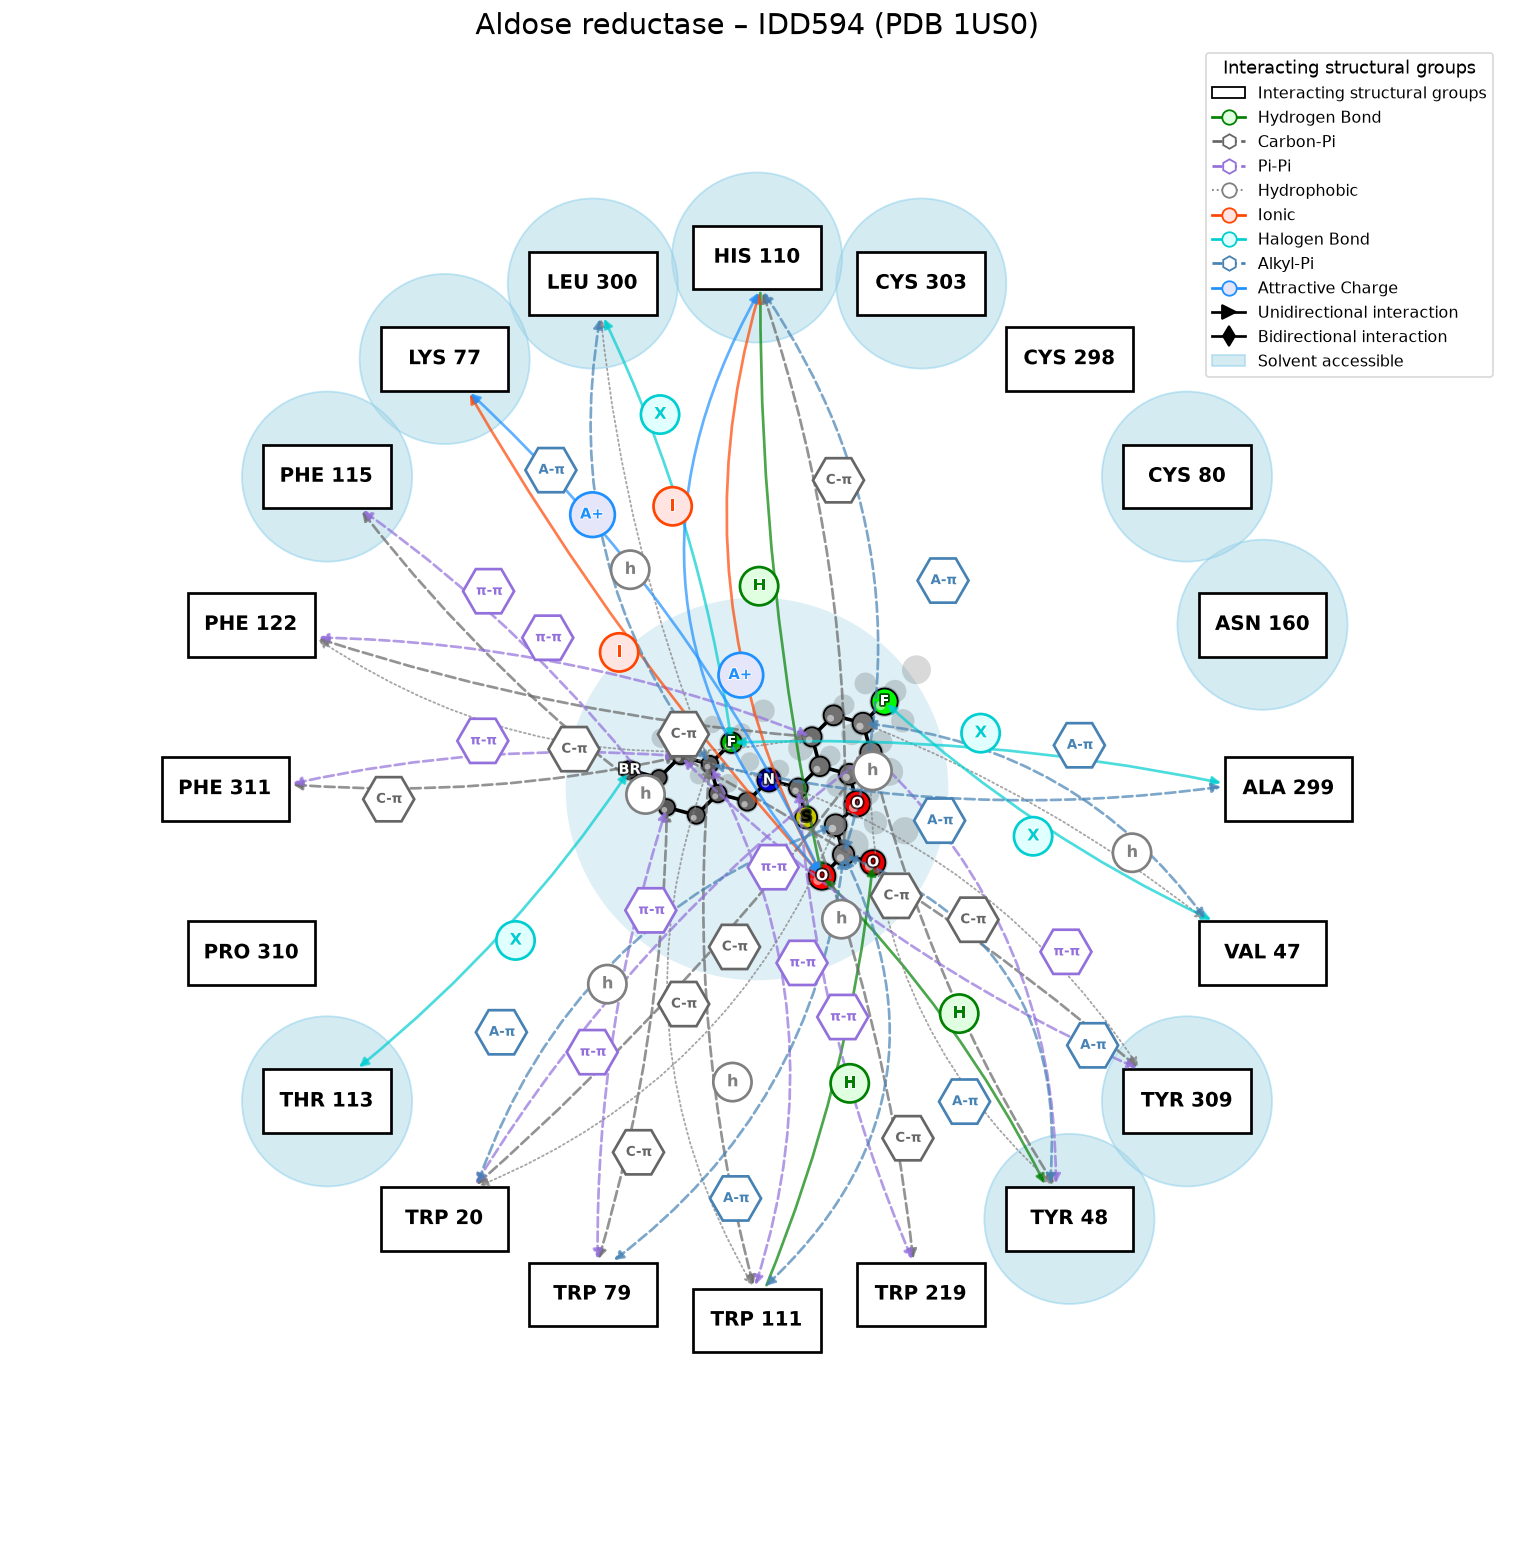
2D Interaction Diagram
Aldose reductase–IDD594 (PDB 1US0). The halogen bond from the ligand bromine to Thr113 (cyan, X) is one of the contacts recovered by the 4.3 halogen fix; cyan haloes mark solvent-accessible residues.
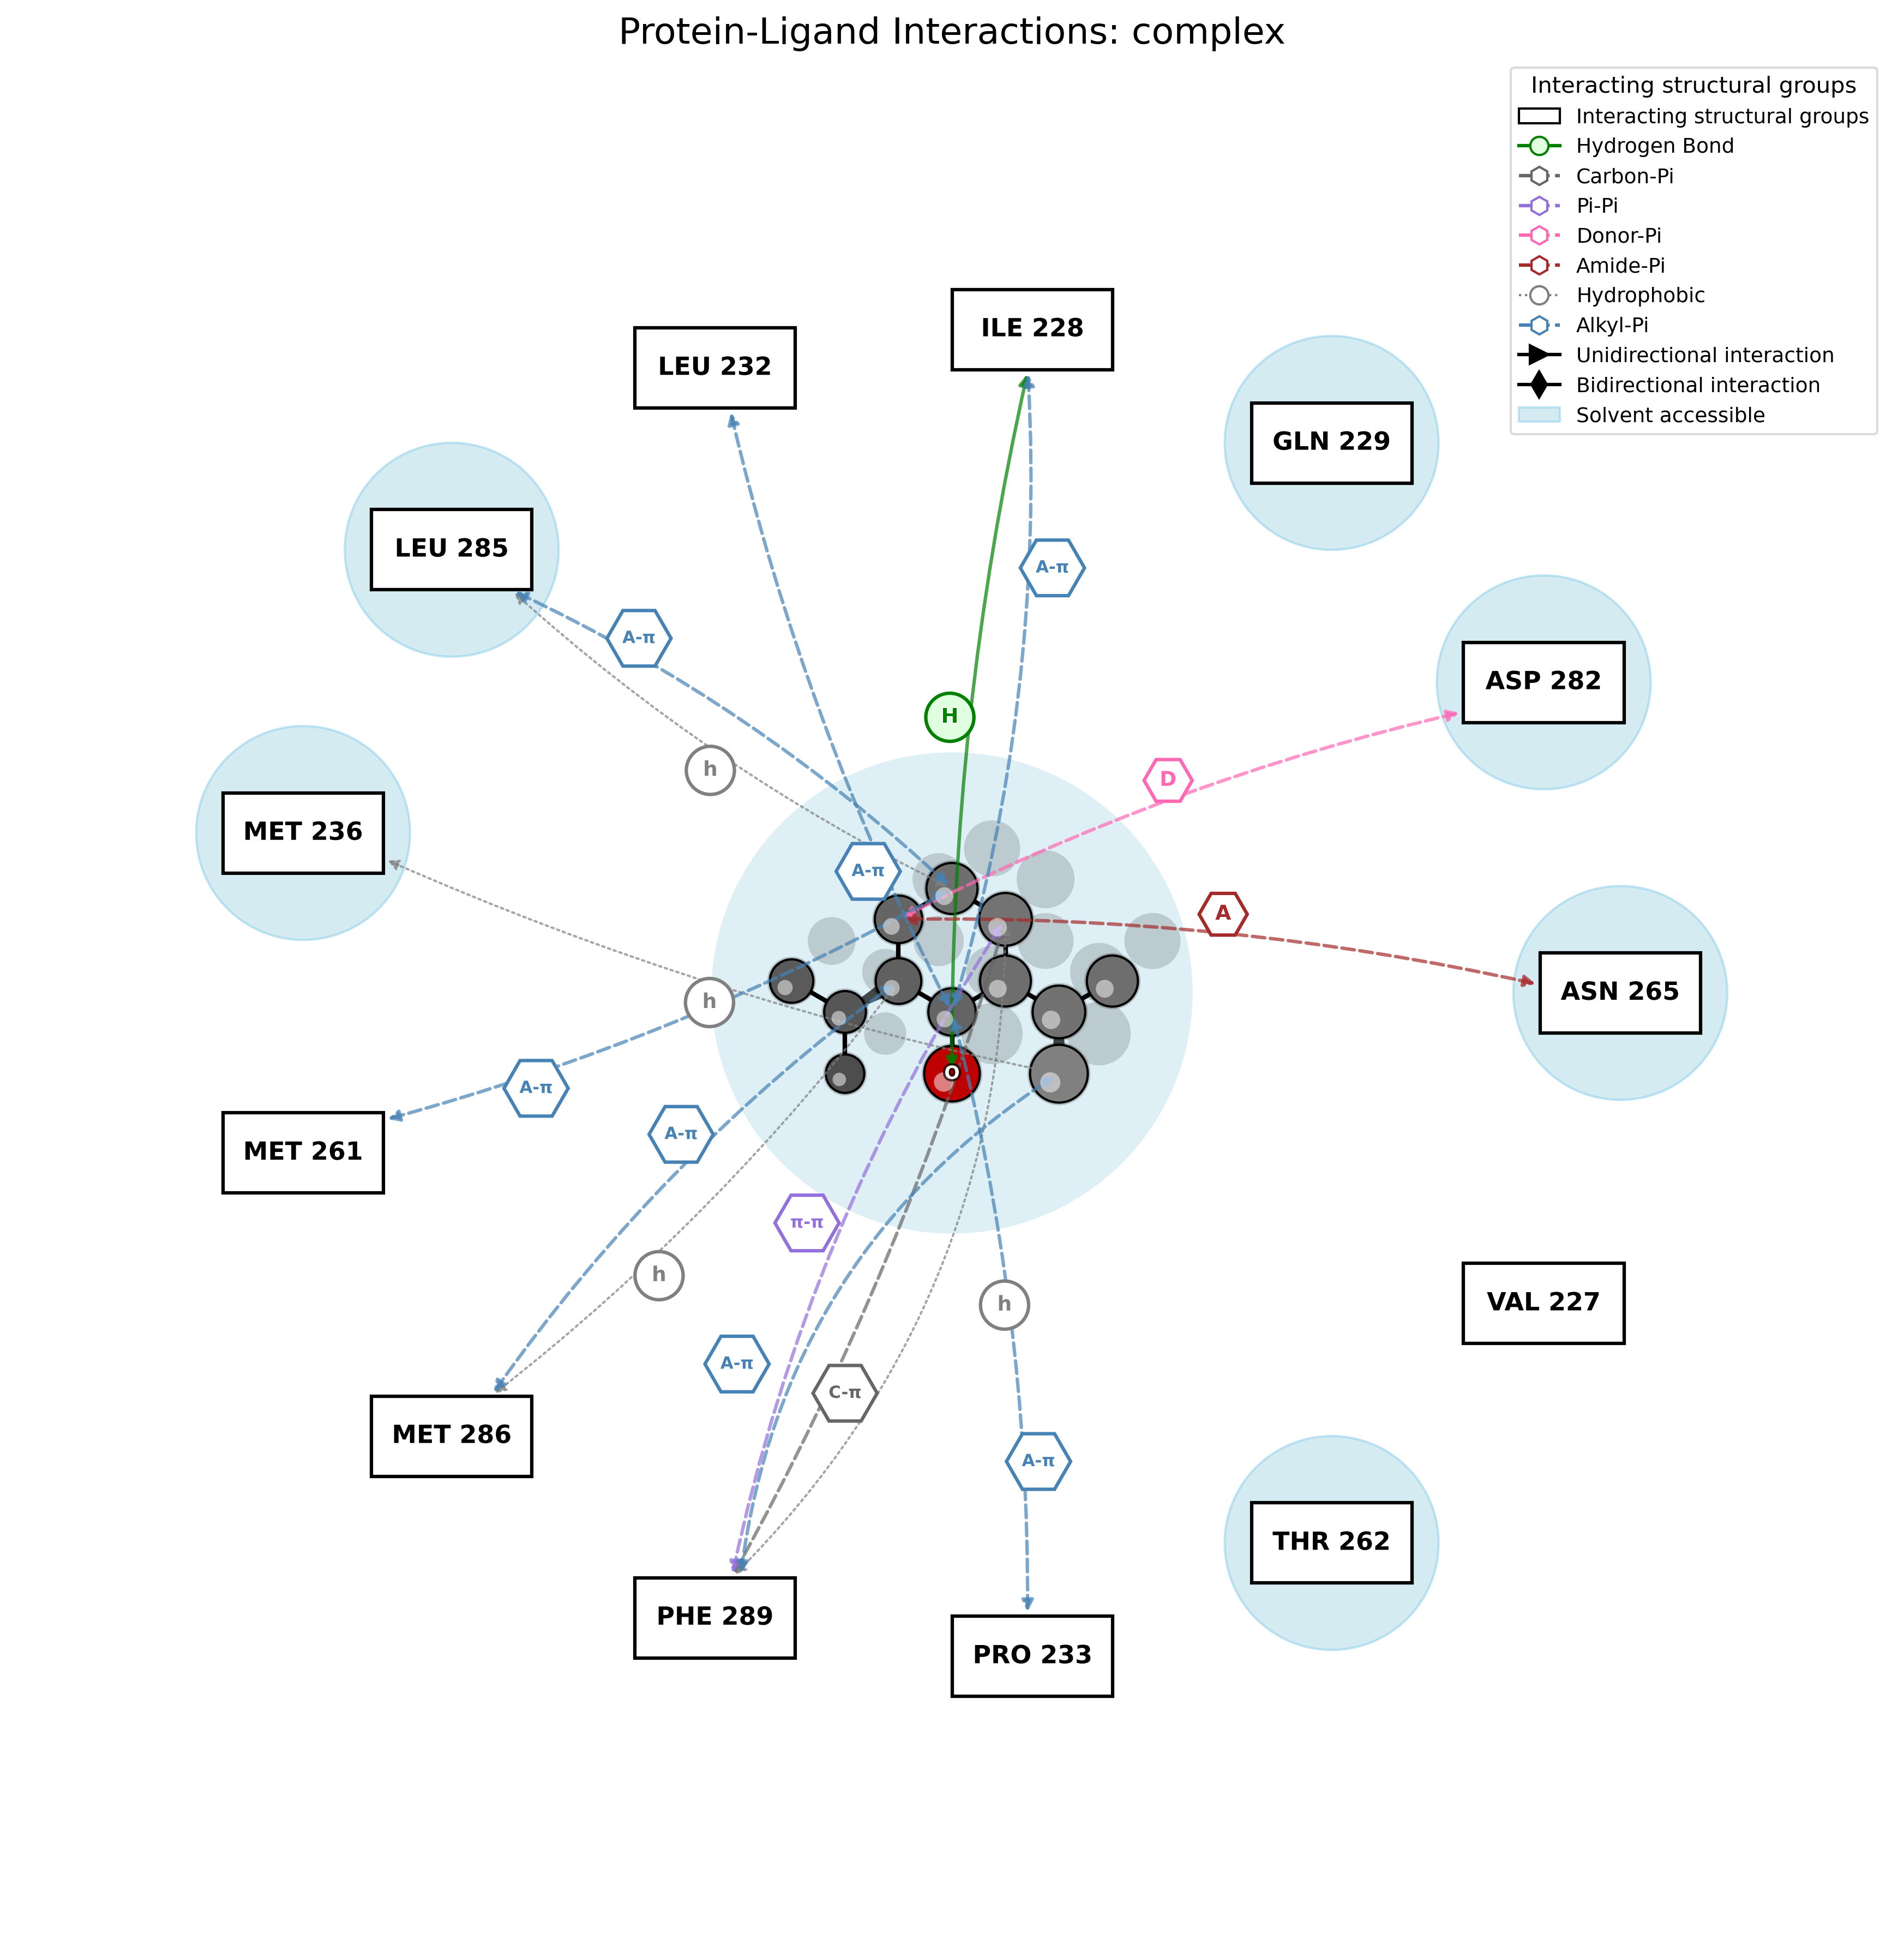
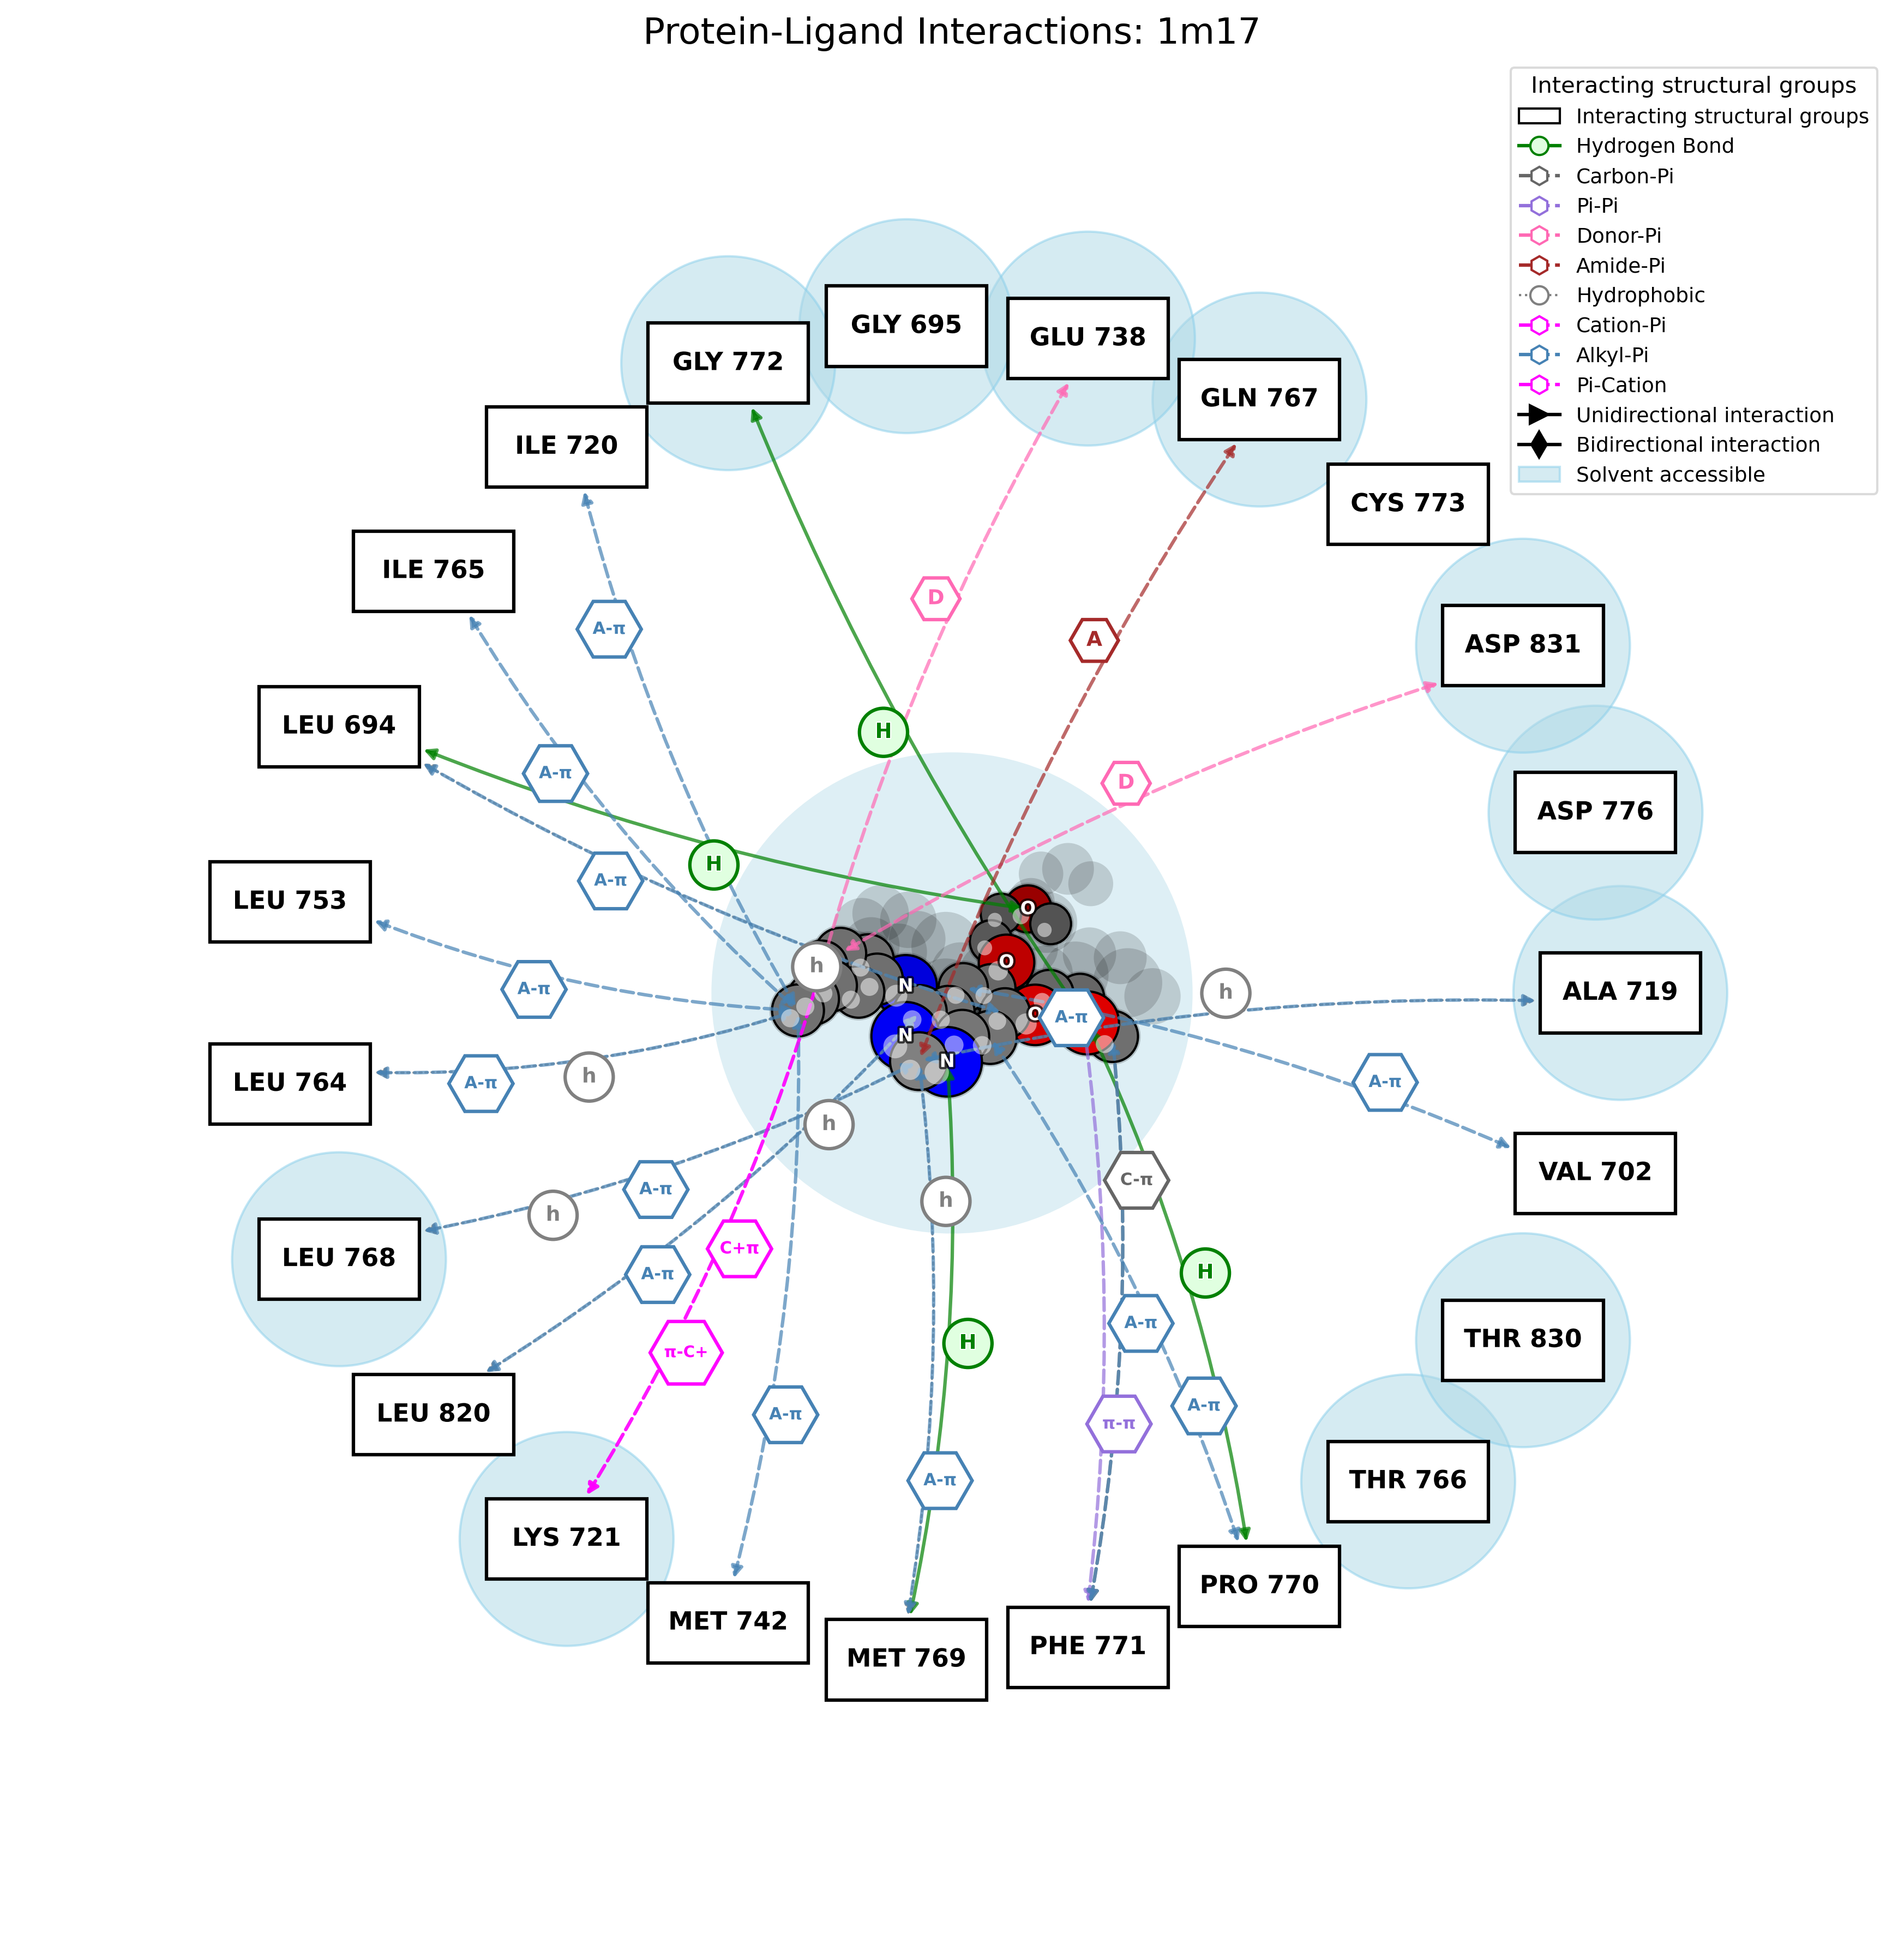
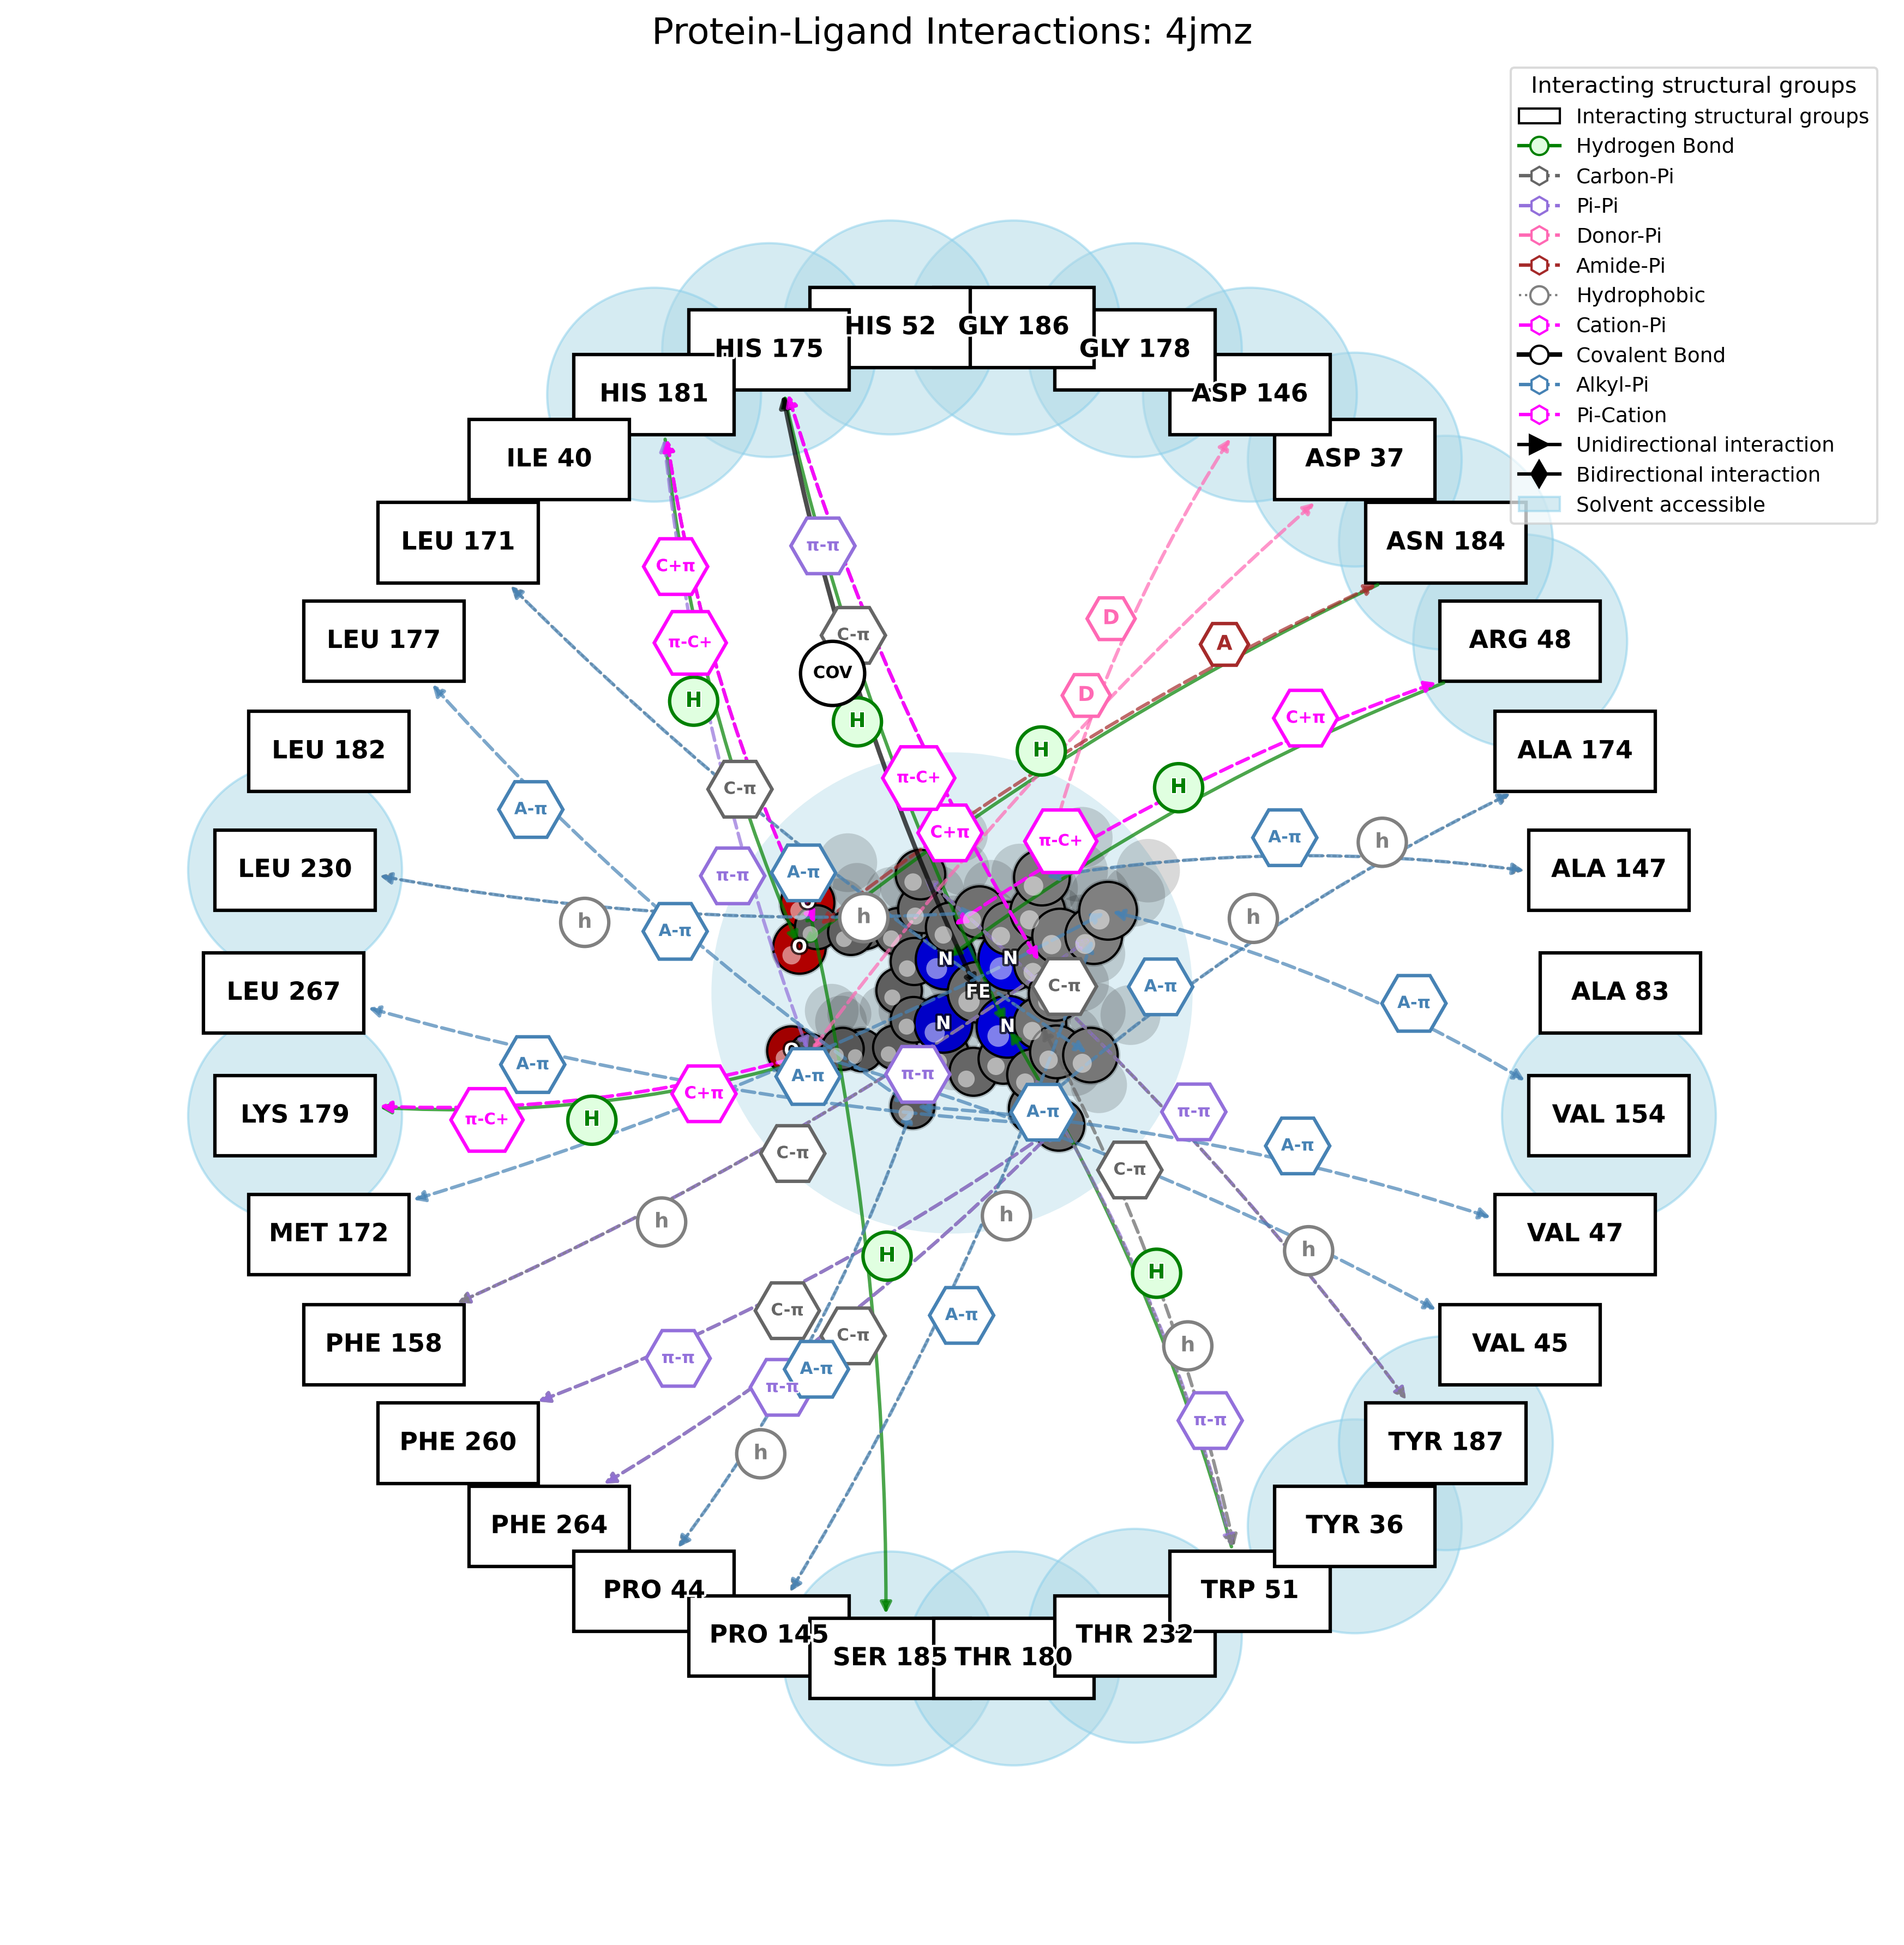
Further examples:
Graphical Report (--plots)
pandamap 1US0.pdb --ligand LDT --plots report.png
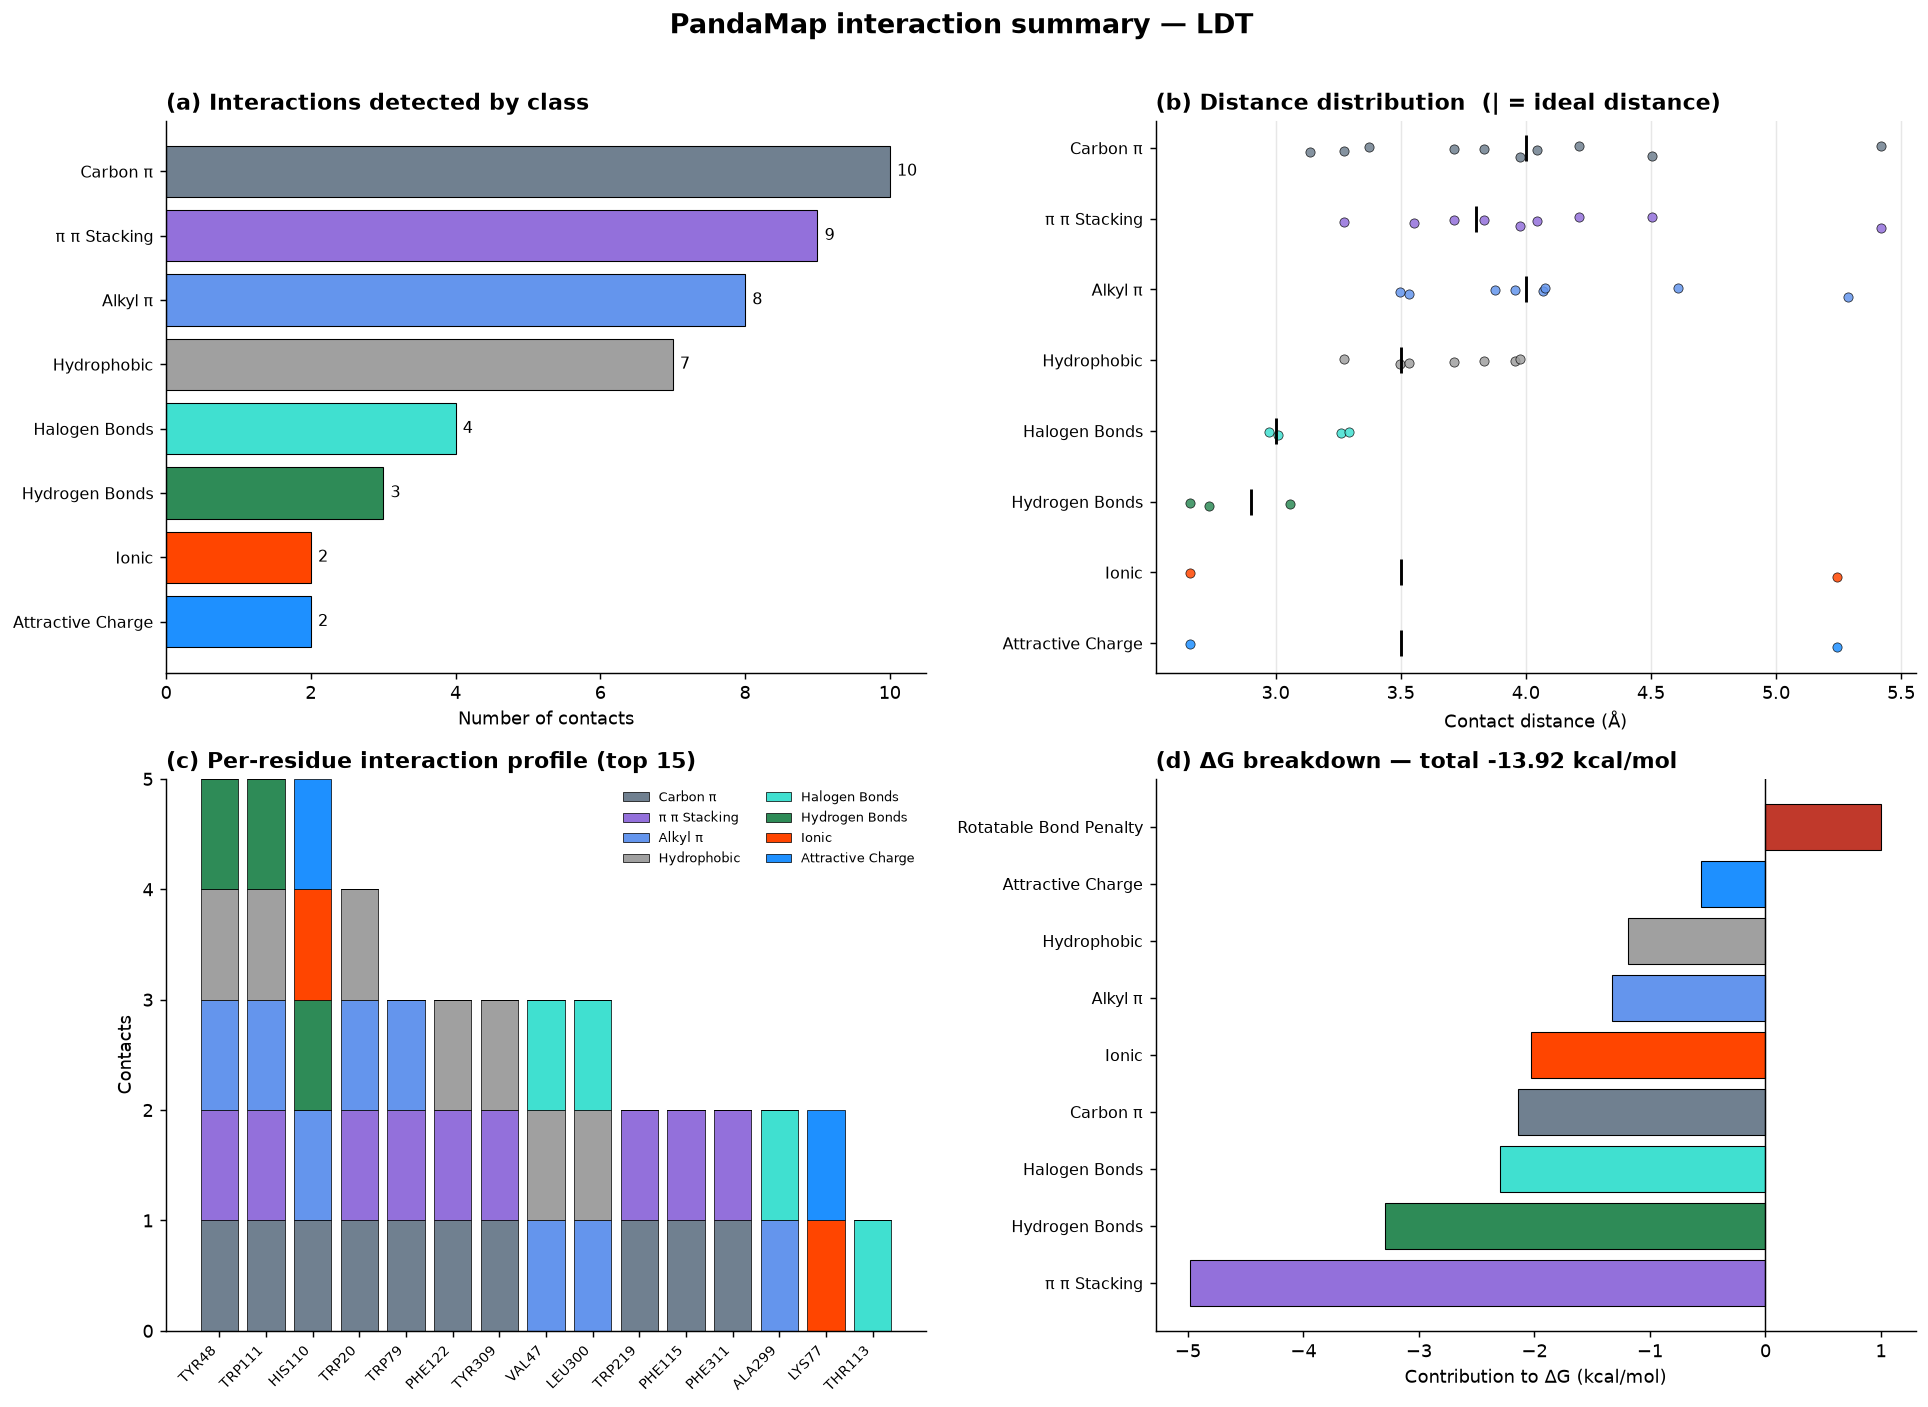
Four panels, complementing the text report rather than replacing it:
| Panel | Shows |
|---|---|
| (a) Contacts per class | Which interaction types dominate |
| (b) Distance distribution | Every contact against its ideal distance — separates near-optimal geometry from contacts scraping the cutoff |
| (c) Per-residue profile | Top 15 residues stacked by interaction class; identifies hotspot residues at a glance |
| (d) ΔG breakdown | Per-class contribution, penalties in red |
CSV Export (--csv)
pandamap 1US0.pdb --ligand LDT --csv interactions.csv
One row per contact — the text report is readable but not parseable:
interaction_type,protein_residue,protein_resnum,protein_chain,protein_atom,ligand_atom,ligand_element,distance_A,solvent_accessible,halogen_element
halogen_bonds,THR,113,A,OG1,BR8,Br,2.97,True,Br
hydrogen_bonds,TYR,48,A,OH,O33,O,2.73,True,
Text Report
=============================================================================
PandaMap Interaction Report
=============================================================================

Ligand: PAH:A:439
Name: PAH
Type: LIGAND

Interacting Chains: A
Interacting Residues: 13

Interaction Summary:
  Hydrogen Bonds: 10
  Carbon-π Interactions: 1
  Metal Coordination: 4
  Ionic Interactions: 2
  Salt Bridges: 2
  Alkyl-π Interactions: 1
  Attractive Charge: 2
  Repulsion: 5

Hydrogen Bonds:
  1. GLU168A  -- 2.66Å -- PAH
  2. ASP246A  -- 2.60Å -- PAH
  3. GLN167A  -- 3.10Å -- PAH
  4. ASP320A  -- 3.46Å -- PAH
  5. LYS396A  -- 3.05Å -- PAH
  ...

=============================================================================
ΔG Estimation Output
--- Estimated Binding Affinity ---
  ΔG ≈ -7.42 kcal/mol
  Strong binder (Kd ~nM–µM range)
  Breakdown:
    hydrogen_bonds (n=10): -8.63 kcal/mol
    metal_coordination (n=4): -6.80 kcal/mol
    ionic (n=2): -2.91 kcal/mol
    hydrophobic (n=3): -0.72 kcal/mol
    rotatable_bond_penalty (n=2): +1.00 kcal/mol
----------------------------------
Citation
If you use PandaMap in your research, please cite:
Pritam Kumar Panda. (2025). PandaMap: A Python Package for Comprehensive
Visualization of Protein–Ligand Interaction Networks and Empirical Binding
Affinity Estimation. Stanford University, CA, USA
https://github.com/pritampanda15/PandaMap
License
MIT License — see LICENSE for details.
1 maintainer

Download files
Download the file for your platform. If you're not sure which to choose, learn more about installing packages.
Source Distribution
Built Distribution
Filter files by name, interpreter, ABI, and platform.
If you're not sure about the file name format, learn more about wheel file names.
Copy a direct link to the current filters
File details
Details for the file pandamap-4.3.0.tar.gz.
File metadata
- Download URL: pandamap-4.3.0.tar.gz
- Upload date:
- Size: 68.9 kB
- Tags: Source
- Uploaded using Trusted Publishing? No
- Uploaded via:
twine/7.0.0 CPython/3.13.12
File hashes
| Algorithm | Hash digest | |
|---|---|---|
| SHA256 |
befa67149bdad3d20d7da066935c22d7e97c2288bfeec4b709efd7dac160a1f1
|
|
| MD5 |
b7fe3361d7296a0905af3a3b938654f4
|
|
| BLAKE2b-256 |
7b55541fb16f1fe2f196aaebe325b0247a11be2b8b3fca4fde4da9f11ae996e2
|
File details
Details for the file pandamap-4.3.0-py3-none-any.whl.
File metadata
- Download URL: pandamap-4.3.0-py3-none-any.whl
- Upload date:
- Size: 60.9 kB
- Tags: Python 3
- Uploaded using Trusted Publishing? No
- Uploaded via:
twine/7.0.0 CPython/3.13.12
File hashes
| Algorithm | Hash digest | |
|---|---|---|
| SHA256 |
88552f120023296040018e5becc3fe919b525ef1a8936f80ab17b3e9ff441adf
|
|
| MD5 |
8abc65a07c58e193ee7def5f650c94d5
|
|
| BLAKE2b-256 |
54b20b5581834672573c78ecfaf23286d6623b4431601166166fb6667eca3138
|














