
pandas-plots
a comprehensive python package for enhanced data visualization and analysis with pandas dataframes. provides a high-level api for creating beautiful tables, plots, venn diagrams, and utility functions with minimal code.




- pandas-plots
📦 installation
install package using uv (recommended)
uv add -U pandas-plots
use in python source
from pandas_plots import tbl, pls, hlp, const
🚀 features
- table utilities (
tbl): style dataframes as HTML tables with heatmaps, totals, kpi indicators, and percentages; describe column distributions with a single call - plotting functions (
pls): plotly-based box plots, histograms, stacked bars, sankey diagrams, upset plots, facet charts, and more - helper functions (
hlp): configure rendering for markdown export, cascade duckdb filters with counts, notebook and file utilities - cli (
cli): convert Jupyter notebooks to Markdown or HTML for publishing
📤 publishing
[!TIP] this package enables
.ipynbpublishing:
- converts notebooks to
markdownorhtml- styled pandas tables are rendered as images, retaining all features
- images can be scaled for better visual impression
- supports
githubandgitlabanchors- supports github auto theme (
theme="system")- supports alternative texts in images
- html output can use image folders or inline base64 encoding
- supports easy csv export of diagram data
- can force pdf friendly options to avoid pdf artifacts
notebook setup
call hlp.setup_rendering() at the top of your notebook to configure alle rendering settings:
# src/my_notebook.ipynb

from pandas_plots import hlp

hlp.setup_rendering(
    static=True,           # True for static rendering, False for interactive
    apply_dark_theme=False
)
convert to markdown
# src/convert.ipynb

from pandas_plots.cli.converter import jupyter_to_md

jupyter_to_md(
    path="src/my_notebook.ipynb",
    output_dir="./docs",      # output folder (created if missing)
    no_input=True,            # strip input cells from output
    execute=True,             # re-execute notebook before converting
    theme="system",           # None | "light" | "dark" | "system"
    chrome_path="/Applications/Chromium.app/Contents/MacOS/Chromium"  #  path to `ungoogled-chromium` binary
)
convert to html
from pandas_plots.cli.converter import jupyter_to_html

jupyter_to_html(
    path="src/my_notebook.ipynb",
    output_dir="./docs",
    no_input=True,
    execute=False,
    use_base64=False,  # False = images in separate folder, True = inline base64
)
[!WARNING] conversion requires
ungoogled-chromiuminstalled, normalchromiumwont work anymore (see prerequisites section below)
🔍 examples
styled table
tbl.pivot_df(
    df[["color", "payment", "fare"]],
    total_mode="sum",
    total_axis="xy",
    data_bar_axis=None,
    total_exclude=True,
    pct_axis="xy",
    precision=0,
    heatmap_axis="xy",
    kpi_mode="rag_abs",
    kpi_rag_list=[1000, 10000],
    swap=True,
    font_size_td=12,
    font_size_th=14,
)
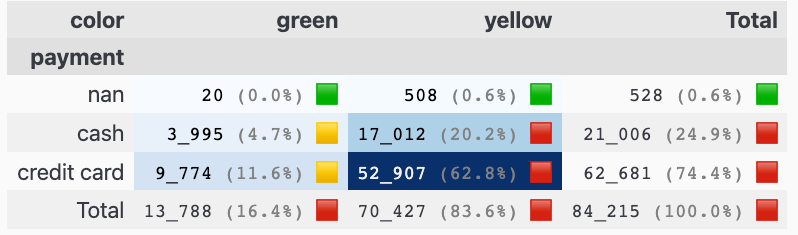
table description
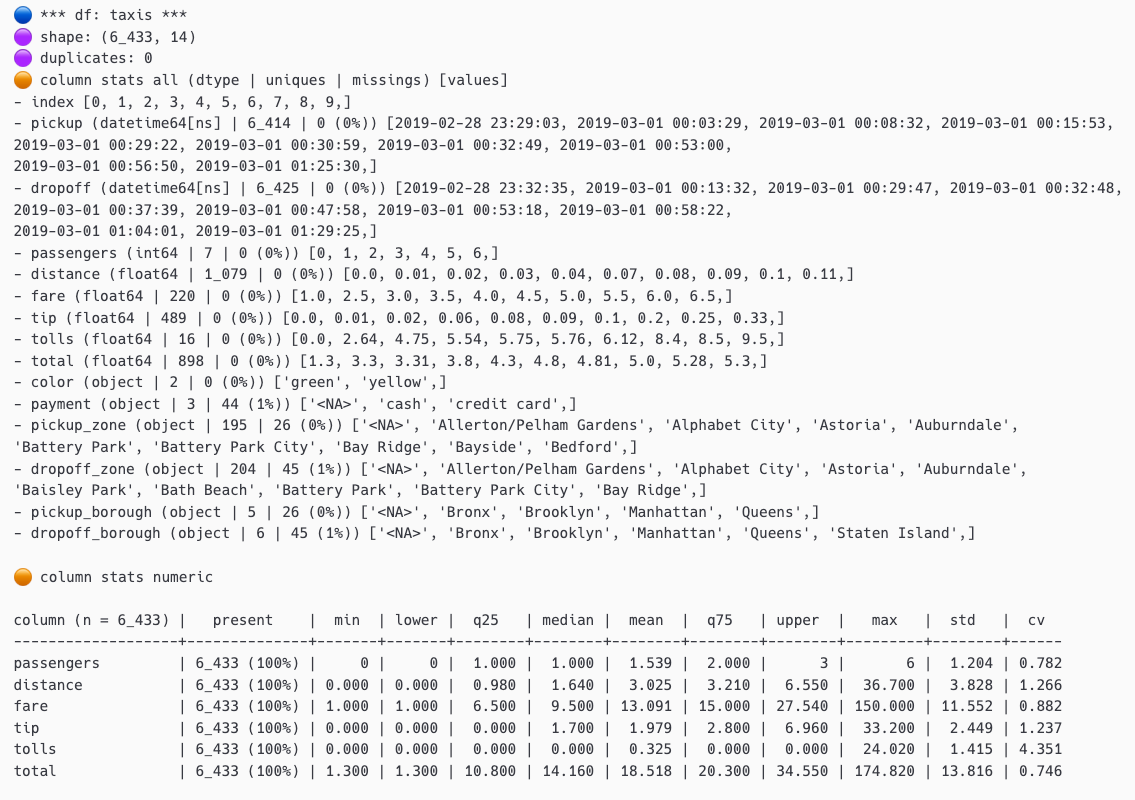
tbl.describe_df(
    df,
    caption="taxis",
    top_n_uniques=10,
    top_n_chars_in_columns=10,
    top_n_chars_in_index=15,
)
upset plot
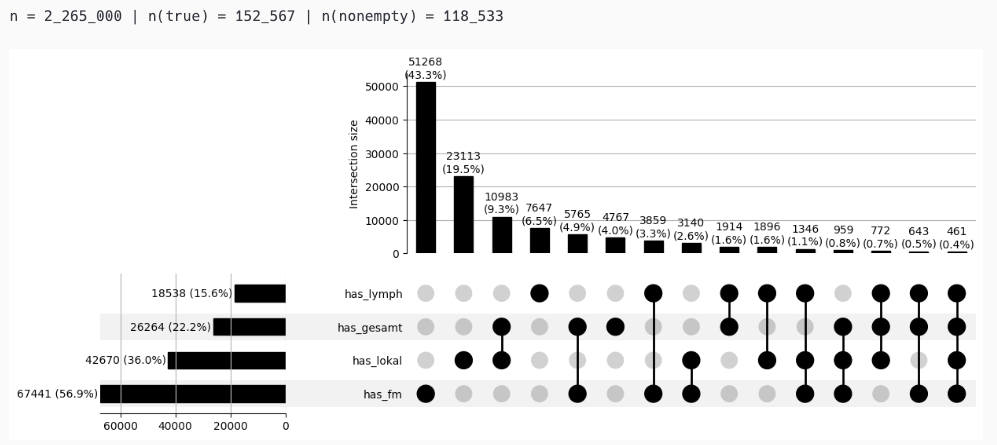
pls.plot_upset(
    df_upset,
    include_false_subsets=False,
    orientation="horizontal",
)
uml graph
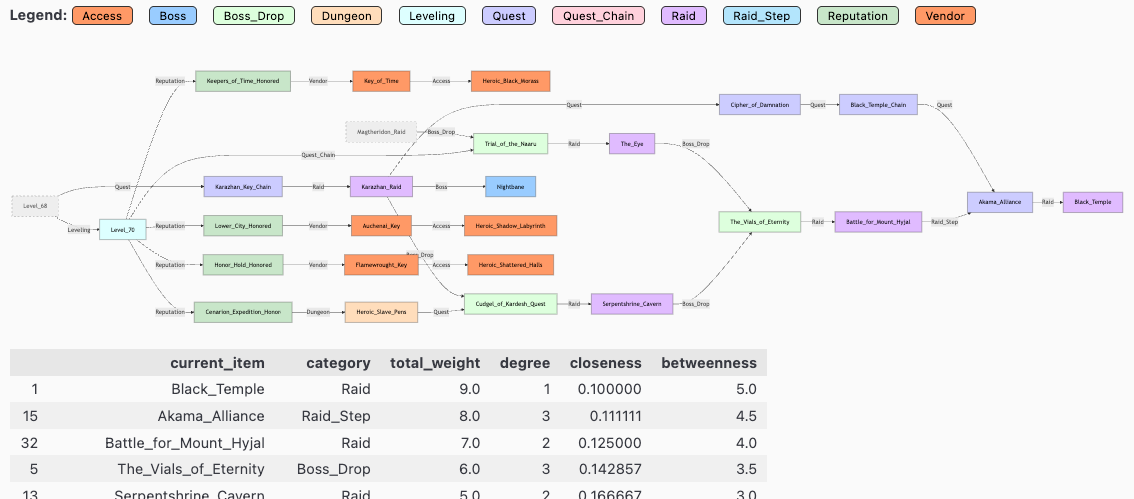
metrics = pls.plot_uml_graph()
set filter
filter = hlp.get_duckdb_filter_n(
    con,
    "from Tumor",
    FILTERS,
    # distinct_metric="z_pat_id",
)
counts: rows
---
n = 3_241_401                                     (100.0%) ██████████████████████████████
└ [2020-2023.07]:                   n = 2_633_644  (81.3%) ░░░░░░████████████████████████
└ [not z_is_dco]:                   n = 2_547_636  (78.6%) ░░░░░░░███████████████████████
└ [keine M1]:                       n = 2_305_215  (71.1%) ░░░░░░░░░█████████████████████
└ [keine Verstorbenen < 180 Tage]:  n = 2_132_064  (65.8%) ░░░░░░░░░░░███████████████████
└ [lympho- und mesoendokr. Tumore]:    n = 27_653   (0.9%) ░░░░░░░░░░░░░░░░░░░░░░░░░░░░░░
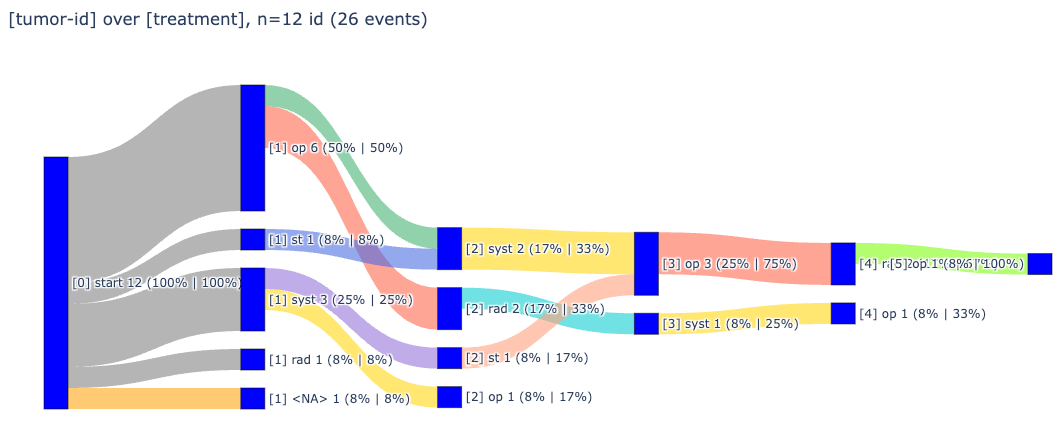
sankey diagram
_ = pls.plot_sankey(width=1000)
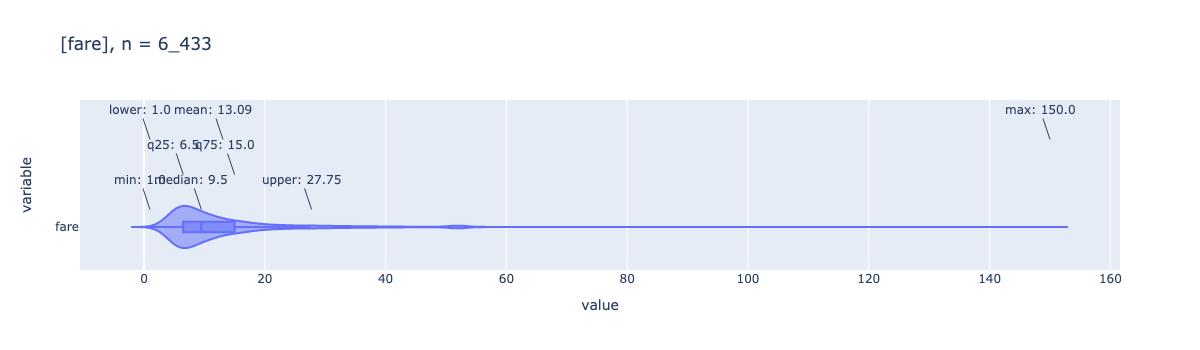
box plot with violin overlay
_ = pls.plot_box(df['fare'], height=400, violin=true)
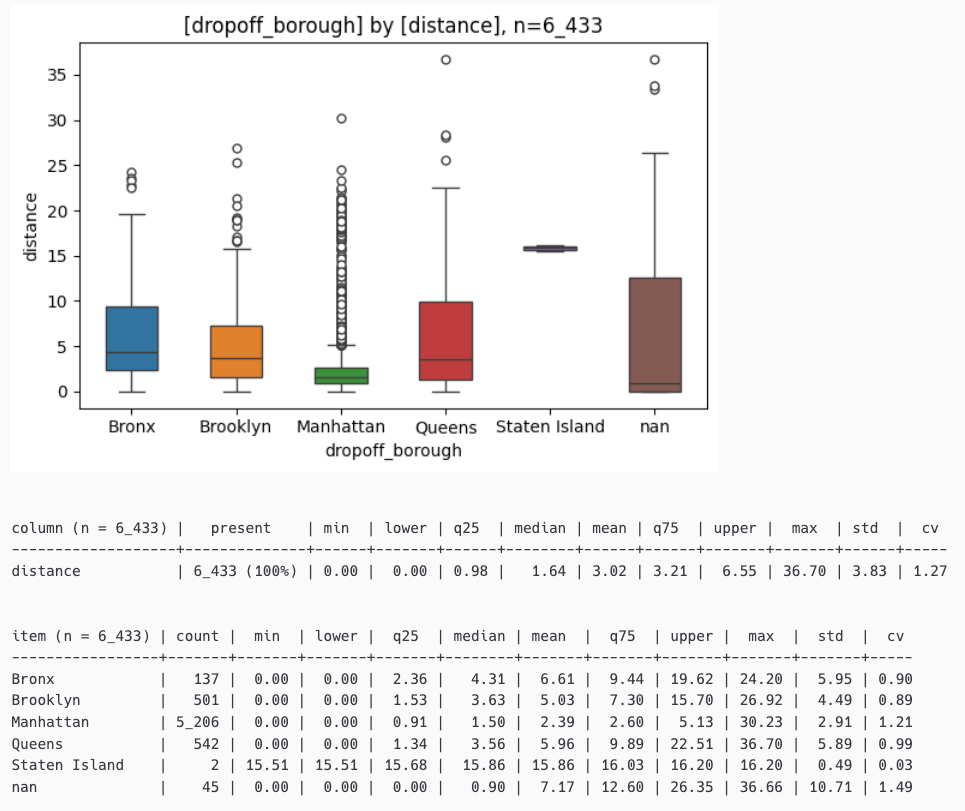
box plot with statistics
_ = pls.plot_boxes_large(df[["dropoff_borough","distance"]])
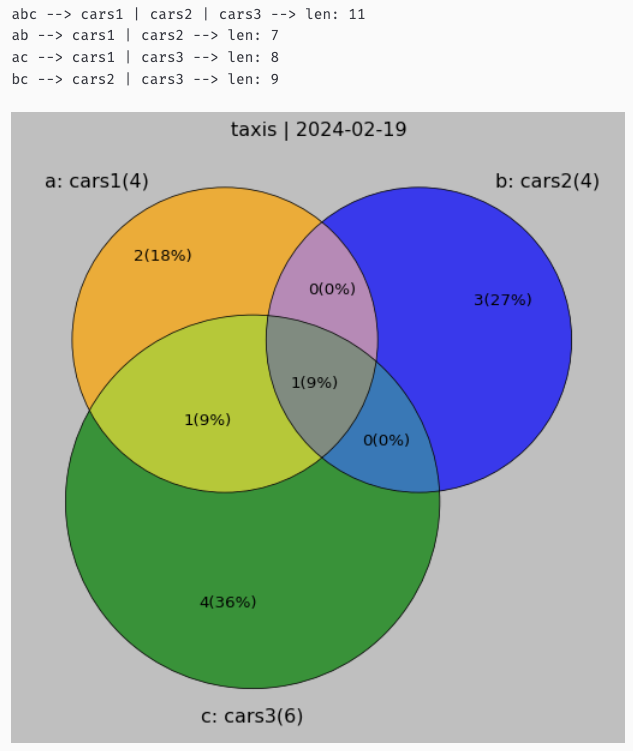
venn diagrams
# show venn diagram for 3 sets
set_a = {'ford','ferrari','mercedes', 'bmw'}
set_b = {'opel','bmw','bentley','audi'}
set_c = {'ferrari','bmw','chrysler','renault','peugeot','fiat'}

_df, _details = pls.plot_venn3(
    title="taxis",
    a_set=set_a,
    a_label="cars1",
    b_set=set_b,
    b_label="cars2",
    c_set=set_c,
    c_label="cars3",
    verbose=0,
    size=8,
)
📚 api reference
table utilities (tbl)
| function | description |
|---|---|
show_num_df() |
displays a table as styled version with additional information |
describe_df() |
alternative version of pandas describe() function |
descr_db() |
short description for a duckdb relation |
pivot_df() |
gets a pivot table of a 3 column dataframe (or 2 columns if no weights are given) |
print_summary() |
shows statistics for a pandas dataframe or series |
plotting functions (pls)
| function | description |
|---|---|
plot_box() |
auto annotated boxplot w/ violin option |
plot_boxes() |
multiple boxplots (annotation is experimental) |
plot_stacked_bars() |
shortcut to stacked bars |
plot_bars() |
standardized bar plot for categorical column with confidence intervals |
plot_histogram() |
histogram for one or more numerical columns |
plot_joints() |
joint plot for exactly two numerical columns |
plot_quadrants() |
quickly shows a 2x2 heatmap |
plot_facet_stacked_bars() |
stacked bars for a facet value as subplots |
plot_sankey() |
generates a sankey diagram |
plot_pie() |
generates a pie chart |
plot_box_large() |
for large datasets using seaborn |
plot_boxes_large() |
for large datasets using seaborn |
plot_histogram_large() |
for large datasets using seaborn |
plot_upset() |
generates an upset plot based on upsetplot |
plot_uml_graph() |
generates a uml graph based on mermaid for structured data |
plot_venn2() |
displays a venn diagram for 2 sets |
plot_venn3() |
displays a venn diagram for 3 sets |
helper functions (hlp)
| function | description |
|---|---|
to_series() |
converts a dataframe to a series |
mean_confidence_interval() |
calculates mean and confidence interval for a series |
wrap_text() |
formats strings or lists to a given width |
replace_delimiter_outside_quotes() |
replaces delimiters only outside of quotes in csv imports |
create_barcode_from_url() |
creates a barcode from a given url |
add_datetime_col() |
adds a datetime column to a dataframe (chainable) |
show_package_version() |
prints version of a list of packages |
get_os() |
helps identify and ensure operating system at runtime |
add_bitmask_label() |
adds a column that resolves a bitmask column into human-readable labels |
find_cols() |
finds all columns in a list that contain any of the given stubs |
add_measures_to_pyg_config() |
adds measures to a pygwalker config file |
get_tum_details() |
prints details of a specific tumor (requires connection to clinical cancer data) |
get_duckdb_filter_n() |
print rowcounts for cascading filters in duckdb with ansi bars |
print_filter() |
prints filter as markdown sql codeblock |
is_ipynb() |
detects if code is running in jupyter notebook |
prepend_uv_header() |
prepends uv header to a .py script to make it executable for uv run command |
create_py_script() |
creates a .py script from a .ipynb file |
setup_rendering() |
triggers clean(er) rendering of plots and pandas tables to markdown |
find_str_in_duckdb() |
finds a given string in all tables of a DuckDB database |
export_plot_data() |
exports the dataframe used for a plot to ./data/.csv |
retrieve_file_from_gist() |
downloads a file from a github gist to the current directory |
🧩 prerequisites
- python 3.10+: compatible with python versions 3.10 - 3.13
- uv: uv is recommended for package management
⚠️ this package depends on
numpy<2.0.0sinceUpSetPlotis still tied to the previous versions
🤝 contributing
contributions are welcome! please feel free to submit a pull request. for major changes, please open an issue first to discuss what you would like to change.
📄 license
this project is licensed under the MIT license - see the license file for details.
🏷️ tags
#pandas #visualizations #statistics #data-science #data-analysis #python
1 maintainer

Download files
Download the file for your platform. If you're not sure which to choose, learn more about installing packages.
Source Distribution
Built Distribution
Filter files by name, interpreter, ABI, and platform.
If you're not sure about the file name format, learn more about wheel file names.
Copy a direct link to the current filters
File details
Details for the file pandas_plots-2.1.0.tar.gz.
File metadata
- Download URL: pandas_plots-2.1.0.tar.gz
- Upload date:
- Size: 82.1 kB
- Tags: Source
- Uploaded using Trusted Publishing? No
- Uploaded via:
twine/7.0.0 CPython/3.13.14
File hashes
| Algorithm | Hash digest | |
|---|---|---|
| SHA256 |
4214abbb053484a6f1c9ec42499d1a7c7e000517df5a6a3e7c2adc370e86bbc4
|
|
| MD5 |
5d1c12844a859034f8fdd40740a8db10
|
|
| BLAKE2b-256 |
c9f1bb2b864002124fd8f8906ca1ee4566bb9a7f41a3920f4a9cd6fc1e94e219
|
File details
Details for the file pandas_plots-2.1.0-py3-none-any.whl.
File metadata
- Download URL: pandas_plots-2.1.0-py3-none-any.whl
- Upload date:
- Size: 109.9 kB
- Tags: Python 3
- Uploaded using Trusted Publishing? No
- Uploaded via:
twine/7.0.0 CPython/3.13.14
File hashes
| Algorithm | Hash digest | |
|---|---|---|
| SHA256 |
61d1946bc61e8a486aa513e1a96d5dd7ece20f0746128f40a80092e86392ff1d
|
|
| MD5 |
aa3c0eed6246ae2455fea4f14e17eddb
|
|
| BLAKE2b-256 |
b7b6776d19a3d0a53a68949098e1b166dd13f7c6484d8d0d2bf0d97274c83ab7
|














