
✨ Welcome to Panel Graphic Walker

A simple way to explore your data through a Tableau-like interface directly in your Panel data applications.
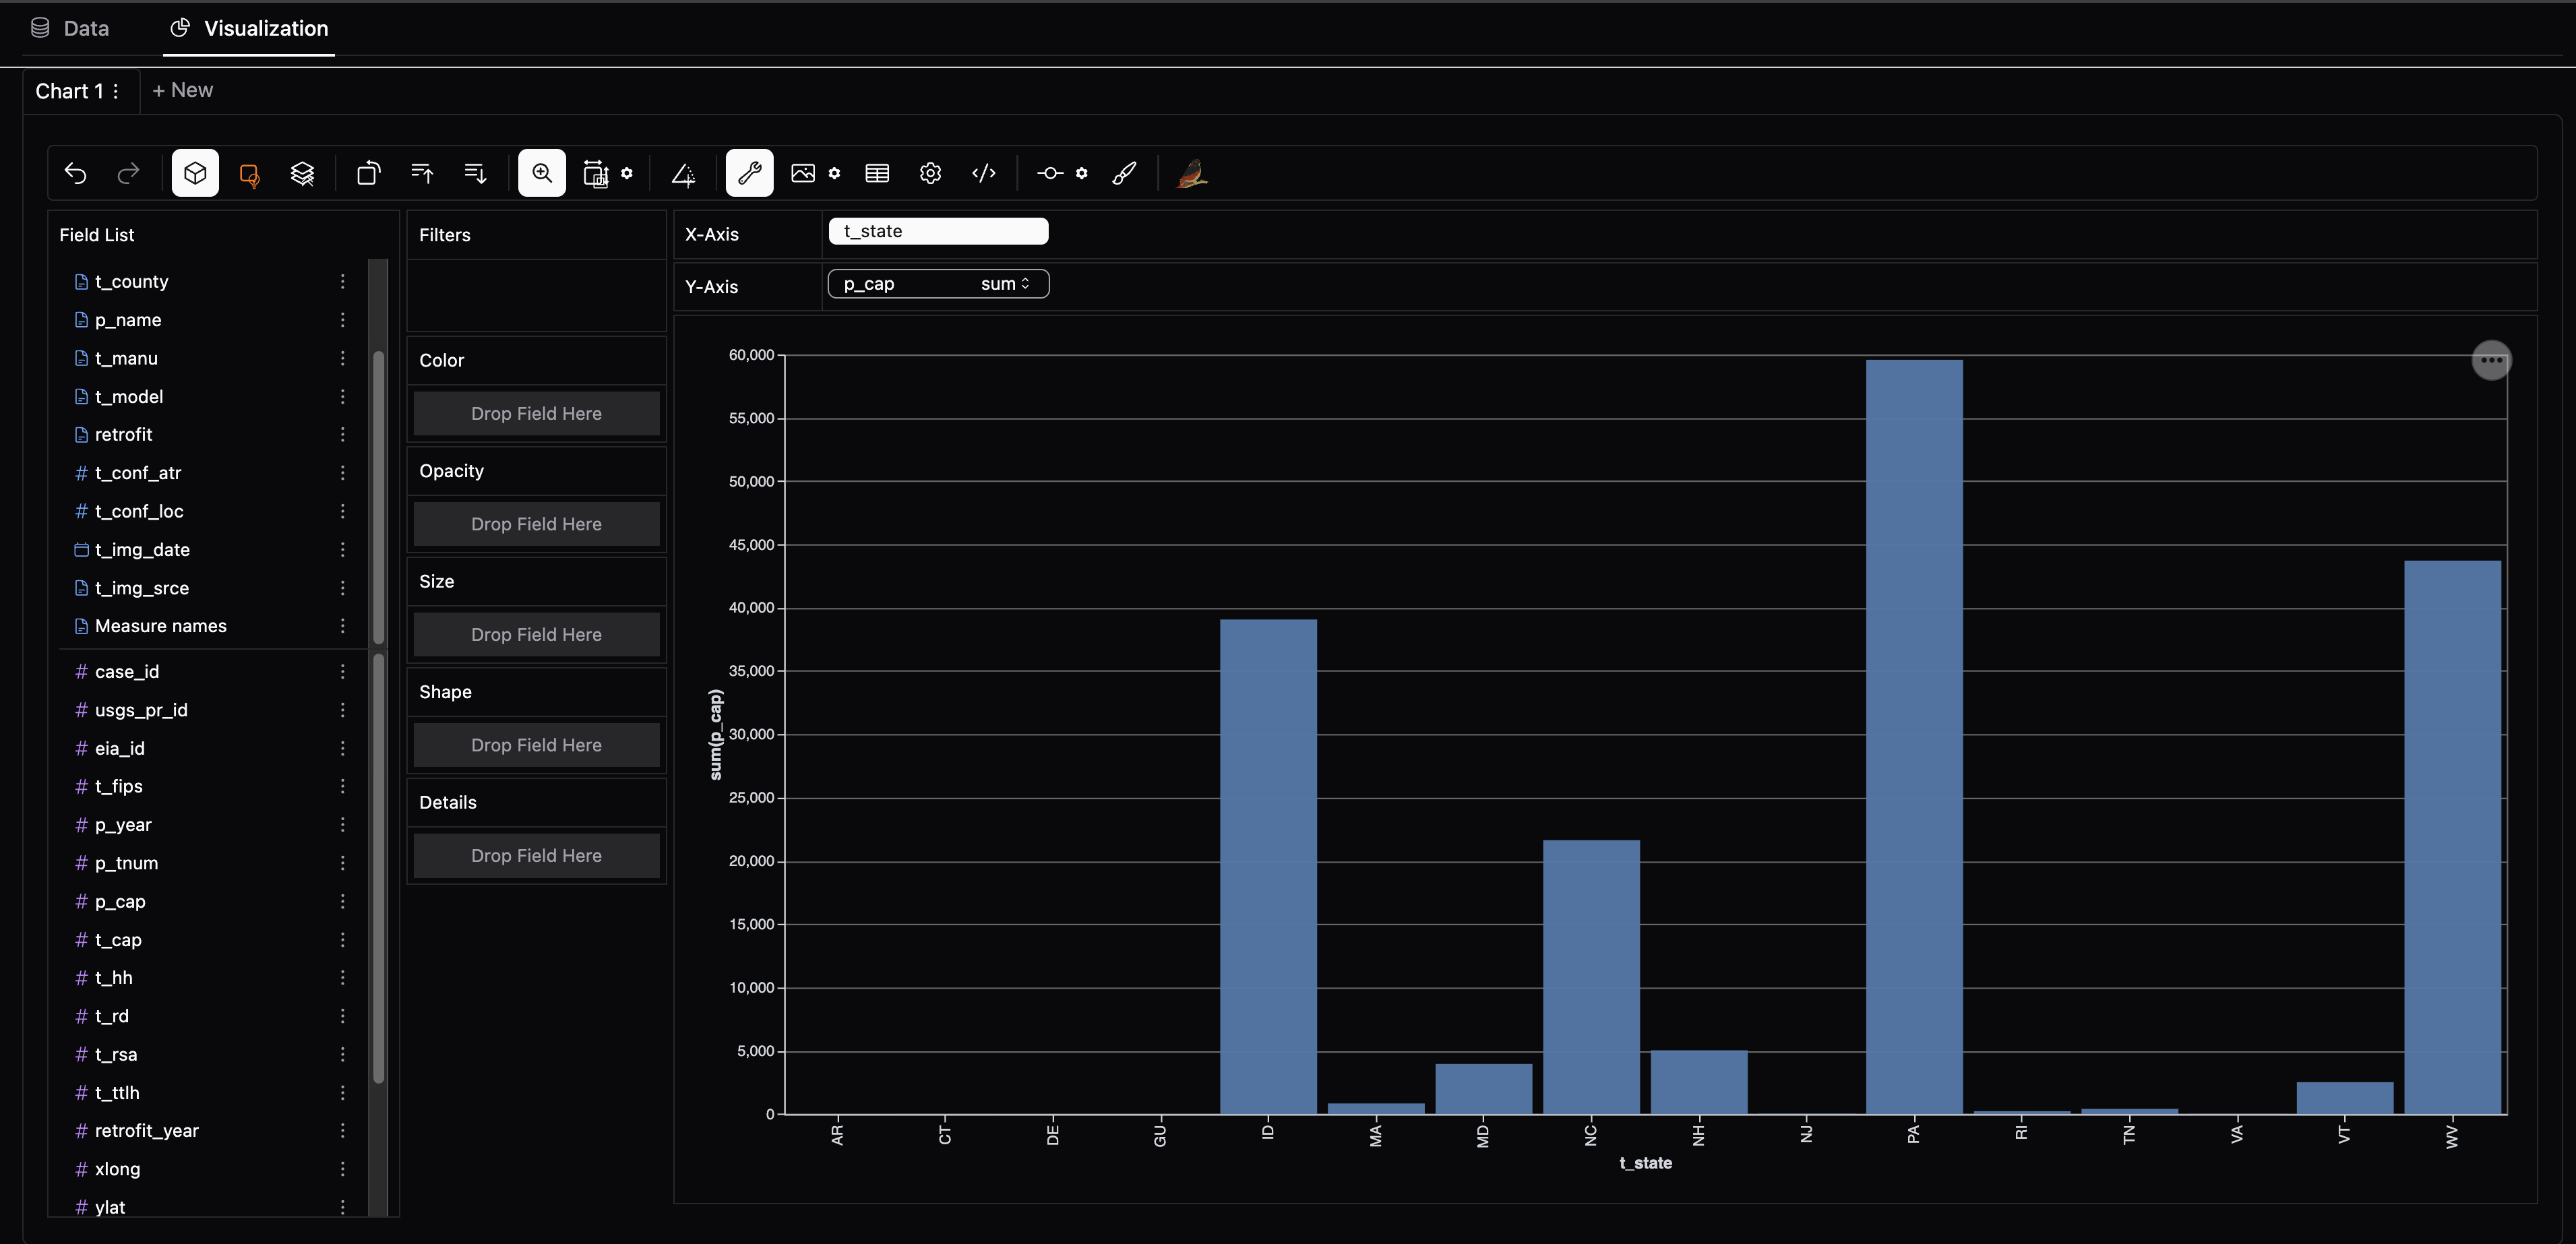
What is Panel Graphic Walker?
panel-graphic-walker brings the power of Graphic Walker to your data science workflow, seamlessly integrating interactive data exploration into notebooks and Panel applications. Effortlessly create dynamic visualizations, analyze datasets, and build dashboards—all within a Pythonic, intuitive interface.
Why choose Panel Graphic Walker?
- Simplicity: Just plug in your data, and
panel-graphic-walkertakes care of the rest. - Quick Data Exploration: Start exploring in seconds, with instant chart and table rendering via a Tableau-like interface.
- Integrates with Python Visualization Ecosystem: Easily integrates with Panel, HoloViz, and the broader Python Visualization ecosystem.
- Scales to your Data: Designed for diverse data backends and scalability, so you can explore even larger datasets seamlessly. (More Features Coming Soon)
Pin your version!
This project is in its early stages, so if you find a version that suits your needs, it’s recommended to pin your version, as updates may introduce changes.
Installation
Install panel-graphic-walker via pip:
pip install panel-graphic-walker
Usage
Basic Graphic Walker Pane


Here’s an example of how to create a simple GraphicWalker pane:
import pandas as pd
import panel as pn

from panel_gwalker import GraphicWalker

pn.extension()

df = pd.read_csv("https://datasets.holoviz.org/windturbines/v1/windturbines.csv.gz", nrows=10000)

GraphicWalker(df).servable()
You can put the code in a file app.py and serve it with panel serve app.py.

Setting the Chart Specification
In the GraphicWalker UI, you can save your chart specification as a JSON file. You can then open the GraphicWalker with the same spec:
GraphicWalker(df, spec="spec.json")

Changing the renderer
You may change the renderer to one of 'explorer' (default), 'profiler', 'viewer' or 'chart':
GraphicWalker(df, renderer='profiler')

Scaling with Server-Side Computation
In some environments, you may encounter message or client-side data limits. To handle larger datasets, you can offload the computation to the server or Jupyter kernel.
First, you will need to install extra dependencies:
pip install panel-graphic-walker[kernel]
Then you can use server-side computation with kernel_computation=True:
walker = GraphicWalker(df, kernel_computation=True)
This setup allows your application to manage larger datasets efficiently by leveraging server resources for data processing.
Please note that if running on Pyodide, computations will always take place on the client.
Explore all the Parameters and Methods
To learn more about all the parameters and methods of GraphicWalker, try the panel-graphic-walker Reference App.

Examples
Bike Sharing Dashboard

Earthquake Dashboard

API
Parameters
Core
object(DataFrame): The data for exploration. Please note that if you update theobject, the existing chart(s) will not be deleted, and you will have to create a new one manually to use the new dataset.field_specs(list): Optional specification of fields (columns).spec(str, dict, list): Optional chart specification as URL, JSON, dict, or list. Can be generated via theexportmethod.kernel_computation(bool): Optional. If True, the computations will take place on the server or in the Jupyter kernel instead of the client to scale to larger datasets. The 'chart' renderer will only work with client side rendering. Default is False.
Renderer
renderer(str): How to display the data. One of 'explorer' (default), 'profiler', 'viewer', or 'chart'. These correspond toGraphicWalker,TableWalker,GraphicRenderer, andPureRenderin thegraphic-walkerReact library.container_height(str): The height of a single chart in theviewerorchartrenderer. For example, '500px' (pixels) or '30vh' (viewport height).hide_profiling(bool): Whether to hide the profiling part of the 'profiler' renderer. Default is False. Does not apply to other renderers.index(int | list): Optional index or indices to display. Default is None (all). Only applicable for theviewerorchartrenderer.page_size(int): The number of rows per page in the table. Only applicable for theprofilerrenderer.tab('data' | 'vis'): Set the active tab to 'data' or 'vis' (default). Only applicable for theexplorerrenderer. Not bi-directionally synced.
Style
appearance(str): Optional dark mode preference: 'light', 'dark', or 'media'. If not provided, the appearance is derived frompn.config.theme.theme_key(str): Optional chart theme: 'g2' (default), 'streamlit', or 'vega'. If using theFastListTemplate, try combining thetheme_key'g2' with theaccentcolor#5B8FF9, or 'streamlit' and#ff4a4a, or 'vega' and#4c78a8.
Other
config(dict): Optional additional configuration for Graphic Walker. For example{"i18nLang": "ja-JP"}. See the Graphic Walker API for more details.
Methods
Clone
clone: Clones theGraphicWalker. Takes additional keyword arguments. Example:walker.clone(renderer='profiler', index=1).chart: Clones theGraphicWalkerand setsrenderer='chart'. Example:walker.chart(0).explorer: Clones theGraphicWalkerand setsrenderer='explorer'. Example:walker.explorer(width=400).profiler: Clones theGraphicWalkerand setsrenderer='profiler'. Example:walker.profiler(width=400).viewer: Clones theGraphicWalkerand setsrenderer='viewer'. Example:walker.viewer(width=400).
Export and Save Methods
export_chart: Returns chart(s) from the frontend exported as either Graphic Walker Chart specification, vega-lite specification or SVG strings.save_chart: Saves chart(s) from the frontend exported as either Graphic Walker Chart specifications, vega-lite specification or SVG strings.export_controls: Returns a UI component to export the charts(s) and interactively setscope,mode, andtimeoutparameters. Thevalueparameter will hold the exported spec.save_controls: Returns a UI component to export and save the chart(s) acting much likeexport_controls.
Other Methods
add_chart: Adds a Chart to the explorer from a Graphic Walker Chart specification.calculated_field_specs: Returns a list of fields calculated from theobject. This is a great starting point if you want to provide customfield_specs.
Vision
Our dream is that this package is super simple to use and supports your use cases:
- Great documentation, including examples.
- Supports your preferred data backend, including Pandas, Polars, and DuckDB.
- Supports persisting and reusing Graphic Walker specifications.
- Scales to even the largest datasets, only limited by your server, cluster, or database.
Supported Backends
| Name | kernel_computation=False |
kernel_computation=True |
Comment |
|---|---|---|---|
| Pandas | ✅ | ✅ | |
| Polars | ✅ | ✅ | |
| DuckDB Relation | ✅ | ✅ | |
| Ibis Table | ✅ | ✅ | Too good to be True. Please report feedback. |
| Dask | ✅ | ❌ | Not supported by Pygwalker |
| Pygwalker Database Connector | ❌ | ❌ | Not supported by Narwhals |
Other backends might be supported if they are supported by both Narwhals and PygWalker.
Via the backends example its possible to explore backends. In the data test fixture you can see which backends we currently test.
❤️ Contributions
Contributions and co-maintainers are very welcome! Please submit issues or pull requests to the GitHub repository. Check out the DEVELOPER_GUIDE for more information.
1 maintainer

Release files for panel-graphic-walker 0.6.5
For a detailed explanation of source distributions (sdists) and built distributions (wheels), please see the package formats documentation.
Source distribution (sdist)
| File | Size | Uploaded | |
|---|---|---|---|
| panel_graphic_walker-0.6.5.tar.gz | 7.5 MB | Details |
Built distribution (wheel)
| File | Interpreter | ABI | Platform | Reset |
|---|---|---|---|---|
| panel_graphic_walker-0.6.5-py3-none-any.whl | Python 3 | none | any | Details |
Total release size: 8.8 MB
Release files / panel_graphic_walker-0.6.5.tar.gz
| Download URL | panel_graphic_walker-0.6.5.tar.gz |
|---|---|
| Size | 7.5 MB |
| Tags | Source |
|
SHA-256 checksum How to use checksums |
ae89a4a22f2db53b0bc48a2c86b95813277e3209b73b39edd306a0c8d2dc9cb7
|
|
BLAKE2b-256 checksum How to use checksums |
4ea1f6997992c2f0fa892c79aeac84f90a3790e8cc16a25fabe3eb60b8e557c1
|
| Upload date | |
|
Uploaded using Trusted Publishing? What is trusted publishing? |
Yes |
| Uploaded via |
twine/6.1.0 CPython/3.13.7
|
Provenance
Provenance describes where a file came from. On PyPI, provenance is shared via attestations, which provide a verifiable record of the build or publishing details. View details, limitations and caveats.


PyPI Publish Attestation
PyPI verified that this artifact, at this checksum, originated from the publisher listed below.
Signed by GitHub Actions, verified by PyPI on Dec 3, 2025.
Transparency logRelease files / panel_graphic_walker-0.6.5-py3-none-any.whl
| Download URL | panel_graphic_walker-0.6.5-py3-none-any.whl |
|---|---|
| Size | 1.2 MB |
| Tags | Python 3 |
|
SHA-256 checksum How to use checksums |
08677603a161de5bf9493d38e4b787f3c8595292a62938b33b44c69c9e589b5a
|
|
BLAKE2b-256 checksum How to use checksums |
f12abebe3972396d388b54c347881d0a1ff8ab718273a84511b7a5b3bb1e3627
|
| Upload date | |
|
Uploaded using Trusted Publishing? What is trusted publishing? |
Yes |
| Uploaded via |
twine/6.1.0 CPython/3.13.7
|
Provenance
Provenance describes where a file came from. On PyPI, provenance is shared via attestations, which provide a verifiable record of the build or publishing details. View details, limitations and caveats.
PyPI Publish Attestation
PyPI verified that this artifact, at this checksum, originated from the publisher listed below.
Signed by GitHub Actions, verified by PyPI on Dec 3, 2025.
Transparency log













