Claude Code usage tracking tool with real-time monitoring and analysis
Verified details
These details have been verified by PyPIProject links
GitHub Statistics
Maintainers

Project description
PAR CC Usage
Claude Code usage tracking tool with real-time monitoring and analysis.


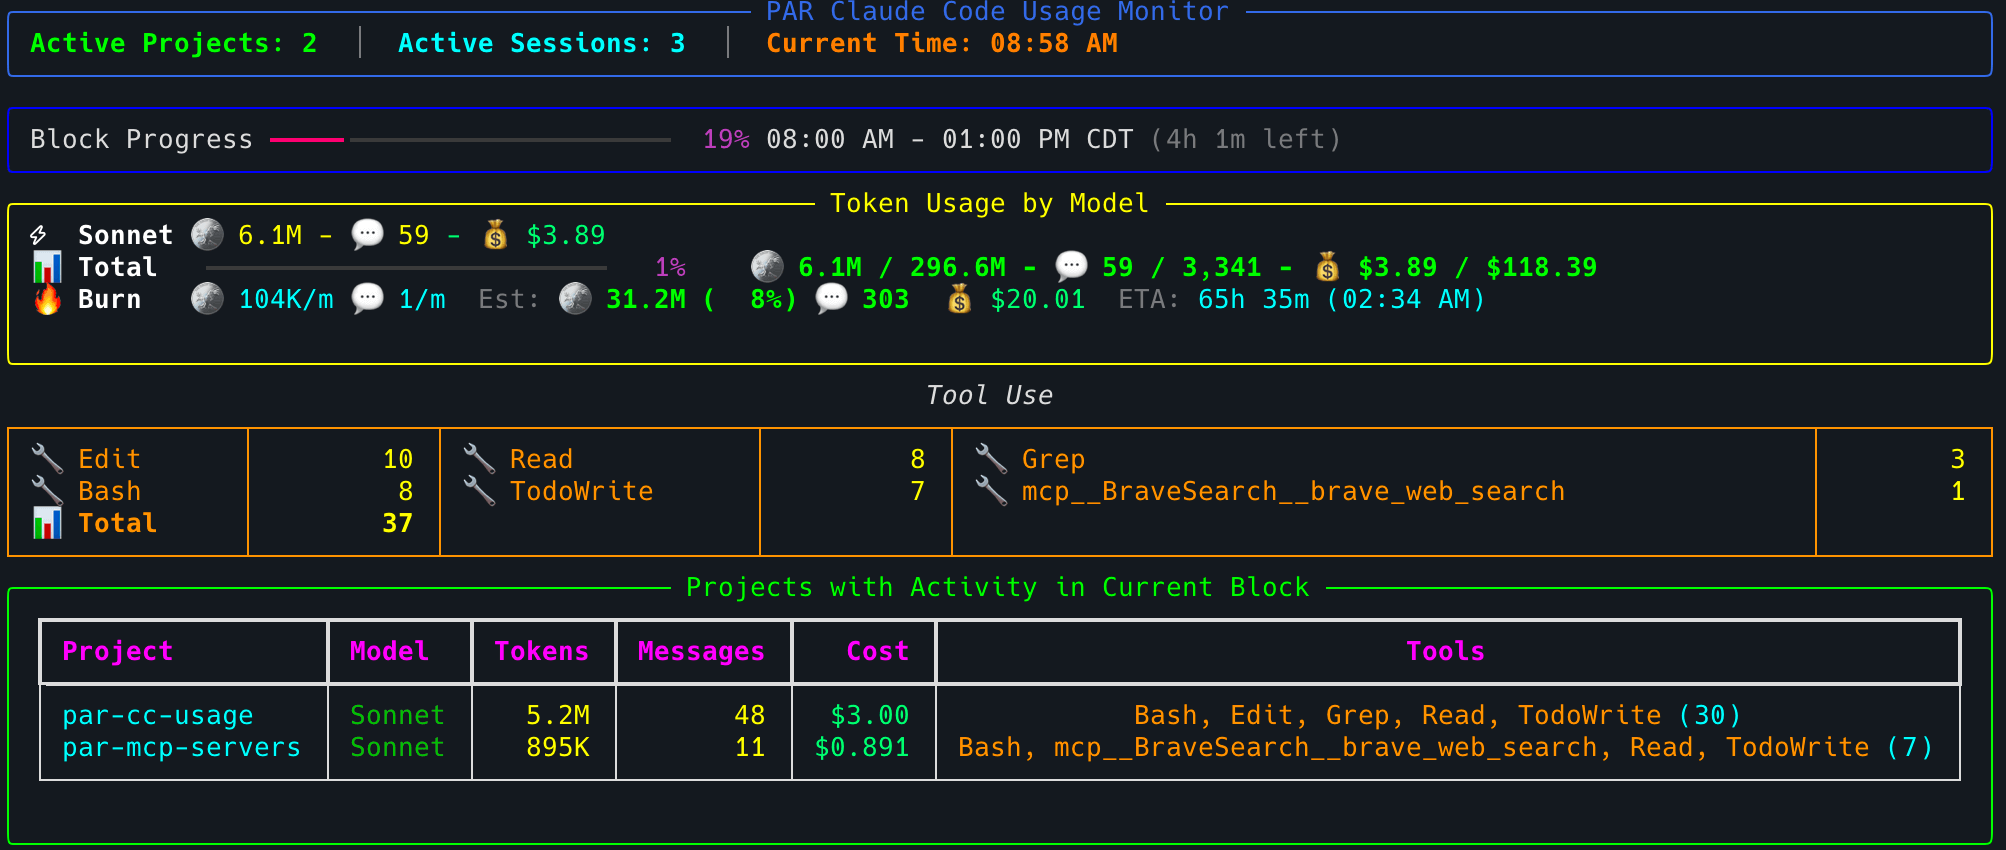
Table of Contents
- Features
- 📊 Real-Time Monitoring
- 🔥 Advanced Burn Rate Analytics
- ⚙️ Intelligent Block Management
- 📏 P90 Progress Bar Limits
- 🎯 Smart Features
- 💰 Cost Tracking & Pricing
- 📁 File System Support
- 🌐 Configuration & Customization
- 🎨 Theme System
- 🔔 Notification System
- 📈 Usage Summary Analytics
- 💻 Claude Code Status Line
- 🛠️ Developer Tools
- Installation
- Claude Code Status Line Integration
- Usage
- Configuration
- Display Features
- Unified Block System
- Current Billing Block Identification
- Manual Override
- Compact Interface
- Optional Session Details
- Project Aggregation Mode
- Smart Token Limit Management
- Model Display Names and Token Multipliers
- Time Format Options
- Project Name Customization
- Cost Tracking & Pricing
- Webhook Notifications
- File Locations
- Coming Soon
- What's New
- Development
Features
📊 Real-Time Monitoring
- Live token tracking: Monitor usage across all Claude Code projects in real-time
- 5-hour billing blocks: Unified block system that accurately reflects Claude's billing structure
- Multi-session support: When multiple sessions are active, they share billing blocks intelligently
- Visual progress indicators: Real-time progress bars for current billing period
- Stable console interface: Clean, jump-free display with automatic suppression of disruptive output
🔥 Advanced Burn Rate Analytics
- Per-minute tracking: Granular burn rate display (tokens/minute) for precise monitoring
- Estimated completion: Projects total usage for full 5-hour block based on current rate
- ETA with clock time: Shows both duration and actual time when limit will be reached
- Smart color coding: Visual indicators based on usage levels (green/orange/red)
⚙️ Intelligent Block Management
- Smart strategy: Intelligent algorithm that automatically selects optimal billing blocks
- Manual override: CLI option to set custom block start times for testing or corrections
- Automatic detection: Smart detection of session boundaries and billing periods
- Gap handling: Proper handling of inactivity periods longer than 5 hours
📏 P90 Progress Bar Limits
- Stable progress bars: Uses 90th percentile (P90) values instead of absolute maximums for more realistic progress indicators
- Outlier filtering: Automatically ignores extreme usage spikes that can skew progress displays
- Realistic projections: Shows typical usage patterns while capturing 90% of historical data
- Visual P90 indicator: Clear "(P90)" labels when P90 mode is active
- Configurable: Toggle between P90 and absolute maximum via
--no-p90flag or config setting
🎯 Smart Features
- Auto-adjusting limits: Automatically increases token limits when exceeded and saves to config
- Deduplication: Prevents double-counting using message and request IDs
- Model name simplification: Clean display names (Opus, Sonnet) for better readability
- Session sorting: Newest-first ordering for active sessions
- Per-model token tracking: Accurate token attribution with proper multipliers (Opus 5x, others 1x)
- Compact display mode: Minimal interface option for reduced screen space usage
💰 Cost Tracking & Pricing
- Real-time cost calculations: Live cost tracking using LiteLLM pricing data
- Per-model cost breakdown: Accurate cost attribution for each Claude model
- Monitor pricing integration: Optional cost columns in project and session views with
--show-pricing - List command pricing: Full cost analysis support in table, JSON, and CSV outputs with
--show-pricingand intelligent cost hierarchy - Burn rate cost estimation: Real-time 5-hour block cost projection based on current spending rate
- Configurable pricing display: Enable/disable cost tracking via configuration or command-line
- Export with costs: JSON and CSV exports include cost data and cost source transparency when pricing is enabled
- Integrated pricing cache: Efficient pricing lookups with built-in caching
- Intelligent fallbacks: When exact model names aren't found, uses pattern matching to find closest pricing
- Unknown model handling: Models marked as "Unknown" automatically display $0.00 cost
- Robust error handling: Missing pricing data doesn't break functionality or display
📁 File System Support
- Multi-directory monitoring: Supports both legacy (
~/.claude/projects) and new paths - Efficient caching: File position tracking to avoid re-processing entire files
- Cache management: Optional cache disabling for full file reprocessing
- JSONL analysis: Deep analysis of Claude Code data structures
- XDG Base Directory compliance: Uses standard Unix/Linux directory conventions
- Legacy migration: Automatically migrates existing config files to XDG locations
- Read-only mode: Optional config protection to prevent automatic limit updates
🌐 Configuration & Customization
- XDG directory compliance: Config, cache, and data files stored in standard locations
- Automatic migration: Legacy config files automatically moved to XDG locations
- Automatic timezone detection: Seamlessly detects system timezone changes, with manual override support
- Dynamic baseline updates:
update-maximumscommand automatically updates configuration limits based on actual usage patterns - Read-only protection: Automatic read-only mode activation to prevent accidental configuration changes
- Time formats: 12-hour or 24-hour time display options
- Project name cleanup: Strip common path prefixes for cleaner display
- Flexible output: Table, JSON, and CSV export formats
🎨 Theme System
- Multiple built-in themes: Choose from 6 carefully crafted themes for different preferences
- Light and dark themes: Options for both dark terminal and light terminal users
- Terminal-native ANSI theme: Respects your terminal's color palette (great for Catppuccin, Dracula, etc.)
- Accessibility support: High contrast theme meeting WCAG AAA standards
- Session-based overrides: Temporarily change themes for individual command runs
- Rich color integration: Semantic color system with consistent visual language
- CLI theme management: Built-in commands for theme configuration and preview
🔔 Notification System
- Discord integration: Webhook notifications for billing block completion
- Smart filtering: Only notifies for blocks with actual activity
- Cooldown protection: Configurable minimum time between notifications
- Rich information: Detailed usage statistics in notifications
📈 Usage Summary Analytics
- Time-based analysis: Generate summaries by daily, weekly, monthly, or all-time periods
- Statistical insights: Totals, averages, and P90 values for tokens, messages, and costs
- Usage patterns: Identify peak usage periods and typical session sizes
- Model breakdown: Analyze which Claude models are used most frequently
- Tool usage tracking: See which tools (Read, Edit, Bash, etc.) are used most often
- Export capabilities: JSON and CSV export for external analysis and reporting
- Flexible period filtering: Limit analysis to recent periods (last N days/weeks/months)
💻 Claude Code Status Line
- Real-time status bar: Display token usage directly in Claude Code's interface
- Auto-installation: Simple one-command setup with
pccu install-statusline - Session tracking: Show per-session or grand total usage statistics
- Live updates: Automatically refreshes when monitoring is active
🛠️ Developer Tools
- Debug commands: Comprehensive debugging tools for block calculation and timing
- Activity analysis: Historical activity pattern analysis
- JSONL analyzer: Built-in
jsonl_analyzer.pytool for examining Claude Code data files - Webhook testing: Built-in Discord and Slack webhook testing
Installation
Option 1: Install from PyPI (Recommended)
Using uv (fastest):
uvx --from par-cc-usage pccu monitor
# or installing into the $PATH
uv tool install par-cc-usage
Using pip:
pip install par-cc-usage
After installation, you can run the tool directly:
pccu monitor
Option 2: Development Installation
Clone the repository and install in development mode:
# Clone the repository
git clone https://github.com/paulrobello/par_cc_usage.git
cd par_cc_usage

# Install with uv (recommended)
uv sync

# Or install with pip
pip install -e .
Run the tool in development mode:
# Using uv
uv run pccu monitor

# Or using make (if available)
make run

# Or directly with Python
python -m par_cc_usage.main monitor
Prerequisites
- Python 3.11 or higher
- Claude Code must be installed and have generated usage data
- uv (recommended) or pip for installation
Claude Code Status Line Integration
PAR CC Usage can display real-time token usage directly in Claude Code's status bar at the bottom of the interface.

Quick Setup
Install the status line with a single command:
pccu install-statusline
This will automatically configure Claude Code to display your token usage. Restart Claude Code to see the changes.
Manual Setup
If you prefer to configure manually, add this to your ~/.claude/settings.json:
"statusLine": {
  "type": "command",
  "command": "pccu statusline"
}
Status Line Display
The status line shows (v0.9.0+):
- Project name in square brackets for context
- 🪙 Token count with limit and percentage
- 💬 Message count with limit
- 💰 Cost tracking with limit (calculated from token usage)
- ⏱️ Time remaining in current 5-hour billing block
Example: [parllama] - 🪙 495.7M/510.7M (97%) - 💬 736/1,734 - 💰 $155.27/$166.80 - ⏱️ 2h 8m
Status Line Behavior:
- By default, shows per-session usage (tracks your current Claude Code session)
- Can be configured to always show grand total across all sessions
- Both modes include real-time cost calculations based on token usage
- Displays remaining time in the current billing block (e.g., "2h 8m" or "45m")
- Updates automatically as you interact with Claude Code
Important: The status line is updated when pccu monitor is running. For real-time updates, keep the monitor running in a terminal.
Commands
# Install status line into Claude Code
pccu install-statusline

# Install with force (skip confirmation prompts)
pccu install-statusline --force

# Remove status line from Claude Code
pccu uninstall-statusline

# Remove with force (skip confirmation prompts)
pccu uninstall-statusline --force

# Configure status line template
pccu configure-statusline
Configuration
Control status line behavior in your config.yaml:
# Enable/disable status line generation (default: true)
statusline_enabled: true

# Always show grand total instead of per-session (default: false)
statusline_use_grand_total: false

# Progress bar customization (v0.10.0+)
statusline_progress_bar_colorize: true  # Colorize progress bars based on usage (green/yellow/red)
statusline_progress_bar_style: rich     # Style: 'basic' (blocks █░) or 'rich' (lines ━╺)
statusline_progress_bar_length: 15      # Length of progress bar (default: 15)
statusline_progress_bar_show_percent: true  # Show percentage in center of bar

# Custom status line template (advanced)
statusline_template: '{project}{sep}{tokens}{sep}{messages}{sep}{cost}{sep}{remaining_block_time}{sep} SES:{session_tokens}/{session_tokens_total}{sep}{session_tokens_progress_bar}'
Progress Bar Features (v0.10.0+)
- Colorization: Progress bars change color based on usage (green < 50%, yellow 50-79%, red ≥ 80%)
- Rich Style: Cleaner line-based progress bars (━╺) instead of blocks (█░)
- Percentage Display: Optional percentage shown in center of progress bar
- Session Token Tracking: Display session-specific token usage with progress bars
- Model Display: Show current Claude model name (Opus, Sonnet) with
{model}template variable - Performance Optimized: Conditional data fetching - only retrieves git status, session tokens, etc. when needed in template
The status line automatically updates whenever you run pccu monitor, providing real-time usage feedback directly in your Claude Code interface.
Usage
Monitor Token Usage
Monitor token usage in real-time with comprehensive options:
# Basic monitoring (default 5-second interval)
pccu monitor

# Compact mode for minimal display
pccu monitor --compact

# Basic monitoring (sessions shown by default)
pccu monitor

# High-frequency monitoring with custom settings
pccu monitor --interval 2 --token-limit 1000000 --show-sessions

# Monitor with custom configuration
pccu monitor --config production-config.yaml

# P90 vs Absolute Maximum options
pccu monitor  # Default: P90 limits for stable progress bars
pccu monitor --no-p90  # Use absolute maximum values instead

# Testing and debugging scenarios
pccu monitor --no-cache --block-start 18  # Fresh scan + custom block timing
pccu monitor --block-start 14 --show-sessions  # Override block start time
pccu monitor --debug  # Enable debug output to see processing messages

# Production monitoring examples
pccu monitor --interval 10 --token-limit 500000  # Conservative monitoring
pccu monitor --show-sessions --config team-config.yaml  # Team dashboard
pccu monitor --compact --interval 3  # Minimal display with frequent updates

# Cost tracking and pricing
pccu monitor --show-pricing  # Enable cost calculations and display
pccu monitor --show-sessions --show-pricing  # Session view with cost breakdown
pccu monitor --show-pricing --config pricing-config.yaml  # Cost monitoring with config

# Theme customization
pccu monitor --theme light  # Use light theme for this session
pccu monitor --theme dark --show-sessions  # Dark theme with session details
pccu monitor --theme ansi --show-sessions  # ANSI theme (respects terminal palette like Catppuccin)
pccu monitor --theme accessibility --show-pricing  # High contrast theme with pricing
pccu monitor --theme minimal --compact  # Minimal theme with compact display

# Model multiplier overrides
pccu monitor --model-multipliers opus=5.0,sonnet=1.0,default=1.0  # Override model multipliers
pccu monitor --model-multipliers opus=10.0,default=2.0  # Custom Opus multiplier with default fallback
Monitor Display Features
- Real-time updates: Live token consumption tracking
- Burn rate analytics: Tokens/minute with ETA to limit (e.g., "1.2K/m ETA: 2.3h (10:45 PM)")
- Cost tracking: Real-time cost calculations using LiteLLM pricing (when
--show-pricingis enabled) - Burn rate cost estimation: Intelligent cost projection for 5-hour blocks based on current spending rate (e.g., "531K/m Est: 159.3M (90%) Est: $65.51 ETA: 2h 28m")
- Block progress: Visual 5-hour billing block progress with time remaining
- Model breakdown: Per-model token usage (Opus, Sonnet) with optional cost breakdown
- Session details: Individual session tracking (shown by default)
- Activity tables: Project or session aggregation views with optional cost columns
List Usage Data
Generate usage reports:
# List all usage data (table format)
pccu list

# Output as JSON
pccu list --format json

# Output as CSV
pccu list --format csv

# Sort by different fields
pccu list --sort-by tokens
pccu list --sort-by session
pccu list --sort-by project
pccu list --sort-by time
pccu list --sort-by model

# Include cost information in output (table format)
pccu list --show-pricing

# Export usage data with costs as JSON
pccu list --show-pricing --format json

# Export usage data with costs as CSV
pccu list --show-pricing --format csv --output usage-with-costs.csv

# Combine sorting and pricing
pccu list --sort-by tokens --show-pricing --format table

# Save detailed report with costs to file
pccu list --show-pricing --output usage-report.json --format json

# Theme customization for list output
pccu list --theme light --show-pricing  # Light theme with pricing
pccu list --theme accessibility --format table  # High contrast theme
pccu list --theme minimal --sort-by tokens  # Minimal theme with token sorting
Usage Summary Analytics
Generate comprehensive usage summaries with statistical analysis:
# Monthly summary (default) with totals, averages, and P90 statistics
pccu usage-summary

# Weekly breakdown for the last 8 weeks
pccu usage-summary --time-bucket weekly --period-limit 8

# Daily analysis for the last 30 days
pccu usage-summary --time-bucket daily --period-limit 30

# All-time summary across entire usage history
pccu usage-summary --time-bucket all

# Export comprehensive monthly analysis to CSV
pccu usage-summary --format csv --output monthly-summary.csv

# Detailed summary with model and tool breakdowns
pccu usage-summary --show-models --show-tools

# Summary with all statistics (including P90) and model breakdown
pccu usage-summary --show-p90 --show-models --show-pricing

# Minimal summary without P90 statistics
pccu usage-summary --no-p90

# JSON export for data analysis
pccu usage-summary --format json --output usage-analysis.json

# Theme customization for summary output
pccu usage-summary --theme dark --show-models
What the Summary Shows:
- Totals: Total tokens, messages, and costs per time period
- Averages: Average usage per session within each period
- P90 Statistics: 90th percentile values showing typical high usage (filters outliers)
- Activity Metrics: Number of active projects and sessions per period
- Model Breakdown: Usage distribution across different Claude models (with
--show-models) - Tool Usage: Analysis of which tools are used most frequently (with
--show-tools) - Time Periods: Flexible bucketing by day, week (ISO weeks), month, or all-time
Understanding P90 vs Average: P90 values are typically higher than averages because they represent the 90th percentile - meaning 90% of your sessions used less than this amount, while 10% used more. This helps identify your typical "high usage" sessions while filtering out extreme outliers. The gap between average and P90 indicates usage variability.
Configuration Management
# Initialize configuration file
pccu init

# Set different types of limits
pccu set-limit token 500000      # Set token limit
pccu set-limit message 100       # Set message limit
pccu set-limit cost 25.50        # Set cost limit in USD

# Update maximums based on current usage and enable read-only mode
pccu update-maximums

# Preview configuration changes without applying them
pccu update-maximums --dry-run

# Force update even if config is read-only
pccu update-maximums --force

# Use only current active block totals instead of historical maximums
pccu update-maximums --use-current-block

# Use custom config file
pccu init --config my-config.yaml
pccu update-maximums --config my-config.yaml
Cache Management
# Clear file monitoring cache
pccu clear-cache

# Clear cache with custom config
pccu clear-cache --config my-config.yaml
Theme Management
# List all available themes
pccu theme list

# Set default theme (saves to config)
pccu theme set light

# Set theme with custom config file
pccu theme set dark --config my-config.yaml

# Check current theme
pccu theme current

# Use temporary theme overrides (doesn't save to config)
pccu monitor --theme light  # Light theme for this session only
pccu list --theme accessibility  # High contrast theme for this command
pccu list-sessions --theme minimal  # Minimal theme for session list
Webhook Notifications
# Test webhook configuration (Discord and/or Slack)
pccu test-webhook

# Test with custom config file
pccu test-webhook --config my-config.yaml
JSONL Analysis
The jsonl_analyzer.py tool helps analyze Claude Code's JSONL data files, which can be quite large with complex nested structures. This tool is essential for understanding the data format when debugging token counting issues or exploring Claude's usage patterns.
This tool is integrated into the main pccu CLI but can also be run standalone:
# Via the main CLI (recommended)
pccu analyze ~/.claude/projects/-Users-username-project/session-id.jsonl

# Or run standalone
uv run python -m par_cc_usage.jsonl_analyzer ~/.claude/projects/-Users-username-project/session-id.jsonl

# Analyze first N lines (useful for large files)
pccu analyze path/to/file.jsonl --max-lines 10

# Customize string truncation length for better readability
pccu analyze path/to/file.jsonl --max-length 50

# Output as JSON for programmatic processing
pccu analyze path/to/file.jsonl --json

# Example: Analyze current project's most recent session
pccu analyze ~/.claude/projects/-Users-probello-Repos-par-cc-usage/*.jsonl --max-lines 20
JSONL Analyzer Features:
- Field discovery: Automatically identifies all fields present in the JSONL data
- Type information: Shows data types for each field (string, number, object, array)
- Smart truncation: Long strings and arrays are truncated for readability
- Streaming processing: Handles large files efficiently without loading everything into memory
- Usage analysis: Helps identify token usage patterns and message structures
Debug Commands
Comprehensive troubleshooting tools for billing block calculations and session timing:
# Block Analysis
pccu debug-blocks                    # Show all active billing blocks
pccu debug-blocks --show-inactive    # Include completed/inactive blocks

# Unified Block Calculation
pccu debug-unified                   # Step-by-step unified block selection trace
pccu debug-unified -e 18             # Validate against expected hour (24-hour format)
pccu debug-unified --expected-hour 14 # Alternative syntax for validation

# Activity Pattern Analysis
pccu debug-activity                  # Recent activity patterns (last 6 hours)
pccu debug-activity --hours 12      # Extended activity analysis (12 hours)
pccu debug-activity -e 18 --hours 8 # Validate expected start time with custom window

# Session Analysis
pccu debug-sessions                  # Debug session activity and filtering logic
pccu debug-session-table             # Analyze why session table might be empty
pccu filter-sessions                 # Filter and display sessions by various criteria

# Advanced Debugging Scenarios
pccu debug-blocks --show-inactive | grep "2025-07-08"  # Filter by specific date
pccu debug-unified --config debug.yaml -e 13           # Use debug configuration with validation
Debug Output Features
- Block timing verification: Confirms correct 5-hour block boundaries
- Strategy explanation: Shows why specific blocks were selected
- Token calculation validation: Verifies deduplication and aggregation
- Activity timeline: Chronological view of session activity
- Configuration validation: Confirms settings are applied correctly
- Expected time validation: Validates unified block calculations against expected results (24-hour format)
Configuration
The tool supports configuration via YAML files and environment variables. Configuration files are stored in XDG Base Directory compliant locations:
Directory Structure
- Config:
~/.config/par_cc_usage/config.yaml(respectsXDG_CONFIG_HOME) - Cache:
~/.cache/par_cc_usage/(respectsXDG_CACHE_HOME) - Data:
~/.local/share/par_cc_usage/(respectsXDG_DATA_HOME)
Legacy Migration
If you have an existing ./config.yaml file in your working directory, it will be automatically migrated to the XDG config location (~/.config/par_cc_usage/config.yaml) when you first run the tool.
Migration behavior:
- Checks for legacy config files in current directory and home directory
- Automatically copies to XDG location if XDG config doesn't exist
- Preserves all existing settings during migration
- No manual intervention required
Config File Example
The configuration file is located at ~/.config/par_cc_usage/config.yaml:
projects_dir: ~/.claude/projects
polling_interval: 5
timezone: auto  # Automatically detects system timezone, or use IANA timezone name
auto_detected_timezone: America/New_York  # Automatically populated when timezone=auto
token_limit: 500000
cache_dir: ~/.cache/par_cc_usage  # XDG cache directory (automatically set)
disable_cache: false  # Set to true to disable file monitoring cache
recent_activity_window_hours: 5  # Hours to consider as 'recent' activity for smart strategy (matches billing cycle)
config_ro: false  # Read-only mode: prevents automatic updates to config file (max values, limits)
model_multipliers:  # Token multipliers per model type (default fallback for unlisted models)
  opus: 5.0  # Opus models use 5x multiplier to reflect higher cost
  sonnet: 1.0  # Sonnet models use 1x multiplier (baseline cost)
  default: 1.0  # Fallback multiplier for unlisted models
display:
  show_progress_bars: true
  show_active_sessions: true  # Default: show session details
  update_in_place: true
  refresh_interval: 1
  time_format: 24h  # Time format: '12h' for 12-hour, '24h' for 24-hour
  display_mode: normal  # Display mode: 'normal' or 'compact'
  show_tool_usage: true  # Display tool usage information in monitoring and lists (default: true)
  show_pricing: true  # Enable cost calculations and display (default: true)
  use_p90_limit: true  # Use P90 values instead of absolute maximum for progress bar limits (default: true)
  theme: default  # Theme: 'default', 'dark', 'light', 'accessibility', or 'minimal'
  project_name_prefixes:  # Strip prefixes from project names for cleaner display
    - "-Users-"
    - "-home-"
  aggregate_by_project: true  # Aggregate token usage by project instead of individual sessions (default)
statusline_enabled: true  # Enable Claude Code status line generation (default: true)
statusline_use_grand_total: false  # Always show grand total instead of per-session (default: false)
notifications:
  discord_webhook_url: https://discord.com/api/webhooks/your-webhook-url
  slack_webhook_url: https://hooks.slack.com/services/your-webhook-url
  notify_on_block_completion: true  # Send notification when 5-hour block completes
  cooldown_minutes: 5  # Minimum minutes between notifications
Environment Variables
PAR_CC_USAGE_PROJECTS_DIR: Override projects directoryPAR_CC_USAGE_POLLING_INTERVAL: Set polling intervalPAR_CC_USAGE_TIMEZONE: Set timezone ('auto' for system detection or IANA timezone name)PAR_CC_USAGE_TOKEN_LIMIT: Set token limitPAR_CC_USAGE_CACHE_DIR: Override cache directory (defaults to XDG cache directory)PAR_CC_USAGE_DISABLE_CACHE: Disable file monitoring cache ('true', '1', 'yes', 'on' for true)PAR_CC_USAGE_RECENT_ACTIVITY_WINDOW_HOURS: Hours to consider as 'recent' activity for smart strategy (default: 5)PAR_CC_USAGE_CONFIG_RO: Read-only mode - prevents automatic updates to config file ('true', '1', 'yes', 'on' for true)PAR_CC_USAGE_MODEL_MULTIPLIERS: Override model multipliers (format: opus=5.0,sonnet=1.0,default=1.0)PAR_CC_USAGE_SHOW_PROGRESS_BARS: Show progress barsPAR_CC_USAGE_SHOW_ACTIVE_SESSIONS: Show active sessions (default: true)PAR_CC_USAGE_USE_P90_LIMIT: Use P90 values instead of absolute maximum for progress bars ('true', '1', 'yes', 'on' for true, default: true)PAR_CC_USAGE_UPDATE_IN_PLACE: Update display in placePAR_CC_USAGE_REFRESH_INTERVAL: Display refresh intervalPAR_CC_USAGE_TIME_FORMAT: Time format ('12h' or '24h')PAR_CC_USAGE_THEME: Theme name ('default', 'dark', 'light', 'accessibility', or 'minimal')PAR_CC_USAGE_PROJECT_NAME_PREFIXES: Comma-separated list of prefixes to strip from project namesPAR_CC_USAGE_AGGREGATE_BY_PROJECT: Aggregate token usage by project instead of sessions ('true', '1', 'yes', 'on' for true)PAR_CC_USAGE_STATUSLINE_ENABLED: Enable/disable Claude Code status line generation ('true', '1', 'yes', 'on' for true, default: true)PAR_CC_USAGE_STATUSLINE_USE_GRAND_TOTAL: Always show grand total instead of per-session ('true', '1', 'yes', 'on' for true, default: false)PAR_CC_USAGE_DISCORD_WEBHOOK_URL: Discord webhook URL for notificationsPAR_CC_USAGE_SLACK_WEBHOOK_URL: Slack webhook URL for notificationsPAR_CC_USAGE_NOTIFY_ON_BLOCK_COMPLETION: Send block completion notifications ('true', '1', 'yes', 'on' for true)PAR_CC_USAGE_COOLDOWN_MINUTES: Minimum minutes between notifications
Display Features
Unified Block System
When multiple Claude Code sessions are active simultaneously, they all share a single 5-hour billing block. The system intelligently determines which block timing to display based on your work patterns.
Important: Token counts and session displays are filtered to show only sessions with activity that overlaps with the unified block time window. This ensures the displayed totals accurately reflect what will be billed for the current 5-hour period. Sessions are included if they have any activity within the billing window, regardless of when they started.
Current Billing Block Identification
The system uses a simple approach to identify the current billing block:
Algorithm:
- Identifies active blocks across all projects and sessions
- Returns the most recent active block chronologically
Block Activity Criteria: A block is considered "active" if both conditions are met:
- Recent activity: Time since last activity < 5 hours
- Within block window: Current time < block's theoretical end time (start + 5 hours)
Key Benefits:
- Simple and reliable: No complex filtering or edge case logic
- Simple logic: Uses straightforward rules to identify the current billing block
- Predictable behavior: Always selects the most recent block that has recent activity
Example Scenario:
- Session A: Started at 2:00 PM, last activity at 3:18 PM ✓ (active - within 5 hours)
- Session B: Started at 3:00 PM, last activity at 5:12 PM ✓ (active - within 5 hours)
- Result: Current billing block starts at 3:00 PM (most recent active block)
Manual Override
For testing or debugging, you can override the unified block start time:
# Override unified block to start at 2:00 PM (14:00 in 24-hour format)
pccu monitor --block-start 14

# Override with timezone consideration (hour is interpreted in your configured timezone)
pccu monitor --block-start 18 --show-sessions
Important: The --block-start hour (0-23) is interpreted in your configured timezone and automatically converted to UTC for internal processing.
Compact Interface
The monitor now supports compact mode for minimal, focused display:
Normal Mode (Default): Full display with all information:
- Header: Active projects and sessions count
- Block Progress: 5-hour block progress with time remaining
- Token Usage: Per-model token counts with burn rate metrics and progress bars
- Tool Usage: Optional tool usage statistics (if enabled)
- Sessions: Optional session/project details (if enabled)
Compact Mode: Minimal display with essential information only:
- Header: Active projects and sessions count
- Token Usage: Per-model token counts with burn rate metrics (no progress bars or interruption stats)
- Burn Rate: Displays tokens consumed per minute (e.g., "1.2K/m")
- Estimated Total: Projects total usage for the full 5-hour block based on current burn rate
- ETA: Shows estimated time until token limit is reached with actual clock time (e.g., "2.3h (10:45 PM)" or "45m (08:30 AM)")
- Total Usage: Simple text display instead of progress bar
- Hidden Elements: No block progress bar, tool usage information, or session details (even with
--show-sessions)
Using Compact Mode:
# Start directly in compact mode
pccu monitor --compact

# Compact mode with other options (sessions still hidden in compact mode)
pccu monitor --compact --show-sessions --interval 2

# Use config file for persistent compact mode
pccu monitor  # Uses config setting: display.display_mode: compact

# Environment variable approach
PAR_CC_USAGE_DISPLAY_MODE=compact pccu monitor
Configuration Options:
- CLI: Use
--compactflag to start in compact mode - Config: Set
display.display_mode: compactin config file - Environment: Set
PAR_CC_USAGE_DISPLAY_MODE=compact
Session Details (Default)
Sessions are shown by default. Set show_active_sessions: false in config to hide. Shows:
- Individual session information
- Project and session IDs
- Model types (Opus, Sonnet)
- Token usage per session
- Sessions sorted by newest activity first
Session Filtering: The sessions table displays only sessions with activity that overlaps with the current 5-hour billing window. This ensures accurate billing representation - sessions are shown if they have any activity within the unified block time window, regardless of when they started.
Project Aggregation Mode (Default)
Project aggregation is also enabled by default. When both session display and project aggregation are enabled (the default), you get:
- Project View: Shows token usage aggregated by project instead of individual sessions
- Simplified Table: Removes session ID column for cleaner display
- Same Filtering: Uses the same unified block time window filtering as session mode
- Model Tracking: Shows all models used across all sessions within each project
- Activity Sorting: Projects sorted by their most recent activity time
To disable project aggregation and show individual sessions:
display:
  aggregate_by_project: false  # Show individual sessions instead of projects
Environment Variable:
export PAR_CC_USAGE_AGGREGATE_BY_PROJECT=false
Smart Token Limit Management
- Auto-adjustment: When current usage exceeds the configured limit, the limit is automatically increased and saved to the config file
- Visual indicators: Progress bars turn red when exceeding the original limit
- Real-time updates: Limits update immediately during monitoring
Read-Only Configuration Mode
- Config Protection: Set
config_ro: trueto prevent automatic updates to config file - Preserved CLI Overrides: CLI-specified values (like
--token-limit) still work normally - Manual Control: Use
pccu set-limit <type> <value>command to explicitly update limits when needed (supports token, message, cost) - Environment Variable: Set
PAR_CC_USAGE_CONFIG_RO=trueto enable read-only mode
Token Usage Calculation
PAR CC Usage calculates token consumption using a comprehensive approach that accounts for all token types and applies cost-based multipliers:
Token Types Included
- Input tokens: User prompts and context
- Output tokens: AI responses and generated content
- Cache creation tokens: Tokens used to create context caches
- Cache read tokens: Tokens read from existing context caches
Total Calculation: All token types are summed together for accurate billing representation.
Model-Based Token Multipliers
To reflect the actual cost differences between Claude models, tokens are adjusted using configurable multipliers:
Default Configuration:
- Opus models (
claude-opus-*): 5x multiplier - reflects significantly higher cost - Sonnet models (
claude-sonnet-*): 1x multiplier - baseline cost - Other/Unknown models: 1x multiplier - default fallback
Configuration Options: Token multipliers can be customized through:
- Configuration file: Set
model_multipliersinconfig.yaml - Environment variable:
PAR_CC_USAGE_MODEL_MULTIPLIERS=opus=5.0,sonnet=1.0,default=1.0 - CLI override:
--model-multipliers opus=5.0,sonnet=1.0,default=1.0
Multiplier Application: The multiplier is applied to the total token count (input + output + cache tokens) for each message, then aggregated by model within each billing block.
Example Custom Configuration:
model_multipliers:
  opus: 10.0    # Custom higher multiplier for Opus
  sonnet: 1.5   # Custom multiplier for Sonnet
  haiku: 0.5    # Custom multiplier for any Haiku models
  default: 1.0  # Fallback for unlisted models
Block-Level Aggregation
- Per-session blocks: Each 5-hour session maintains separate token counts
- Per-model tracking: Token counts are tracked separately for each model within a block
- Unified billing: When multiple sessions are active, the system aggregates tokens from all sessions that overlap with the current billing period
Deduplication
- Message + Request ID: Prevents double-counting when JSONL files are re-processed
- Processed hash tracking: Maintains a cache of seen message combinations
- Cross-session deduplication: Works across all active sessions and projects
Display Calculations
- Unified Block Total: Shows tokens from all sessions overlapping the current 5-hour billing window
- Per-Model Breakdown: Displays individual model contributions with multipliers applied
- Burn Rate: Calculated as tokens per minute based on activity within the current block
- Projections: Estimates total block usage based on current burn rate
Model Display Names
Model identifiers are simplified for better readability:
claude-opus-*→ Opusclaude-sonnet-*→ Sonnet- Unknown/other models → Unknown
Note: Claude Code primarily uses Opus and Sonnet models. Any other model names (including Haiku) are normalized to "Unknown".
Time Format Options
Configure time display format through display.time_format setting:
- 24h format (default): Shows time as
14:30and2024-07-08 14:30:45 PDT - 12h format: Shows time as
2:30 PMand2024-07-08 2:30:45 PM PDT
The time format applies to:
- Real-time monitor display (header and block progress)
- List command output (time ranges)
- Block time ranges in all display modes
Project Name Customization
Configure project name display through display.project_name_prefixes setting:
- Strip common prefixes: Remove repetitive path prefixes from project names
- Preserve project structure: Maintains the actual project name including dashes
- Configurable prefixes: Customize which prefixes to strip
Examples:
- Claude directory:
-Users-probello-Repos-my-awesome-project - With prefix
"-Users-probello-Repos-": Shows asmy-awesome-project - Without prefix stripping: Shows as
-Users-probello-Repos-my-awesome-project
Configuration:
display:
  project_name_prefixes:
    - "-Users-probello-Repos-"  # Strip your repos path
    - "-home-user-"             # Strip alternative home paths
Environment Variable:
export PAR_CC_USAGE_PROJECT_NAME_PREFIXES="-Users-probello-Repos-,-home-user-"
Cost Tracking & Pricing
PAR CC Usage includes comprehensive cost tracking capabilities using LiteLLM's pricing data for accurate cost calculations across all supported Claude models.
Enabling Cost Display
Via Command Line:
# Enable pricing for monitor mode
pccu monitor --show-pricing

# Enable pricing for session view
pccu monitor --show-sessions --show-pricing

# Enable pricing for list output
pccu list --show-pricing
Via Configuration File:
display:
  show_pricing: true  # Enable cost calculations and display
Via Environment Variable:
export PAR_CC_USAGE_SHOW_PRICING=true
Features
- Real-time cost tracking: Live cost calculations displayed alongside token usage
- Per-model accuracy: Precise cost calculations for each Claude model (Opus, Sonnet, Haiku)
- Activity table integration: Optional cost columns in both project and session aggregation views
- Total cost display: Overall cost shown in the main token usage summary
- Burn rate cost estimation: Intelligent 5-hour block cost projection based on current spending rate
- LiteLLM integration: Uses LiteLLM's comprehensive pricing database for accuracy
- Efficient caching: Built-in pricing cache for optimal performance
Cost Display Locations
When show_pricing is enabled, cost information appears in:
- Main Usage Summary: Total cost displayed next to token counts (e.g., "84.1M $34.85")
- Burn Rate Line: Estimated total cost for 5-hour block based on current spending rate (e.g., "531K/m Est: 159.3M (90%) Est: $65.51 ETA: 2h 28m")
- Activity Tables:
- Project aggregation mode: Cost column showing project-level costs
- Session aggregation mode: Cost column showing session-level costs
- List Command Output: Cost information in table, JSON, and CSV formats with cost source tracking
Pricing Data
PAR CC Usage uses LiteLLM's comprehensive pricing database for accurate, up-to-date model costs with intelligent fallback handling:
Core Pricing Features:
- Intelligent cost hierarchy: Three-tier cost calculation system for maximum accuracy
- Native cost data (Priority 1): Uses cost data from Claude JSONL files when available
- LiteLLM calculation (Priority 2): Falls back to real-time pricing calculations
- Cost source transparency: All outputs include cost calculation source for debugging
- Real-time pricing data: Uses LiteLLM's pricing database for current model costs
- Comprehensive model support: Covers all Claude model variants with accurate per-token pricing
- Token type handling: Proper pricing for input, output, cache creation, and cache read tokens
- Automatic model mapping: Maps Claude Code model names to LiteLLM pricing keys
- Future-proof design: Automatically uses native Claude cost data when available
Intelligent Fallback System:
- Unknown model handling: Models marked as "Unknown" automatically display $0.00 cost
- Pattern-based fallbacks: When exact model names aren't found, uses intelligent pattern matching:
- Models containing "opus" → Falls back to Claude Opus pricing
- Models containing "sonnet" → Falls back to Claude Sonnet pricing
- Models containing "haiku" → Falls back to Claude Haiku pricing
- Fuzzy matching: Partial name matching for model variants and prefixes
- Generic Claude fallbacks: Unrecognized Claude models fall back to Sonnet pricing as a safe default
- Graceful error handling: Missing pricing data doesn't break functionality
Cost Calculation Hierarchy:
PAR CC Usage implements an intelligent three-tier cost calculation system for maximum accuracy:
# Example list output showing cost source transparency
pccu list --show-pricing --format json
[
  {
    "project": "my-app",
    "session": "abc123...",
    "model": "opus",
    "tokens": 150000,
    "active": true,
    "cost": 12.50,
    "cost_source": "block_native"     # Native cost from Claude
  },
  {
    "project": "my-app",
    "session": "def456...",
    "model": "sonnet",
    "tokens": 75000,
    "active": true,
    "cost": 3.25,
    "cost_source": "litellm_calculated"  # Calculated with LiteLLM
  }
]
Cost Source Types:
"block_native": Cost from TokenBlock native data (highest priority)"usage_native": Cost from TokenUsage native data (medium priority)"litellm_calculated": Cost calculated using LiteLLM pricing (fallback)
Cost Validation:
- Native cost data is validated for reasonableness ($0.01-$1000.00)
- Invalid native costs automatically fall back to LiteLLM calculation
- Suspiciously high costs (>$1000) are logged and ignored
Examples of Fallback Behavior:
"Unknown"→ $0.00 cost (no charges applied)"claude-opus-custom"→ Uses Claude Opus pricing via pattern matching"anthropic/claude-sonnet-experimental"→ Uses Claude Sonnet pricing via fuzzy matching"custom-claude-model"→ Uses Claude Sonnet pricing as generic fallback
Webhook Notifications
PAR CC Usage can send webhook notifications to Discord and/or Slack when 5-hour billing blocks complete, helping you stay aware of your usage patterns and costs.
Discord Setup
-
Create Discord Webhook:
- Go to your Discord server settings
- Navigate to Integrations > Webhooks
- Create a new webhook and copy the URL
-
Configure Discord Webhook:
notifications:
  discord_webhook_url: https://discord.com/api/webhooks/your-webhook-url
  notify_on_block_completion: true
  cooldown_minutes: 5
Or via environment variable:
export PAR_CC_USAGE_DISCORD_WEBHOOK_URL="https://discord.com/api/webhooks/your-webhook-url"
Slack Setup
-
Create Slack Webhook:
- Go to your Slack workspace settings
- Navigate to Apps > Incoming Webhooks
- Create a new webhook and copy the URL
-
Configure Slack Webhook:
notifications:
  slack_webhook_url: https://hooks.slack.com/services/your-webhook-url
  notify_on_block_completion: true
  cooldown_minutes: 5
Or via environment variable:
export PAR_CC_USAGE_SLACK_WEBHOOK_URL="https://hooks.slack.com/services/your-webhook-url"
Multiple Webhooks
You can configure both Discord and Slack webhooks simultaneously:
notifications:
  discord_webhook_url: https://discord.com/api/webhooks/your-discord-webhook
  slack_webhook_url: https://hooks.slack.com/services/your-slack-webhook
  notify_on_block_completion: true
  cooldown_minutes: 5
Test Configuration
# Test all configured webhooks
pccu test-webhook
Notification Features
- Block Completion Alerts: Notifications sent when a 5-hour block completes
- Activity Filtering: Only sends notifications for blocks that had activity (token usage > 0)
- One-Time Sending: Each block completion notification is sent only once
- Cooldown Protection: Configurable minimum time between notifications (default: 5 minutes)
- Rich Information: Includes token usage, duration, limit status, and time ranges
- Smart Coloring: Visual indicators based on token limit usage (green/orange/red)
Notification Content
Each notification includes:
- Block Duration: How long the block lasted
- Token Usage: Active and total token counts
- Limit Status: Percentage of configured limit used
- Time Range: Start and end times in your configured timezone
- Visual Indicators: Color-coded based on usage levels
Configuration Options
discord_webhook_url: Discord webhook URL (optional - for Discord notifications)slack_webhook_url: Slack webhook URL (optional - for Slack notifications)notify_on_block_completion: Enable/disable block completion notifications (default: true)cooldown_minutes: Minimum minutes between notifications (default: 5)
Theme System
PAR CC Usage includes a comprehensive theme system that allows you to customize the visual appearance of the CLI interface to match your preferences, terminal setup, and accessibility needs.
Available Themes
Default Theme: Original bright color scheme with vibrant colors
- Use case: General usage with high contrast
- Colors: Bright colors (cyan, yellow, green, red, magenta)
- Best for: Dark terminals, users who prefer bright colors
Dark Theme: Optimized for dark terminal backgrounds
- Use case: Dark mode terminals with refined colors
- Colors: Softer bright colors with better dark background contrast
- Best for: Dark terminals, reduced eye strain
Light Theme: Solarized Light inspired color palette
- Use case: Light terminal backgrounds
- Colors: Solarized Light palette (darker text, warm backgrounds)
- Best for: Light terminals, bright environments
Accessibility Theme: High contrast theme meeting WCAG AAA standards
- Use case: Visual accessibility and screen readers
- Colors: High contrast colors (black text on white background)
- Best for: Accessibility needs, high contrast requirements
Minimal Theme: Grayscale theme with minimal color usage
- Use case: Distraction-free, professional environments
- Colors: Grayscale palette (white, grays, black)
- Best for: Minimal aesthetics, focus on content over colors
Theme Configuration
Set Default Theme (saves to config file):
# Set light theme as default
pccu theme set light

# Set accessibility theme as default
pccu theme set accessibility

# Set with custom config file
pccu theme set dark --config my-config.yaml
Temporary Theme Override (session only):
# Override theme for single command
pccu monitor --theme light
pccu list --theme accessibility
pccu list-sessions --theme minimal

# Theme persists for the entire command execution
pccu monitor --theme light --show-sessions --show-pricing
Configuration File Setting:
display:
  theme: light  # Options: 'default', 'dark', 'light', 'accessibility', 'minimal'
Environment Variable:
export PAR_CC_USAGE_THEME=accessibility
Theme Management Commands
# List all available themes with descriptions
pccu theme list

# Get current theme setting
pccu theme current

# Set default theme (saves to config)
pccu theme set <theme-name>
Theme Features
- Semantic Color System: Uses meaningful color names (success, warning, error, info) for consistency
- Rich Integration: Full integration with Rich library for optimal terminal rendering
- Responsive Design: Themes work across all display modes (normal, compact, sessions)
- Consistent Application: Colors are applied uniformly across all UI elements
- Configuration Flexibility: Multiple ways to set themes (CLI, config file, environment)
Theme Scope
Themes apply to all visual elements:
- Progress bars: Token usage and block progress indicators
- Tables: Project and session data tables
- Status indicators: Active/inactive sessions, success/error states
- Burn rate displays: Token consumption metrics
- Headers and borders: UI structure elements
- Cost information: Pricing and cost calculation displays (when enabled)
Best Practices
- Light terminals: Use
lightoraccessibilitythemes - Dark terminals: Use
defaultordarkthemes - Accessibility needs: Use
accessibilitytheme for high contrast - Professional environments: Use
minimaltheme for clean appearance - Testing themes: Use
--themeflag to test before setting as default
File Locations
XDG Base Directory Specification
PAR CC Usage follows the XDG Base Directory Specification for proper file organization:
| Directory | Default Location | Environment Variable | Purpose |
|---|---|---|---|
| Config | ~/.config/par_cc_usage/ |
XDG_CONFIG_HOME |
Configuration files |
| Cache | ~/.cache/par_cc_usage/ |
XDG_CACHE_HOME |
File monitoring cache |
| Data | ~/.local/share/par_cc_usage/ |
XDG_DATA_HOME |
Application data |
Configuration Files
- Main config:
~/.config/par_cc_usage/config.yaml - Cache file:
~/.cache/par_cc_usage/file_states.json
Legacy File Migration
The tool automatically migrates configuration files from legacy locations:
./config.yaml(current working directory)~/.par_cc_usage/config.yaml(home directory)
Migration happens automatically on first run if:
- Legacy config file exists
- XDG config file doesn't exist
- File is copied to
~/.config/par_cc_usage/config.yaml
Environment Variable Override
You can override XDG directories using standard environment variables:
# Override config directory
export XDG_CONFIG_HOME="/custom/config/path"

# Override cache directory
export XDG_CACHE_HOME="/custom/cache/path"

# Override data directory
export XDG_DATA_HOME="/custom/data/path"
Coming Soon
We're actively working on exciting new features to enhance your Claude Code monitoring experience:
💰 Cost Tracking for Non-Subscribers
- Historical cost analysis: Track spending patterns over time
- Budget alerts: Configurable notifications when approaching cost thresholds
Want to contribute or request a feature? Check out our GitHub repository or open an issue with your suggestions!
What's New
v0.17.0 - ANSI Theme & Dependency Updates
New Feature: Added terminal-native ANSI theme for users with custom terminal color palettes.
✨ New Features
- ANSI Theme: New theme using standard ANSI color names instead of hex values
- Respects your terminal's configured color palette (Catppuccin, Dracula, Nord, Solarized, etc.)
- Use with
pccu monitor --theme ansior set as default withpccu theme set ansi - Fixes garish colors when using custom terminal themes (issue #3)
📦 Dependency Updates
- Updated all dependencies to latest versions (rich 14.3.1, typer 0.21.1, pydantic 2.12.5, etc.)
Thanks to @tartansandal for the detailed investigation and fix suggestions!
v0.16.0 - Last Message Time Display
New Feature: Status line now supports showing the actual timestamp of the last message.
✨ New Features
- Last Message Time: Added
{last_message_time}template variable showing timestamp (e.g., "📝 08:42 AM") - Helps users gauge if their prompt cache is still active (5-minute default lifetime)
Thanks to @catapulta for this contribution!
v0.15.1 - Security Updates
Security: Updated dependencies to address security vulnerabilities.
🔒 Security Fixes
- aiohttp: Updated to 3.13.3 (fixes zip bomb, DoS, and cookie parser vulnerabilities)
- urllib3: Updated to 2.6.3 (fixes decompression bomb bypass vulnerabilities)
- filelock: Updated to 3.20.3 (fixes TOCTOU symlink vulnerabilities)
- virtualenv: Updated to 20.36.1 (fixes TOCTOU directory creation vulnerabilities)
v0.15.0 - Opus 4.5 Model Support
New Features: Added proper support for Claude Opus 4.5 model with correct pricing.
✨ New Features
- Opus 4.5 Support: Added
CLAUDE_OPUS_4_5model type for proper recognition - Pricing Fix: Opus 4.5 now correctly maps to LiteLLM pricing instead of generic "opus" with $0 cache pricing
🐛 Bug Fixes
- Cost Calculation: Fixed ~99% cost underreporting when using Opus 4.5 (cache tokens now priced correctly)
v0.14.2 - Additional Status Line Git Path Fixes
Bug Fixes: Further improvements to status line git path resolution:
🐛 Bug Fixes
- Git Path Resolution: Additional fixes for status line git status detection
- Path Handling: Improved robustness of project path decoding and git repository detection
v0.14.1 - Status Line Git Status & Pre-commit Fix
Bug Fixes: Fixed git status template variables and pre-commit hook corruption issue:
🐛 Bug Fixes
- Git Status Variables:
{git_branch}and{git_status}now correctly check git status of the Claude Code project being worked on - Project Path Resolution: Added logic to decode Claude Code project directory names back to actual project paths
- Session-Based Detection: Git status is now determined from the session ID's project location
- Pre-commit Hook: Fixed uv.lock corruption by changing pre-commit hook language from
pythontosystem
v0.14.0 - Model Context Window Corrections
Bug Fixes & Improvements: Corrected model context window sizes and improved model detection:
🐛 Bug Fixes
- Context Window Correction: Fixed Claude Sonnet 4.5 context window from 1M to 200K tokens (1M is beta feature via API parameter, not default)
- Model Detection: Improved partial matching logic by sorting keys longest-first for proper model precedence
🎯 New Features
- Additional Models: Added Haiku 4.5 and Sonnet 4 to context window mapping (200K tokens)
v0.13.0 - Configuration & Testing Improvements
Enhanced Configuration Defaults: Updated default configuration values and improved test coverage:
🔧 Configuration Updates
- Pricing Display: Changed default
show_pricingtotruefor better cost visibility out of the box - Tool Usage Display: Added
show_tool_usageconfiguration option (default:true) - Git Status Indicators: Enhanced status line git indicators with configurable clean/dirty markers
📝 Documentation
- Command Coverage: Added documentation for
configure-statusline,filter-sessions, anddebug-session-tablecommands - Configuration Guide: Updated config examples to reflect actual defaults
✅ Testing
- Windows Compatibility: Fixed test suite path assumptions for cross-platform compatibility
- Config Tests: Improved configuration testing for Windows path scenarios
v0.12.2 - Session Token Tracking Improvements
Enhanced Reliability: Improved session token extraction for more stable status line display during heavy tool usage:
🔧 Bug Fixes
- Session Token Stability: Increased JSONL search window from 20 to 100 lines to prevent token count from jumping backwards
- Tool Usage Handling: Fixed issue where session tokens would show 0 during periods with many consecutive non-usage entries (tool calls, user messages)
- Display Consistency: Eliminated display jumps in status line during heavy tool usage periods
v0.12.1 - Critical Windows Path Fix
Windows Session Tracking: Fixed critical bug preventing session token tracking on Windows systems:
🐛 Bug Fixes
- Windows Path Handling: Fixed session token tracking by using
Path.relative_to()instead of string operations - Progress Bar Accuracy: Fixed progress bar visual rendering to correctly account for percentage text width
- Model-Specific Context Windows: Added dynamic context window detection (1M tokens for Sonnet 4.5, 200K for other models)
✅ Testing
- Added comprehensive Windows path testing suite with 197 new test cases
- Verified session token extraction across all Windows path formats (C:, D:, network paths)
v0.12.0 - Cross-Platform Path Improvements
Enhanced Path Display: Better cross-platform path handling and user feedback:
🔧 Improvements
- Platform-Specific Paths: Fixed hardcoded path strings in error messages to display correct platform-specific paths
- Installation Feedback: Updated
install-statuslineanduninstall-statuslinecommands to show resolved paths - Path Verification: Verified all file operations work correctly across Windows, Linux, and macOS
v0.11.0 - Claude 4 Model Support
Latest Model Support: Full support for Claude 4 model family with comprehensive pricing and detection:
🎯 New Features
- Claude 4 Models: Added support for Sonnet 4.5, Opus 4.1, and Haiku 4.5
- Model Detection: Updated normalization to detect both hyphenated and dotted model name formats
- Pricing Fallbacks: Added pricing fallbacks for all Claude 4.x models with proper date stamps
- Model Documentation: Updated README with complete list of supported Claude models
🔧 Technical Updates
- Enhanced
ModelTypeenum with CLAUDE_SONNET_4_5, CLAUDE_OPUS_4_1, CLAUDE_HAIKU_4_5 - Improved model name normalization for better compatibility
- Updated pricing system with Claude 4 pricing data
- All 812 tests passing with zero lint/type errors
v0.10.1 - Windows Compatibility Fixes
Enhanced Windows Support: Fixed encoding issues, improved Windows terminal compatibility, and resolved monitor display issues:
🪟 Windows Compatibility (Fixed)
- Status Line Encoding: Fixed
UnicodeEncodeErrorinpccu statuslinecommand on Windows - UTF-8 Output Handling: Added safe UTF-8 output with fallback for Windows cp1252 encoding
- Settings File Creation:
install-statuslinenow createssettings.jsonif it doesn't exist - Unicode Symbol Replacement: Replaced problematic Unicode symbols (✓, ✗) with ASCII alternatives
- Emoji Preservation: Kept all emojis (🪙💬💰⏱️) - they work correctly via Rich library in Windows Terminal
- Path Compatibility: Verified all path operations use
pathlib.Pathfor cross-platform support - Default Windows Prefixes: Added
C--Users-,D--Users-,E--Users-to default config for path stripping
🐛 Monitor Display Fixes
- Sessions Panel Empty Issue: Fixed sessions panel showing empty by replacing
ZoneInfo("UTC")withdatetime.UTC - Git Bash Emoji Fallback: Added automatic detection of Git Bash/MSYS2 environments with text-based model icons ([S], [O], [H])
- Model Icon Compatibility: Model emojis (⚡, 🚀, 💨) automatically fall back to text labels in Git Bash
🔧 Bug Fixes
- Fixed
install-statuslinefailing when Claude Codesettings.jsondoesn't exist - Replaced Unicode check marks with "OK", "PASS", and "ERROR" text for better compatibility
- Updated default git status indicators to use asterisk (*) instead of checkmarks
- Added comprehensive error handling in
emoji_config.pytest utility - Fixed status line project name stripping to work correctly with Windows paths
- Removed
tzdatadependency by usingdatetime.UTCinstead ofZoneInfo
💡 Usage Note
For best results on Windows, use Windows Terminal instead of Git Bash. Windows Terminal provides full UTF-8 and emoji support, ensuring all display features work correctly.
v0.10.0 - Advanced Status Line Progress Bars & Performance
Enhanced Progress Bars & Optimized Performance: Rich progress bar styles with colorization and intelligent conditional data fetching:
🎨 Progress Bar Enhancements (New)
- Colorized Progress Bars: Dynamic color coding based on usage levels (green < 50%, yellow 50-79%, red ≥ 80%)
- Rich Style Option: Clean line-based progress bars (━╺) as alternative to block style (█░)
- Centered Percentage Display: Optional percentage shown in center of progress bar with automatic width adjustment
- Bright ANSI Colors: Uses bright/light color variants for better visibility in terminals
- Configurable Bar Length: Customizable progress bar width (default: 15 characters)
- Model Template Variable: Display current Claude model name with
{model}in status line templates
⚡ Performance Optimizations (New)
- Conditional Data Fetching: Only fetches git status, session tokens, date/time when actually used in template
- Reduced Overhead: Eliminates unnecessary subprocess calls and file operations
- Smart Template Processing: Analyzes template to determine which data sources are needed
- Optimized Session Token Extraction: Skips expensive JSONL parsing when session tokens aren't displayed
🔧 Configuration Options (New)
statusline_progress_bar_colorize: true     # Enable color-coded progress bars
statusline_progress_bar_style: rich        # 'basic' or 'rich' style
statusline_progress_bar_length: 15         # Progress bar width
statusline_progress_bar_show_percent: true # Show percentage in bar
v0.9.0 - Enhanced Status Line with Project Names
Improved Claude Code Status Line: Project names now display in status line for better context:
🏷️ Project Name Display (New)
- Project Context: Status line now shows project name in square brackets at the beginning
- Session Mode: Displays project name when showing session-specific statistics
- Grand Total Mode: Shows project name with grand total stats when valid session ID provided
- Format:
[project-name] - 🪙 tokens - 💬 messages - 💰 cost - ⏱️ time - Example:
[parllama] - 🪙 38.7M/905.8M (4%) - 💬 75/1,990 - 💰 $12.92/$293.46 - ⏱️ 4h 46m
v0.8.0 - Claude Code Status Line Integration
Complete Claude Code Integration: Real-time usage display in Claude Code's status bar with automatic installation:
🔌 Status Line Features (New)
- Automatic Installation: Single command (
pccu install-statusline) configures Claude Code - Real-Time Display: Live token usage, messages, costs, and block time remaining in status bar
- Per-Session Tracking: Default mode tracks current Claude Code session with full cost data
- Grand Total Mode: Optional aggregated view across all sessions
- Block Time Remaining: Shows time left in current 5-hour billing block (e.g., ⏱️ 2h 8m)
- Cost Calculations: Both session and grand total modes include real-time cost tracking
📊 Status Line Format
🪙 495.7M/510.7M (97%) - 💬 736/1,734 - 💰 $155.27/$166.80 - ⏱️ 2h 8m
- Tokens: Current usage with limit and percentage
- Messages: Message count with limit
- Cost: Real-time cost tracking with limit
- Time: Remaining time in current billing block (NEW!)
🚀 Quick Setup
# Install status line (automatic configuration)
pccu install-statusline

# Remove status line
pccu uninstall-statusline

# Test status line output
echo '{"sessionId": "test"}' | pccu statusline
v0.7.0 - Enhanced Configuration Management
Enhanced Update Maximums Command: New --use-current-block option for more flexible configuration management:
🔧 Current Block Configuration (New Feature)
- Simplified Setup: Use
--use-current-blockflag to set maximums based only on current active block totals - Performance Optimized: Skips expensive historical data analysis when using current block only
- Quick Baseline Setting: Perfect for setting initial configuration baselines or adjusting after usage pattern changes
- Consistent Behavior: Uses current block values for both maximum and P90 settings
# Set maximums to current block totals (fast)
pccu update-maximums --use-current-block

# Preview current block changes
pccu update-maximums --use-current-block --dry-run
v0.6.0 - Usage Summary Analytics
Comprehensive Usage Analytics: New usage summary command with advanced statistical analysis and flexible time bucketing:
📈 Usage Summary Analytics (New Feature)
- Statistical Analysis: Totals, averages, and P90 (90th percentile) statistics for tokens, messages, and costs
- Time Bucketing: Flexible time period analysis - daily, weekly (ISO weeks), monthly, or all-time summaries
- P90 Insights: P90 values show typical "high usage" sessions while filtering extreme outliers
- Model & Tool Breakdowns: Optional detailed breakdowns showing usage distribution across Claude models and tools
- Multiple Export Formats: Rich tables (default), JSON for data analysis, and CSV for spreadsheet import
- Period Limiting: Control analysis scope with
--period-limit(e.g., last 4 weeks, last 30 days) - Comprehensive Options: Full integration with existing pricing, theming, and configuration systems
📊 Statistical Features
- Time Span Analysis: Automatically calculates total time span across usage history
- Unique Tracking: Counts unique projects, sessions, models, and tools used
- Overall Statistics: Cross-period summary with overall totals and averages
- P90 vs Average: Helps identify usage variability patterns (P90 > average indicates healthy variation)
💻 Command Examples
# Monthly summary with all features
pccu usage-summary --show-models --show-tools --show-pricing

# Weekly analysis for last 8 weeks
pccu usage-summary --time-bucket weekly --period-limit 8

# Export detailed analysis to CSV
pccu usage-summary --format csv --output analysis.csv
v0.5.0 - Claude Sonnet 4 Support & Monitor Mode Stability
Enhanced Model Support & Stability: Added full support for Claude Sonnet 4 model and improved monitor mode reliability:
🤖 Claude Sonnet 4 Support (New Feature)
- Full Model Support: Added complete support for
ModelType.CLAUDE_SONNET_4model type - Pricing Integration: Automatic pricing fallback to Claude 3.5 Sonnet rates for cost calculations
- Enum Handling: Robust handling of ModelType enum objects throughout the pricing system
🖥️ Monitor Mode Stability Improvements
- Error Suppression: Eliminated pricing warnings that caused monitor display to jump and scroll
- Stable Interface: Clean, uninterrupted real-time monitoring experience
- Debug Mode: Pricing warnings still available in debug mode for troubleshooting
- Graceful Fallbacks: Better error handling for unknown model types
🛠️ Technical Improvements
- Type Safety: Enhanced type checking for model name parameters
- Logging Configuration: Improved logging levels to prevent display disruption
- Code Quality: All changes pass strict linting and type checking standards
v0.4.0 - Automatic Timezone Detection
Seamless Timezone Management: Intelligent automatic timezone detection with dynamic system timezone change support:
🌐 Automatic Timezone Detection (New Feature)
- System Auto-Detection: Automatically detects your system's timezone on startup - no manual configuration needed
- Dynamic Updates: Detects system timezone changes when config is reloaded (perfect for travelers or system changes)
- Cross-Platform Support: Works seamlessly across Windows, macOS, and Linux platforms
- Smart Fallback: Graceful fallback to Pacific timezone if detection fails
- New Default:
timezone: autois now the default for all new installations and examples
v0.3.0 - Test Suite Improvements & Infrastructure
Enhanced Test Coverage & Code Quality: Significant improvements to test infrastructure and code reliability:
🧪 Test Coverage Improvements
- 72% Overall Coverage: Improved from 66% to 72% total test coverage (+6% improvement)
📏 P90 Progress Bar Limits (New Feature)
- P90-Based Progress Bars: Progress bars now use 90th percentile (P90) values by default instead of absolute maximums for more stable and realistic progress indicators
- Outlier Resilience: Automatically filters out extreme usage spikes that previously skewed progress displays
- Visual P90 Indicators: Clear "(P90)" labels when P90 mode is active
- Configurable Toggle: Switch between P90 and absolute maximum via
--no-p90flag oruse_p90_limitconfig setting - Default Enabled: P90 mode is enabled by default for better user experience
v0.2.1 - Progress Bar & Max Value Tracking Fixes
Enhanced Progress Bar Accuracy & Comprehensive Max Value Tracking: Fixed critical issues with progress bar calculation and startup scanning:
🔧 Bug Fixes
- Progress Bar Percentage: Fixed progress bar using wrong field (
max_tokens_encounteredvsmax_unified_block_tokens_encountered) causing incorrect percentages (e.g., 83% when should be 100%) - Comprehensive Max Value Scanning: Enhanced startup to scan ALL unified blocks for highest tokens, messages, and costs instead of only checking current block
- Accurate Config Updates: Max values in config now properly reflect true historical maximums across all data
🎯 Improvements
- Precise Progress Display: Progress bars now show accurate percentages based on unified block maximums
- Better Auto-scaling: Config limits automatically adjust based on comprehensive historical data analysis
- Enhanced Startup Performance: Proper max value tracking ensures accurate display scaling from first run
v0.2.0 - Documentation Clean-up
Code Documentation Standardization: Updated tests and documentation to use consistent terminology throughout the codebase:
📝 Documentation Updates
- Test Documentation: Updated test comments and docstrings to use standard terminology
- Code Comments: Standardized internal documentation and comments
- User Documentation: Updated CLAUDE.md and other documentation files
- Consistent Terminology: Replaced external tool references with standard behavior descriptions
v0.1.12 - Documentation Restructure & Organization
Streamlined Documentation Structure: Major reorganization of project documentation for better maintainability and user experience:
📚 Documentation Improvements
- Reorganized README.md: Streamlined to focus on essential high-level information (installation, quick start, what's new)
- Comprehensive Documentation Files: Created detailed guides in
docs/directory:docs/FEATURES.md- Complete features overview and capabilitiesdocs/USAGE_GUIDE.md- Detailed usage examples and common patternsdocs/CONFIGURATION.md- Configuration options and environment variablesdocs/DISPLAY_FEATURES.md- Themes, display modes, and customization
- Enhanced Navigation: Clear documentation structure with emoji icons and descriptive links
- Improved Discoverability: Information now logically separated by use case and audience
🔧 Benefits
- Better Maintainability: Changes to specific topics can be made in focused files
- Reduced Cognitive Load: Essential information easily accessible without overwhelming detail
- Enhanced User Experience: Quick reference (README) separate from detailed documentation
- Improved Organization: Clear pathways between overview and in-depth information
v0.1.11 - UI Enhancement Package
Comprehensive Display Improvements: Three focused UI enhancements for better readability and user experience:
📊 Number Formatting Enhancement
- Comma-Formatted Counts: All message counts now display with thousand separators for improved readability
- Progress displays:
💬 1,502instead of💬 1502 - Project/session tables:
1,205instead of1205 - Unified formatting across all interface elements
- Progress displays:
🎯 Progress Bar Accuracy Fix
- 100% Display Fix: Progress bars now correctly show 100% when current values equal maximum values
- Precision Issue Resolution: Fixed floating-point precision problems from token aggregation
- Accurate Representation:
min(total_tokens, total_limit)ensures proper percentage calculation - Consistent Display: Progress percentage matches actual usage ratios
🔧 MCP Tool Display Enhancement
- Prefix Stripping: MCP tools display without verbose
mcp__prefixes for cleaner interfacemcp__SeqThink__sequentialthinking→SeqThink__sequentialthinkingmcp__Tavily__tavily-search→Tavily__tavily-search
- Color Differentiation: MCP tools use distinct colors (
tool_mcp) from regular tools (tool_usage) - Theme Integration: All color themes updated with appropriate MCP tool colors
- Universal Application: Enhanced display in tool usage tables, project views, and session views
🎨 Technical Implementation
- Helper Functions: Added
_format_tool_name(),_get_tool_color(), and_format_tool_list() - Theme System Extension: Added
tool_mcpcolor field to all 5 built-in themes - Comprehensive Updates: Updated all tool display locations for consistent formatting
- Test Coverage: Updated theme tests to include new color field
older...
Earlier versions focused on foundational architecture, file monitoring, and basic token tracking capabilities.
Documentation
For detailed information and advanced usage:
- 📋 Complete Features List - Comprehensive overview of all features and capabilities
- 🚀 Usage Guide - Detailed usage examples and common patterns
- ⚙️ Configuration Guide - Configuration options, environment variables, and file locations
- 🎨 Display Features - Themes, display modes, and customization options
- 🏗️ Architecture - System architecture and design decisions
- 🔧 Development - Development workflows and advanced features
- 🐛 Troubleshooting - Common issues and debugging
- 📝 CLAUDE.md - Quick reference for Claude Code users
Development
# Format and lint
make checkall

# Run development mode
make dev
License
This project is licensed under the MIT License - see the LICENSE file for details.
Project details
Verified details
These details have been verified by PyPIProject links
GitHub Statistics
Maintainers
Release history Release notifications | RSS feed


Download files
Download the file for your platform. If you're not sure which to choose, learn more about installing packages.
Source Distribution
Built Distribution
Filter files by name, interpreter, ABI, and platform.
If you're not sure about the file name format, learn more about wheel file names.
Copy a direct link to the current filters
File details
Details for the file par_cc_usage-0.17.0.tar.gz.
File metadata
- Download URL: par_cc_usage-0.17.0.tar.gz
- Upload date:
- Size: 164.4 kB
- Tags: Source
- Uploaded using Trusted Publishing? Yes
- Uploaded via: twine/6.1.0 CPython/3.13.7
File hashes
| Algorithm | Hash digest | |
|---|---|---|
| SHA256 |
ebe7ac0b550b95c848abe99007d860e6075f89a2567317495eae73997909ce95
|
|
| MD5 |
08831b300d4f4df120168f81f23727a7
|
|
| BLAKE2b-256 |
609b04b972ea92ce9874d48e5c11e4cf6a76c529dcef8a05c179b8f0cde5cc7b
|
Provenance
The following attestation bundles were made for par_cc_usage-0.17.0.tar.gz:
Publisher:
deploy.yml on paulrobello/par_cc_usage
-
Statement:
-
Statement type:
https://in-toto.io/Statement/v1 -
Predicate type:
https://docs.pypi.org/attestations/publish/v1 -
Subject name:
par_cc_usage-0.17.0.tar.gz -
Subject digest:
ebe7ac0b550b95c848abe99007d860e6075f89a2567317495eae73997909ce95 - Sigstore transparency entry: 868947338
- Sigstore integration time:
-
Permalink:
paulrobello/par_cc_usage@36d9aa3ba169352a1c6b18a20ef2c813327d5261 -
Branch / Tag:
refs/heads/main - Owner: https://github.com/paulrobello
-
Access:
public
-
Token Issuer:
https://token.actions.githubusercontent.com -
Runner Environment:
github-hosted -
Publication workflow:
deploy.yml@36d9aa3ba169352a1c6b18a20ef2c813327d5261 -
Trigger Event:
workflow_dispatch
-
Statement type:
File details
Details for the file par_cc_usage-0.17.0-py3-none-any.whl.
File metadata
- Download URL: par_cc_usage-0.17.0-py3-none-any.whl
- Upload date:
- Size: 150.9 kB
- Tags: Python 3
- Uploaded using Trusted Publishing? Yes
- Uploaded via: twine/6.1.0 CPython/3.13.7
File hashes
| Algorithm | Hash digest | |
|---|---|---|
| SHA256 |
b484f899633f92d2583c2e71d1aaf49acc5fa5d1c9a10d3c9ca8473f73ac0755
|
|
| MD5 |
dcade120a132461a3aeb24e37bfa1321
|
|
| BLAKE2b-256 |
1e5d1b1e59e610c91c902d39f49630b2f4d62ef4c9076b5d5577db7836dd9c6c
|
Provenance
The following attestation bundles were made for par_cc_usage-0.17.0-py3-none-any.whl:
Publisher:
deploy.yml on paulrobello/par_cc_usage
-
Statement:
-
Statement type:
https://in-toto.io/Statement/v1 -
Predicate type:
https://docs.pypi.org/attestations/publish/v1 -
Subject name:
par_cc_usage-0.17.0-py3-none-any.whl -
Subject digest:
b484f899633f92d2583c2e71d1aaf49acc5fa5d1c9a10d3c9ca8473f73ac0755 - Sigstore transparency entry: 868947341
- Sigstore integration time:
-
Permalink:
paulrobello/par_cc_usage@36d9aa3ba169352a1c6b18a20ef2c813327d5261 -
Branch / Tag:
refs/heads/main - Owner: https://github.com/paulrobello
-
Access:
public
-
Token Issuer:
https://token.actions.githubusercontent.com -
Runner Environment:
github-hosted -
Publication workflow:
deploy.yml@36d9aa3ba169352a1c6b18a20ef2c813327d5261 -
Trigger Event:
workflow_dispatch
-
Statement type:


