Plotting smooth parallel plots

Project description
Generating nice smooth parallel plots!
How to install
Just run
pip install parallelplot
Little Demo on the Wine Quality Dataset
First lets import some packages we need to get some sample data
# Import libraries to handle data
import numpy as np
import pandas as pd

# The only thing that is really needs to be imported
# is the plot function from the parallelplot module
# and the pyplot module from matplotlib to display the plot
import parallelplot.plot as pp
import matplotlib.pyplot as plt


# There is also a module that contains a nice colormap. In addition you can use the matplotlib colormap module
from parallelplot.cmaps import purple_blue
import matplotlib.cm as cm
# Function to download and load the wine quality dataset
def load_wine_quality_dataset():
    # URLs for the Wine Quality datasets
    red_wine_url = "https://archive.ics.uci.edu/ml/machine-learning-databases/wine-quality/winequality-red.csv"
    white_wine_url = "https://archive.ics.uci.edu/ml/machine-learning-databases/wine-quality/winequality-white.csv"

    # Download and read the datasets
    red_wine = pd.read_csv(red_wine_url, sep=';')
    white_wine = pd.read_csv(white_wine_url, sep=';')

    # Add a wine type column
    red_wine['wine_type'] = 'red'
    white_wine['wine_type'] = 'white'

    # Combine the datasets
    wine_df = pd.concat([red_wine, white_wine], axis=0, ignore_index=True)

    return wine_df


wine_df = load_wine_quality_dataset()
print("Wine Quality Dataset:")
wine_df
Wine Quality Dataset:
<style scoped>
.dataframe tbody tr th:only-of-type {
vertical-align: middle;
}
.dataframe tbody tr th {
    vertical-align: top;
}

.dataframe thead th {
    text-align: right;
}
| fixed acidity | volatile acidity | citric acid | residual sugar | chlorides | free sulfur dioxide | total sulfur dioxide | density | pH | sulphates | alcohol | quality | wine_type | |
|---|---|---|---|---|---|---|---|---|---|---|---|---|---|
| 0 | 7.4 | 0.70 | 0.00 | 1.9 | 0.076 | 11.0 | 34.0 | 0.99780 | 3.51 | 0.56 | 9.4 | 5 | red |
| 1 | 7.8 | 0.88 | 0.00 | 2.6 | 0.098 | 25.0 | 67.0 | 0.99680 | 3.20 | 0.68 | 9.8 | 5 | red |
| 2 | 7.8 | 0.76 | 0.04 | 2.3 | 0.092 | 15.0 | 54.0 | 0.99700 | 3.26 | 0.65 | 9.8 | 5 | red |
| 3 | 11.2 | 0.28 | 0.56 | 1.9 | 0.075 | 17.0 | 60.0 | 0.99800 | 3.16 | 0.58 | 9.8 | 6 | red |
| 4 | 7.4 | 0.70 | 0.00 | 1.9 | 0.076 | 11.0 | 34.0 | 0.99780 | 3.51 | 0.56 | 9.4 | 5 | red |
| ... | ... | ... | ... | ... | ... | ... | ... | ... | ... | ... | ... | ... | ... |
| 6492 | 6.2 | 0.21 | 0.29 | 1.6 | 0.039 | 24.0 | 92.0 | 0.99114 | 3.27 | 0.50 | 11.2 | 6 | white |
| 6493 | 6.6 | 0.32 | 0.36 | 8.0 | 0.047 | 57.0 | 168.0 | 0.99490 | 3.15 | 0.46 | 9.6 | 5 | white |
| 6494 | 6.5 | 0.24 | 0.19 | 1.2 | 0.041 | 30.0 | 111.0 | 0.99254 | 2.99 | 0.46 | 9.4 | 6 | white |
| 6495 | 5.5 | 0.29 | 0.30 | 1.1 | 0.022 | 20.0 | 110.0 | 0.98869 | 3.34 | 0.38 | 12.8 | 7 | white |
| 6496 | 6.0 | 0.21 | 0.38 | 0.8 | 0.020 | 22.0 | 98.0 | 0.98941 | 3.26 | 0.32 | 11.8 | 6 | white |
6497 rows × 13 columns
# Manipulate the dataset to simulate small and large numbers
wine_df["fixed acidity"] = wine_df["fixed acidity"] * 1e6
wine_df["volatile acidity"] = wine_df["volatile acidity"] / 1e6
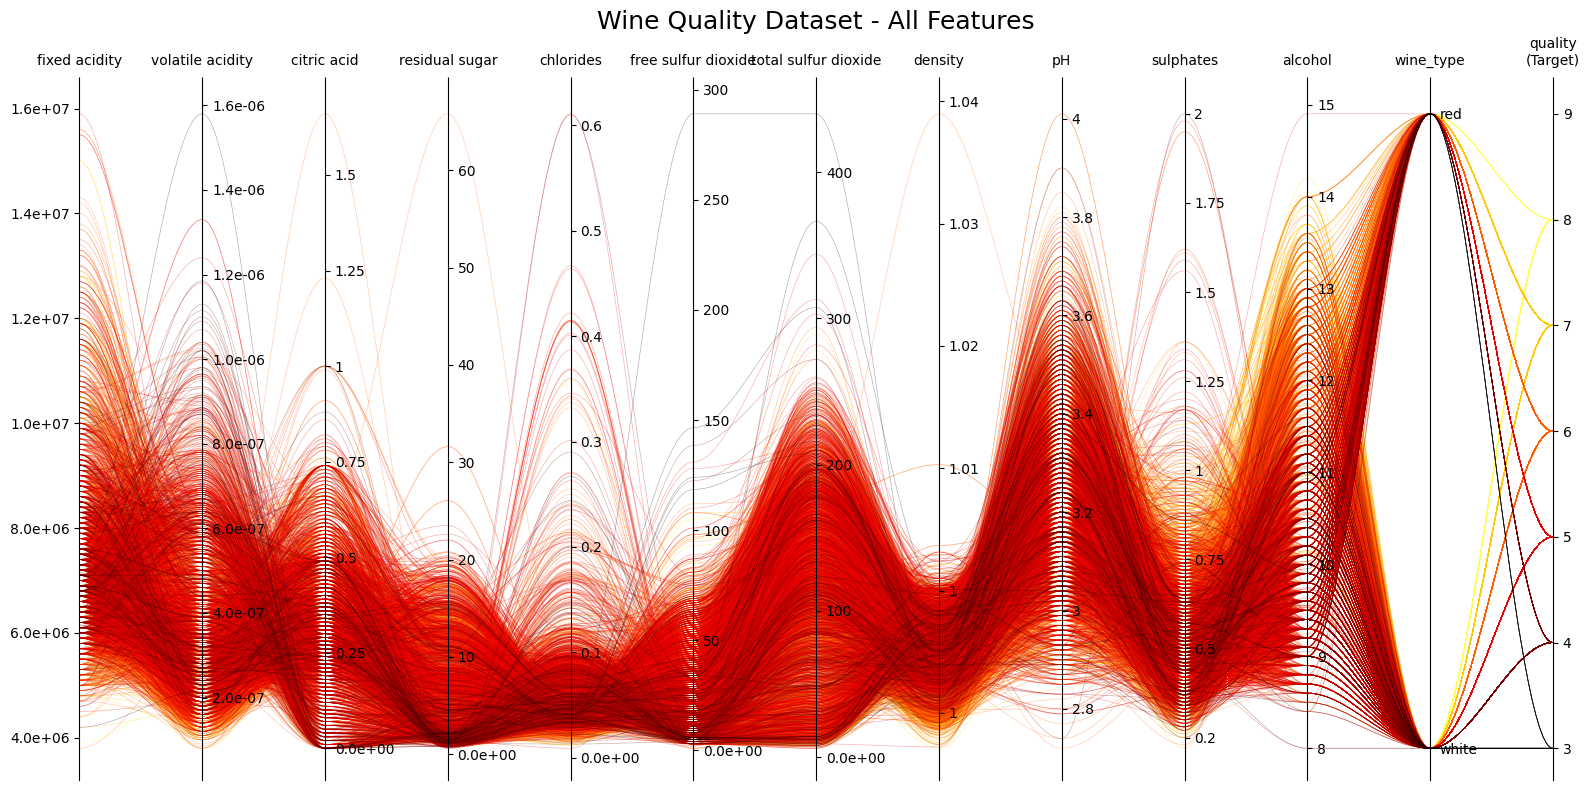
Create the plots from the imported data!
# Example 1: Basic parallel plot with default style
fig1, axes1 = pp.plot(
    df=wine_df,
    target_column='quality',
    title="Wine Quality Dataset - All Features",
    figsize=(16, 8),
    tick_label_size=10,
    alpha=0.3,
    cmap=cm.hot,
    order='max',
    lw=0.5,

)
plt.show()
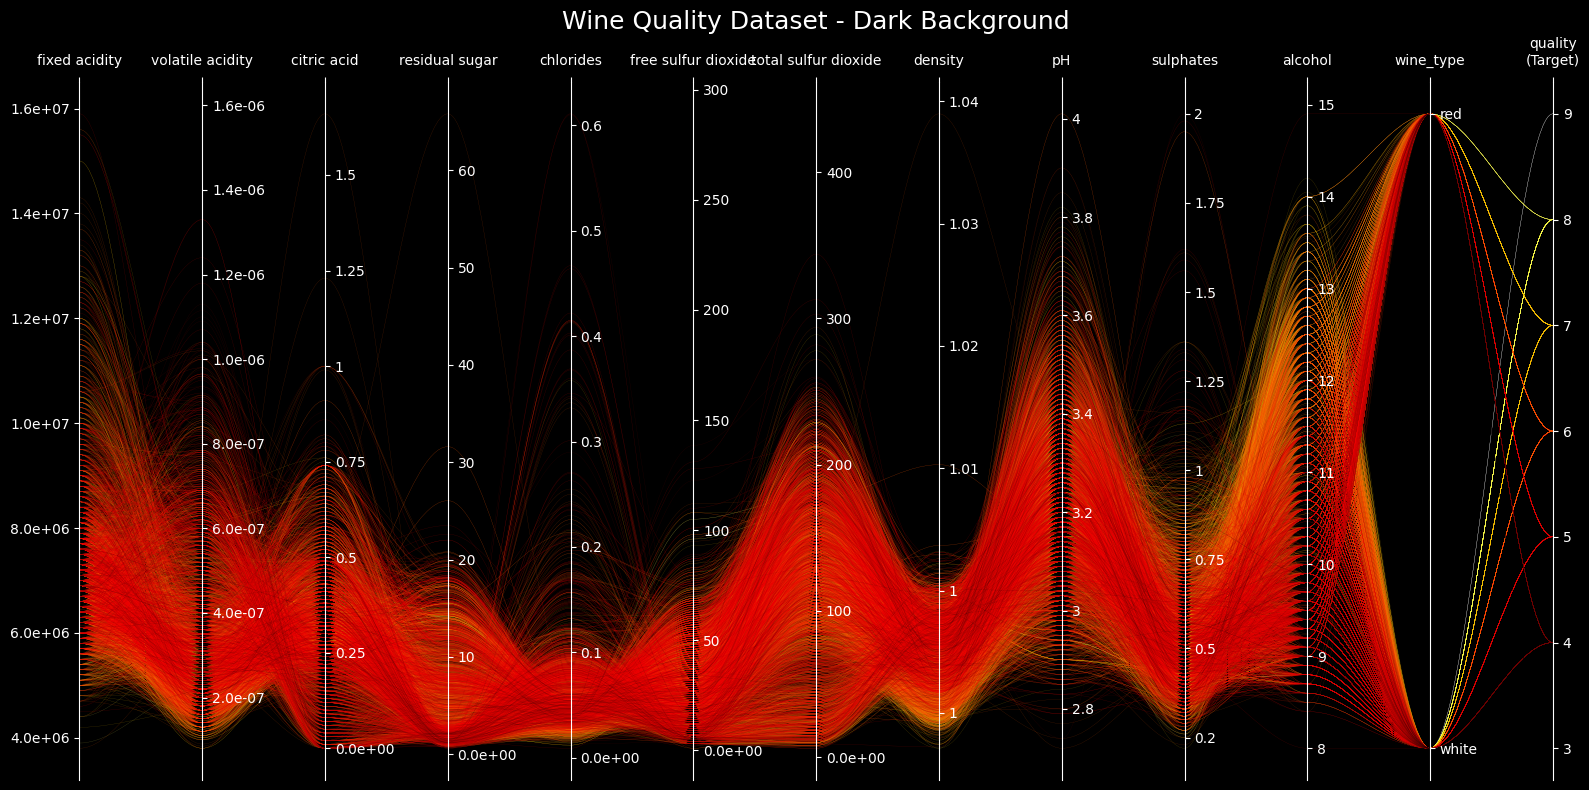
# Example 2: Parallel plot with dark background
fig2, axes2 = pp.plot(
    df=wine_df,
    target_column='quality',
    title="Wine Quality Dataset - Dark Background",
    figsize=(16, 8),
    style="dark_background",
    lw=0.2,
    # axes_to_reverse = [0, 1, 2, 5]
)
plt.show()
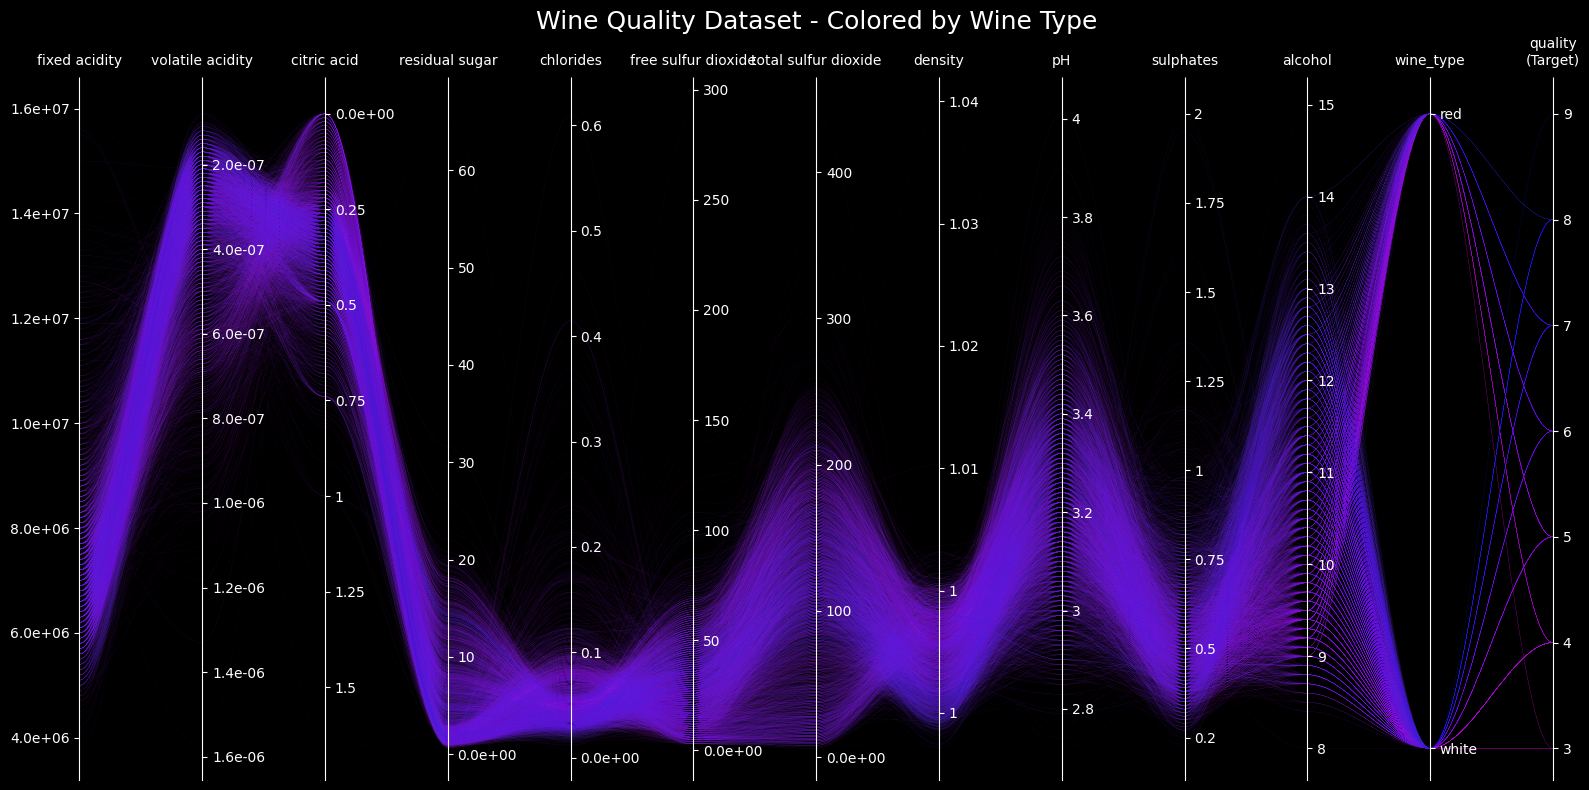
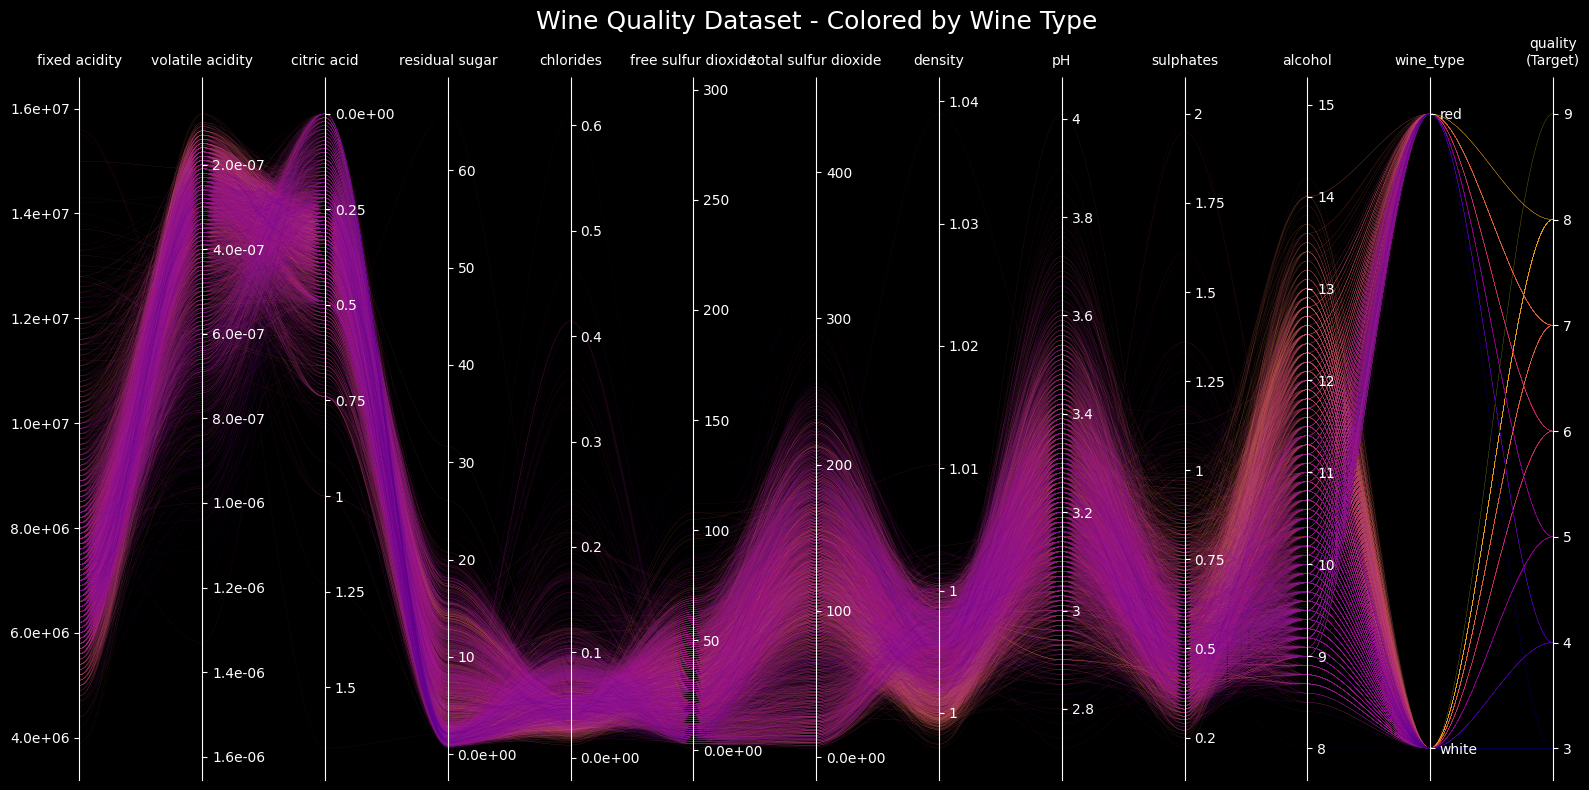
# Example 3: Different cmap
fig3, axes3 = pp.plot(
    df=wine_df,
    target_column='quality',
    title="Wine Quality Dataset - Colored by Wine Type",
    figsize=(16, 8),
    cmap=purple_blue,
    style="dark_background",
    lw=0.1,
    order='min',
    alpha = 0.2,
    axes_to_reverse = [1,2]
)
plt.show()
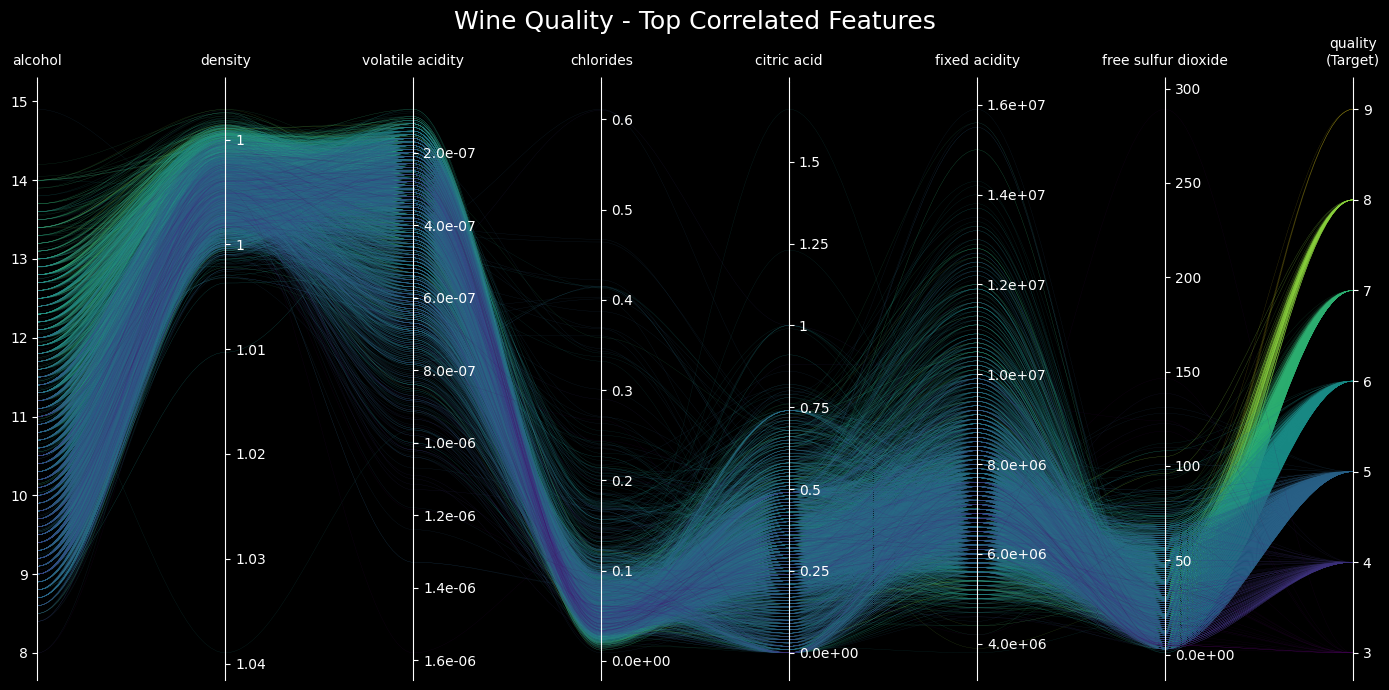
# Example 4: Select top features with highest correlation to quality
# Calculate correlations with quality
corr_with_quality = wine_df.drop(columns=['wine_type']).corr()['quality'].abs().sort_values(ascending=False)
top_features = corr_with_quality.index[:8]  # Top 8 features

# Create subset with only the top features
wine_top_features = wine_df[top_features]

fig4, axes4 = pp.plot(
    df=wine_top_features,
    target_column='quality',
    title="Wine Quality - Top Correlated Features",
    figsize=(14, 7),
    cmap=cm.viridis,
    style="dark_background",
    lw=0.2,
    axes_to_reverse = [1,2]


)
plt.show()
# Example 3: Different cmap
fig3, axes3 = pp.plot(
    df=wine_df,
    target_column='quality',
    title="Wine Quality Dataset - Colored by Wine Type",
    figsize=(16, 8),
    cmap=cm.plasma,
    style="dark_background",
    lw=0.1,
    axes_to_reverse = [1,2]

)
plt.show()
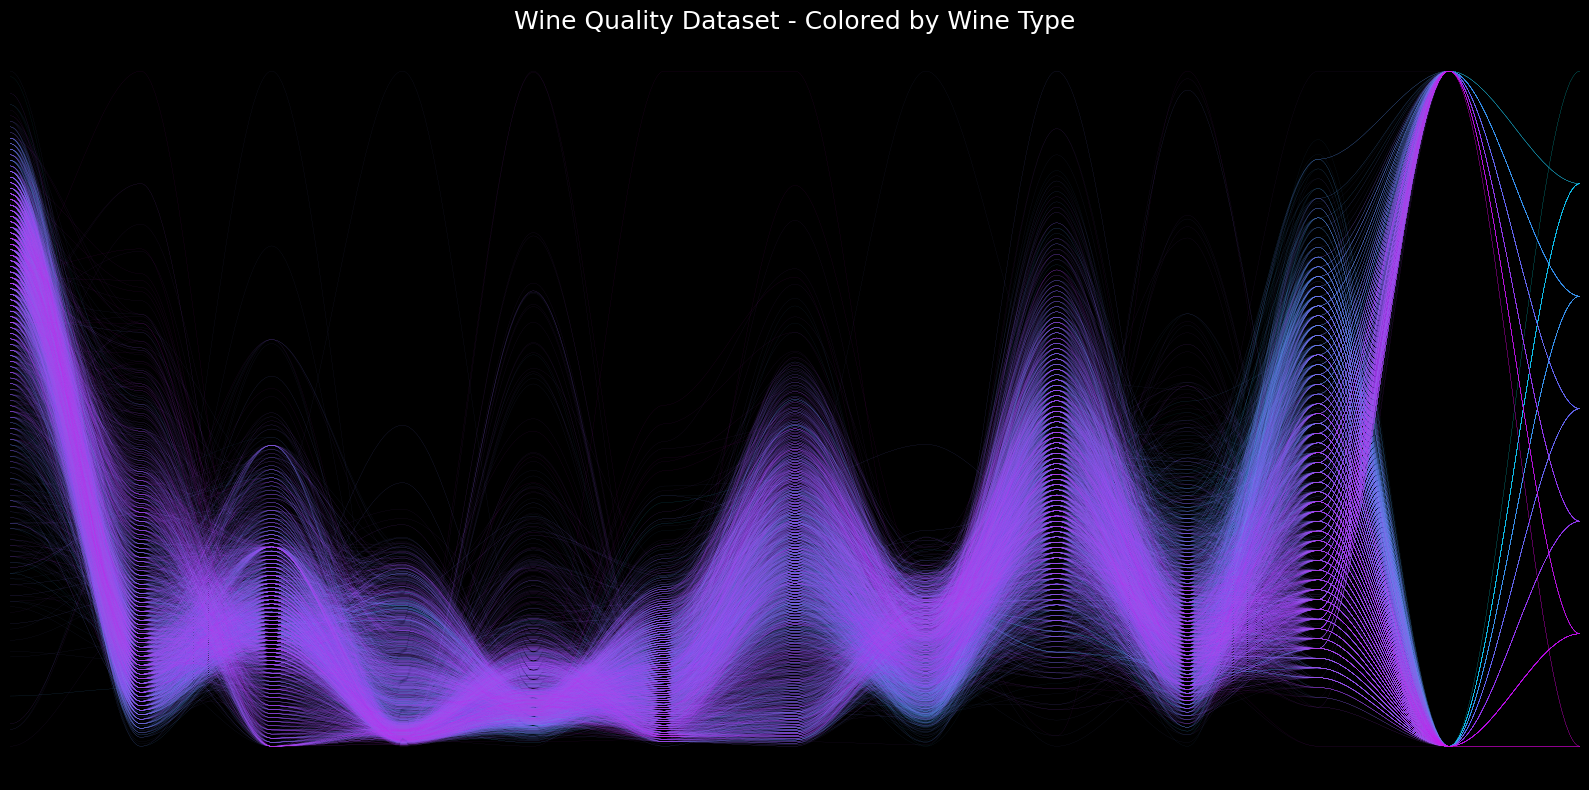
# Example 3: Different cmap and hide all axes
fig3, axes3 = pp.plot(
    df=wine_df,
    target_column='quality',
    title="Wine Quality Dataset - Colored by Wine Type",
    figsize=(16, 8),
    cmap=cm.cool.reversed(),
    style="dark_background",
    lw=0.1,
    # order='random',
    hide_axes=True,
    axes_to_reverse = [0]


)
plt.show()
Release history Release notifications | RSS feed


Download files
Download the file for your platform. If you're not sure which to choose, learn more about installing packages.
Source Distribution
parallelplot-0.6.5.tar.gz
(12.8 kB
view details)
Built Distribution
Filter files by name, interpreter, ABI, and platform.
If you're not sure about the file name format, learn more about wheel file names.
Copy a direct link to the current filters
File details
Details for the file parallelplot-0.6.5.tar.gz.
File metadata
- Download URL: parallelplot-0.6.5.tar.gz
- Upload date:
- Size: 12.8 kB
- Tags: Source
- Uploaded using Trusted Publishing? No
- Uploaded via: twine/6.0.0 CPython/3.12.2
File hashes
| Algorithm | Hash digest | |
|---|---|---|
| SHA256 |
c50d01f5711a7a53e8777da4565ed7a9595a3d5122f4dc74da76883d9ec595a2
|
|
| MD5 |
1e12e991cc6390ed736c403e53d07171
|
|
| BLAKE2b-256 |
b44b392cdf2a263130c40fe4c4a2d792ed2f844e1efe44b77d21f5559c1dd1e9
|
File details
Details for the file parallelplot-0.6.5-py3-none-any.whl.
File metadata
- Download URL: parallelplot-0.6.5-py3-none-any.whl
- Upload date:
- Size: 10.5 kB
- Tags: Python 3
- Uploaded using Trusted Publishing? No
- Uploaded via: twine/6.0.0 CPython/3.12.2
File hashes
| Algorithm | Hash digest | |
|---|---|---|
| SHA256 |
589a4ac9c402a55f20658604d5f0b1411b2ac80a427f3aee89acbd32bc6627ee
|
|
| MD5 |
d1e39c1dc2b514372bfeb013d8c8bad4
|
|
| BLAKE2b-256 |
8756adcd6b8a227670b91cc093daaa25264f7b61322770df9694a64cb0f3ecd5
|


