Hyperparameter search with a single command

Project description
Patas 🐾
Patas is a command line utility designed to execute any program in parallel and collect its output, varying its input parameters and starting the programs automatically. The script may be parallelized on your local machine or in a cluster. The only requirement to run it on a cluster is an SSH connection between the machines. Assuming the programs are located on each worker machine, patas can start and manage the parallel programs with one command. Parsing the outputs is done in a second command. Its name means PArser and TAsk Scheduler. You can install it using pip with the following command.
pip install patas
Basic usage 🐣
Considering the use case that we need to find the optimal configuration for a neural network. In this case we are interested in variating the number of hidden neurons, the activation function, and the complexity of preprocessing we do. We want to execute our prgoram multiple times, combining the values of these two parameters, and collect metrics of interest, like train and test accuracies. We then want to analyse this output and select the best configuration. The following subsections will describe how to achieve this.
The program
We will use a mockup code present in examples/basic_usage. This is a script that pretends to run a neural network, receiving the two variables of interest and printing the desired metrics to stdout. This could easily be replaced by a real program training a neural network, but we use a mockup to speed up the process. To access this program you just need to access the folder.
# Enter the program folder
cd examples/basic_usage

# Example of program execution
./main.py 100 relu
patas explore
Assuming we want to vary the number of hidden neurons from 1 to 51 with steps of 2 and the activation function in ['relu' 'leaky_relu' 'sigmoid' 'tanh'], we can generate all combinationsand parallelize the script above using patas explore grid. This will also collect its entire stdout and save them in the folder pataslab/grid. Each combination will be executed 10 times, as we want to measure the average accuracies later.
patas explore --type grid \
    --cmd './main.py {neurons} {activation} {preprocessing}' \
    --va neurons 1 51 2 \
    --vl preprocessing fast medium intense \
    --vl activation relu leaky_relu sigmoid tanh \
    --node localhost \
    --repeat 10
Here is a short description of the parameters above:
--cmd - defines the command that must be executed. If we define more than one --cmd they will all be executed, one after the other.
--va - defines a variable of type arithmetic, it receives the variable name, an initial value, a maximum value and a step value. It will generate a list similar to the Python's method range.
--vl - defines a variable of type list, it receives the variable name and the list of values it can receive.
--node - defines a node to execute the program. This may be any machine accessible via SSH that won't ask for a password. This command accepts an optional argument to indicate the number of workers in the machine. If non is provided, it will default to the number of cores in the machine. You may want to check the program ssh-copy-id to learn how to install a public key on a remote machine and log in without a password.
--repeat defines the number of times the program will be called using a given variable combination. In this example, the parameter neurons define 25 values, parameter preprocessing defines 3 values and the paramter activation define 4 values. This will generate 300 combinations. Considering the repeat parameter has the value 10, the program will be excuted 3000 timesm. That is, we asked patas to do 3000 tasks. You can define as many variables as you want, but the more you have the longer it will take to execute.
patas parse
When the experiment is done executing, we can parse its outputs and collect the desired values using patas parse.
patas parse \
    -e 'pataslab/grid/' \
    -p train_time  'Time to train \(ms\): (@float@)' \
    -p test_time   'Time to test \(ms\):  (@float@)' \
    -p train_acc   'Train accuracy:     (@float@)' \
    -p test_acc    'Test accuracy:      (@float@)' \
    -p loss        'Final Loss:         (@float@)'
The parameter -e define the experiment folder, containing the prgoram outputs and a few extra info. The parameter -p define a pattern patas is going to look for. It receives a name and a regular expression string. The output file will be saved in pataslab/grid/grid.csv. This contains a table with the input variables, collected results, and extra variables associated to the experiment.
patas query
We use patas query to inspect the contents of the csv file generated above. This command works with any csv file and recognizes the experiment names as table names.
patas query 'select * from grid limit 2' -m
The parameter -m asks patas to print the output in markdown format.
The output for the command above should have a similar structure to the content bellow. The values may vary as the script is non-determininstic.
| in_activation | in_neurons | in_preprocessing | out_train_time | out_test_time | out_train_acc | out_test_acc | out_loss | break_id | task_id | repeat_id | combination_id | experiment_id | experiment_name | tries | max_tries | duration | started_at | ended_at | cluster_name | node_name | cluster_in_lab | node_in_lab | node_in_cluster | worker_in_lab | worker_in_cluster | worker_in_node | output_dir | work_dir |
|---|---|---|---|---|---|---|---|---|---|---|---|---|---|---|---|---|---|---|---|---|---|---|---|---|---|---|---|---|
| relu | 33 | medium | 175.812 | 4.880 | 0.423 | 0.411 | 0.338 | 0 | 1160 | 0 | 116 | 0 | grid | 1 | 3 | 0.224591 | 2023-05-17 19:14:55.472312 | 2023-05-17 19:14:55.696903 | cluster | node0 | 0 | 0 | 0 | 14 | 14 | 14 | /home/diego/Sources/patas/examples/basic_usage/pataslab/grid/1160 | $HOME/Sources/patas/examples/basic_usage |
| leaky_relu | 27 | fast | 190.677 | 6.904 | 0.286 | 0.270 | 0.288 | 0 | 386 | 6 | 38 | 0 | grid | 1 | 3 | 0.225969 | 2023-05-17 19:14:58.327345 | 2023-05-17 19:14:58.553314 | cluster | node0 | 0 | 0 | 0 | 47 | 47 | 47 | /home/diego/Sources/patas/examples/basic_usage/pataslab/grid/386 | $HOME/Sources/patas/examples/basic_usage |
We must remember that for every combination, patas will execute the program --repeat times, passing the same input parameters and collecting multiple output variables. This is useful when the algorithm we are evaluating is non-deterministic and we wish to collect reliable metrics, like our script. To aggregate these values we can calculate the average value using the AVG function with the GROUP BY statement.
patas query '
    SELECT in_activation,
           in_neurons,
           AVG(out_train_acc) AS avg_train_acc,
           AVG(out_test_acc) AS avg_test_acc
    FROM grid GROUP BY in_activation, in_neurons' -m
Similarly, to pick the input parameters that gave us the best average test_accuracy, we could use something like.
patas query '
    WITH avg_result AS (
        SELECT in_activation,
               in_neurons,
               AVG(out_train_acc) AS train_acc,
               AVG(out_test_acc) AS test_acc
        FROM grid
        GROUP BY in_activation, in_neurons
    )
    SELECT * FROM avg_result AS t
    WHERE t.test_acc=(SELECT MAX(test_acc) FROM avg_result)' -m
A possible output for the previous command would be.
| in_activation | in_neurons | train_acc | test_acc |
|---|---|---|---|
| relu | 5 | 0,995… | 0,946… |
patas draw
Patas can also help you quickly create basic graphics based on the data in the csv file. It provides a wrapper for a few seaborn functions to quickly generate graphics, without needing to create a python script for this. If you need complex charts, though, we recommend you use the advanced graphics library of your preference. As of now, patas provides three drawing functions: heatmap, categorical, and lines.
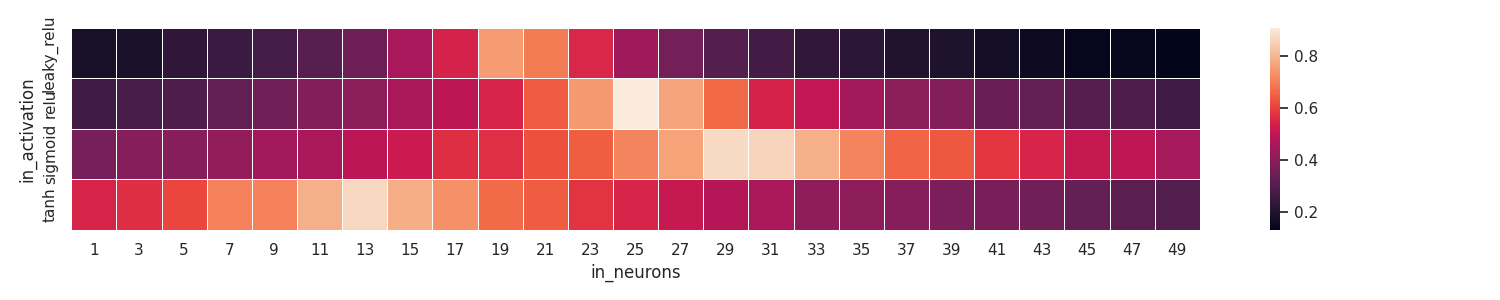
Heatmap
patas draw heatmap \
    --input pataslab/grid/grid.csv \
    --x-column in_neurons \
    --y-column in_activation \
    --z-column out_test_acc \
    --fig-size 15 3
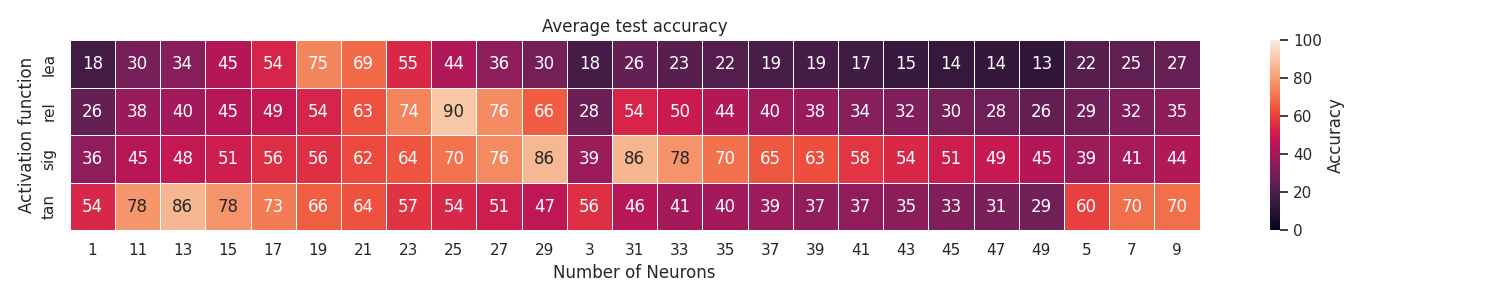
patas draw heatmap \
    --input pataslab/grid/grid.csv \
    --output heatmap.png \
    --title 'Average test accuracy' \
    --x-column in_neurons \
    --x-label 'Number of Neurons' \
    --x-change 'X[i]' \
    --y-column in_activation \
    --y-label 'Activation function' \
    --y-change 'Y[i][:3]' \
    --z-column out_test_acc \
    --z-label 'Accuracy' \
    --z-change 'int(Z[i]*100)' \
    --fig-size 15 3 \
    --annot \
    --aggfunc mean \
    --fmt '.0f'
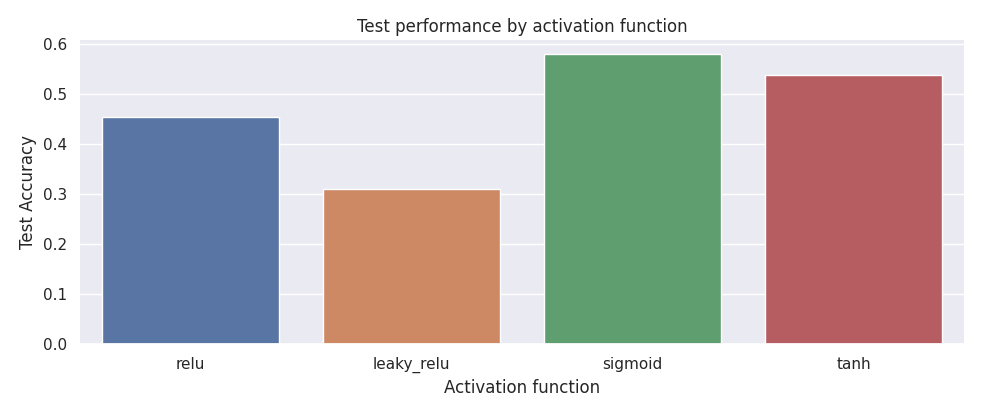
Categorical
patas draw categories \
    --input pataslab/grid/grid.csv \
    --x-column in_activation \
    --y-column out_test_acc \
    --fig-size 10 7 \
    --x-label 'Activation function' \
    --y-label 'Test Accuracy' \
    --title 'Test performance by activation function'
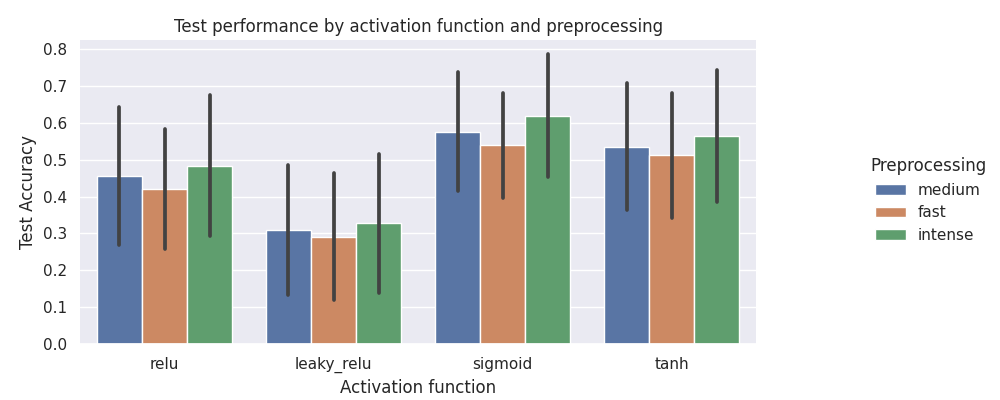
patas draw categories \
    --input pataslab/grid/grid.csv \
    --x-column in_activation \
    --hue-column in_preprocessing \
    --y-column out_test_acc \
    --fig-size 10 4 \
    --x-label 'Activation function' \
    --y-label 'Test Accuracy' \
    --legend-label 'Preprocessing' \
    --errorbar 'sd' \
    --title 'Test performance by activation function and preprocessing'
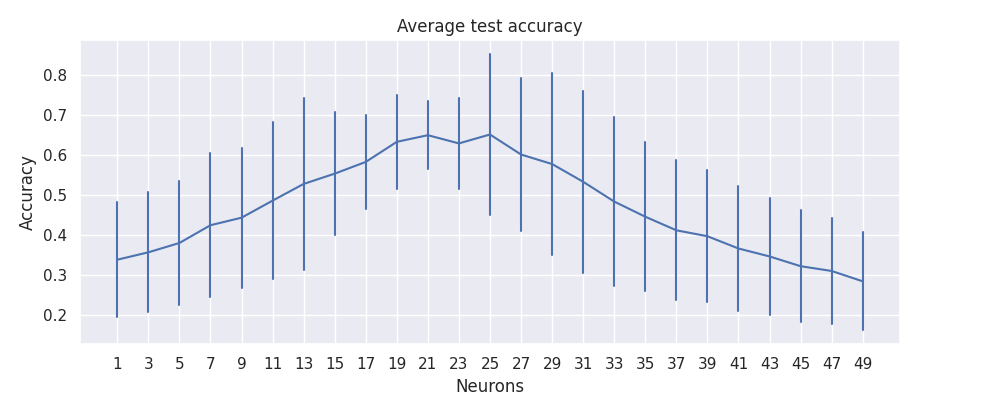
Lines
patas draw lines \
    --input 'pataslab/grid/grid.csv' \
    --fig-size 10 4 \
    --x-column 'in_neurons' \
    --x-label 'Neurons' \
    --y-column 'out_test_acc' \
    --y-label 'Accuracy' \
    --title 'Average test accuracy' \
    --err-style 'bars' \
    --errorbar 'sd'
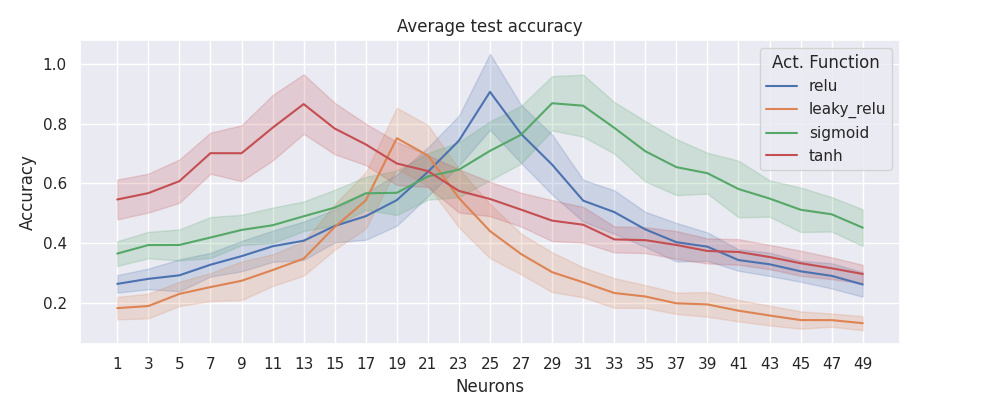
patas draw lines \
    --input 'pataslab/grid/grid.csv' \
    --fig-size 10 4 \
    --x-column 'in_neurons' \
    --x-label 'Neurons' \
    --y-column 'out_test_acc' \
    --y-label 'Accuracy' \
    --hue-column 'in_activation' \
    --title 'Average test accuracy' \
    --legend-label 'Act. Function' \
    --err-style 'band' \
    --errorbar 'sd'
Documentation 📚
When should I use Patas? ⭐
Use this program if you want to evaluate your model against multiple parameters and measure your own performance metrics. It is a quick way to parallelize an experiment over various machines. It is also handy when you don't want to, or can't, change the original program.
When should I not use Patas? 🚧
Patas is designed to be a simple command line utility. It will not manage and constrain resource usage, like limiting the amount of RAM, cores, or disk used by the process. The only control available is the number of workers in each machine, representing how many processes we want to execute in the given machine. The reason for this is that when we constrain the process with a given amount of resources, like RAM, it's possible that a process will run out of memory, and the entire system has plenty of it available. The workaround is to estimate the number of workers based on how many resources your program needs. If a machine crashes, its ok, you can stop and execute patas again. It will skip completed tasks and continue from where it stopped.
Concepts
Sub commands
-
patas explore- command to execute programs in parallel and collect their stouts. It will combine multiple variables and use each combination as input parameter. -
patas parse- used to parse the programs stout and consolidate them in a single csv file. It uses regular expressions to locate the metrics that must be collected. -
patas query- apply sql queries directly into the generated csv files. -
patas draw- convert your csv files to graphics for quick visualization.
Internal concepts
-
Experiment- represents an execution and the stdout generated. Its configuration parameters include mainly the command lines to be executed and input variables. -
Command- the command line that paths will use to start the application. It contains variable fields that will be replaced by variable values by patas. -
Combination- represents one possible combination of input variables. If you define two variables, each with 5 possible values, you will end with 25 combinations. -
Task- represents a single program execution. If you have 25 combinations and the experiment is configured to repeat each of them 10 times, the number of tasks in the experiment is 250. -
Node- a machine that will run the experiment, hosting the number of workers selected for it. -
Cluster- a set of nodes. May contain special tags that will allow us to filter them during an experiment. -
Scheduler- an internal object responsible for orchestrating the tasks and associating them to a worker. -
Worker- represents the maximum number of parallel processes that may run at once in a node. A node may have one or more workers running in parallel. -
Variable- an input parameter for the program. This is typically a list of values that will be combined with other variables and defines the number of tasks that will be created. -
Pattern- a regex containing a single group that will capture an output variable, i.e., a metric.
Source Code 🎼
The source code is available in the project's repository.


Download files
Download the file for your platform. If you're not sure which to choose, learn more about installing packages.
Source Distribution
Built Distribution
Filter files by name, interpreter, ABI, and platform.
If you're not sure about the file name format, learn more about wheel file names.
Copy a direct link to the current filters
File details
Details for the file patas-2.0.6.tar.gz.
File metadata
- Download URL: patas-2.0.6.tar.gz
- Upload date:
- Size: 35.8 kB
- Tags: Source
- Uploaded using Trusted Publishing? No
- Uploaded via: twine/4.0.2 CPython/3.10.6
File hashes
| Algorithm | Hash digest | |
|---|---|---|
| SHA256 |
cab32c1e9bd58d89dcd2bd6cd52e1e7a1469124b4088d4bbe4404672a5692d2f
|
|
| MD5 |
f359ae065b4135fc3663765032dd6cdf
|
|
| BLAKE2b-256 |
ea6e5162f909e992e88d790bed2b087ba9fec13d76641a2373da9ed8c9ae641a
|
File details
Details for the file patas-2.0.6-py3-none-any.whl.
File metadata
- Download URL: patas-2.0.6-py3-none-any.whl
- Upload date:
- Size: 48.6 kB
- Tags: Python 3
- Uploaded using Trusted Publishing? No
- Uploaded via: twine/4.0.2 CPython/3.10.6
File hashes
| Algorithm | Hash digest | |
|---|---|---|
| SHA256 |
3603f8d6a09c5ba40a5ac2e40bc99add2bae430232c59f26b68a4914fd8e2b6f
|
|
| MD5 |
1efa6714539109800040200813b6bec5
|
|
| BLAKE2b-256 |
b3c229a55b982709f470362dcaf3942a6e8e471e3ad5a8226e672c58e39fb191
|


