Quantile-based pavement plots for matplotlib, Bokeh, Plotly, HoloViews, and dependency-free SVG.
Verified details
These details have been verified by PyPIProject links
GitHub Statistics
Maintainers

Project description
Pavement plots


A pavement plot visualizes univariate data as boxes stretching from min to max, each holding an equal share of the data. Where the data is denser, lines are denser, making visual interpretation intuitive. It's a quantile plot you can take in at a glance: a cousin of box plots and rug plots, with no assumption of central tendency, and better suited to large data sets.
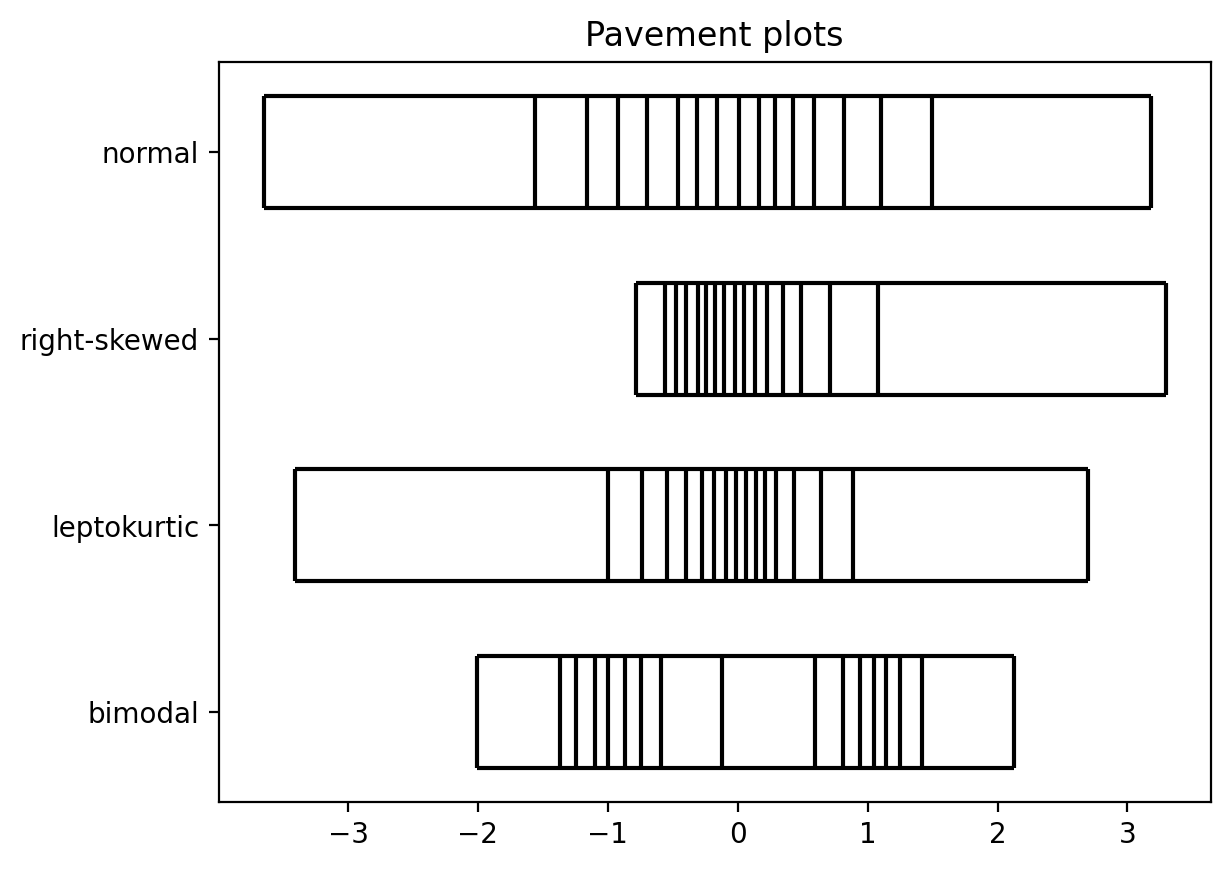
Four classic shapes, each as a 16-bin pavement. The tight cluster of lines is where the data piles up; the wide boxes are the sparse tails — two humps for the bimodal set, a heavy peak for the leptokurtic one, a long tail for the skewed one.
One API, many canvases. Pick a backend by importing its submodule:
- Static images
- matplotlib — also supports marginal strips and 2D pavements
- Interactive visualizations, with hover info built in
- Bokeh, Plotly, HoloViews (including marginal helpers)
pavement.svg— dependency-free inline<svg>sparklines for the web
import pavement.matplotlib as pavement   # or .bokeh / .plotly / .holoviews
pavement.plot([1, 2, 3, 4, 5])

import pavement.svg                      # sparklines for HTML: svg has spark, not plot
pavement.svg.spark([1, 2, 3, 4, 5])     # an <svg>...</svg> string
Glance at a whole dataframe
pavement.summary(df) turns a pandas or polars dataframe (or Series,
or plain sequence) into an inline table. Each variable is shown with a
tally plot (how much is distinct / duplicate / missing) and a
distribution plot that adapts to the column: a pavement spark for
numbers, dates, and durations, and a proportion strip for
categories. It needs no plotting dependency and renders inline in a
notebook; in a browser its rows are drag-to-reorder by default — the
one sprinkle of JavaScript, which stays out of notebooks and static
exports (and is off with draggable=False).
import pavement
pavement.summary(df)        # renders inline in a Jupyter cell
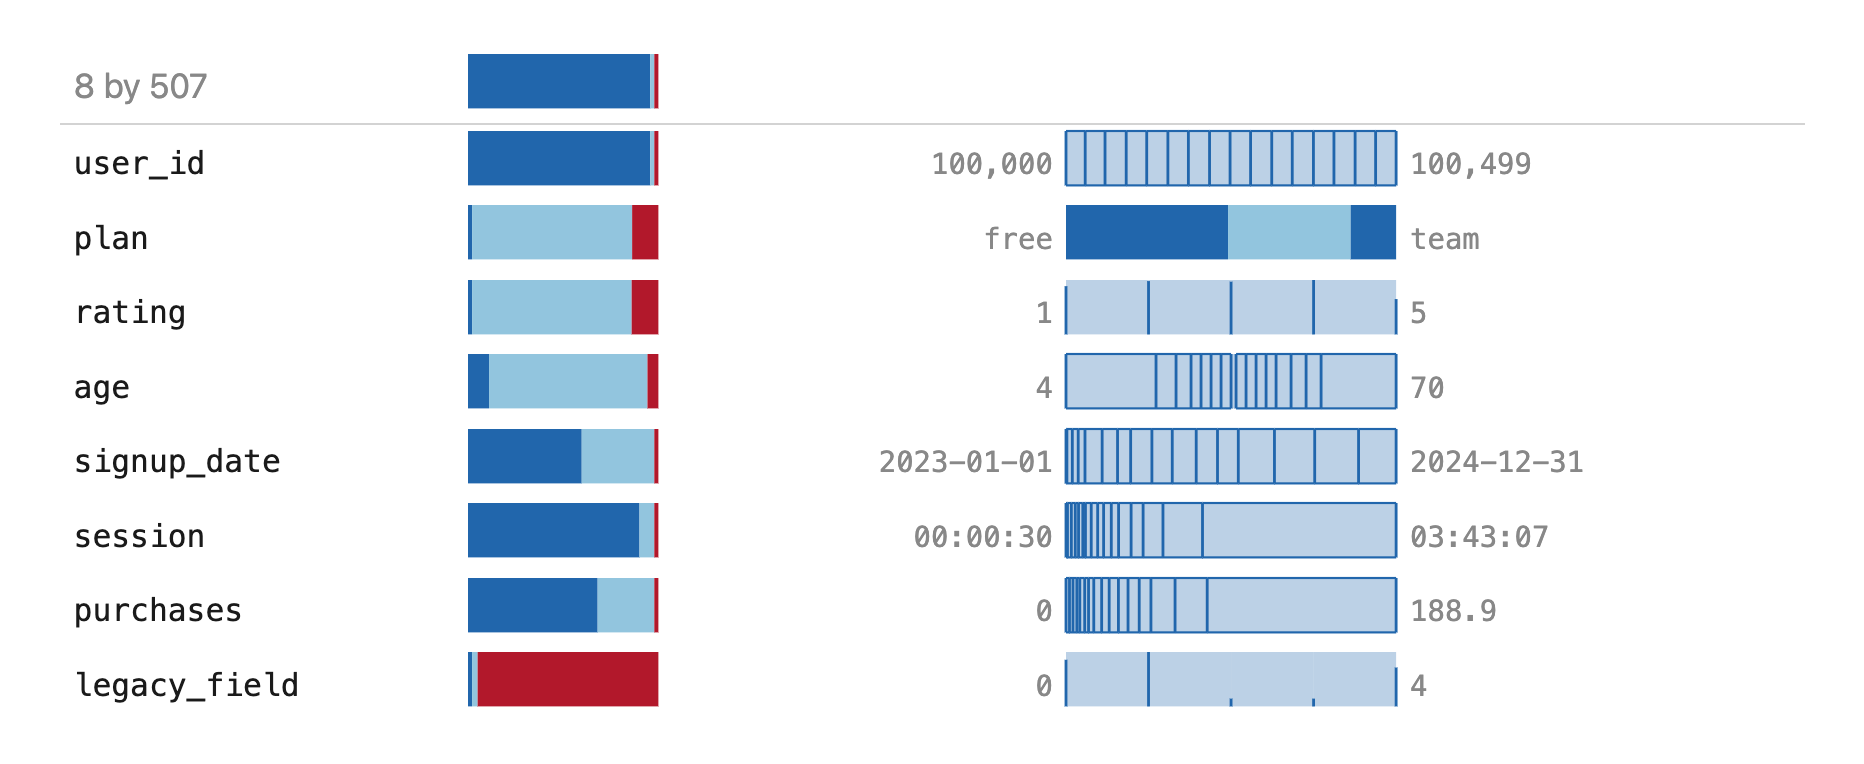
Every column kind at once: an all-distinct id, a category (plan), a discrete
rating drawn as a frequency rug, a continuous age, a date on a time axis, a
duration, a long-tailed purchases, and an almost-all-missing legacy_field.
The top row summarizes the frame itself.
See examples/ for lots more, including
svg_demo.py (inline sparklines),
interactive_demo.py (Plotly, Bokeh, HoloViews),
pandas_polars_demo.py (the .pave accessor),
and real_data.ipynb (singer heights, US income).
Install
pip install pavement
You can install your backend of choice separately, or explicitly pip install pavement[matplotlib] (or bokeh, plotly, holoviews).
Usage
Pick a backend by importing its submodule. Every backend exposes the same
plot, so the import line is the only thing you change to switch:
import pavement.matplotlib as pavement   # or .bokeh / .plotly / .holoviews
pavement.plot([1, 2, 3, 4, 5])
plot accepts the same three input shapes on every backend — a single dataset,
a wide list of datasets, or tidy data plus categories — along with bins (use
bins=None for a rug), weights, positions, widths, labels, and
orientation. It returns that framework's native object (matplotlib artists, a
bokeh.plotting.figure, a plotly.graph_objects.Figure, or a HoloViews
element), so the result drops straight into the rest of your workflow.
A rug (bins=None) drops the two long box edges by default, leaving just the
value ticks — so it reads like an ordinary rug plot, and the presence of the box
is a quick visual cue that you're looking at quantiles rather than raw points.
Pass show_box=True to keep the box on a rug (or show_box=False to drop it
from a binned plot); it is resolved per row, so a mixed bins sequence gets the
right default for each.
The backend-agnostic statistics live at the top level, with no plotting dependency of their own:
import pavement
pavement.pavement_stats([1, 2, 3, 4, 5], bins=4)   # quantile cut points
pavement.quantiles([1, 2, 3, 4, 5], [0.25, 0.5, 0.75])
Missing values (NaN, None, pandas NA/NaT) are dropped before the
quantiles are computed, so they can't skew the cut points. The column summaries
behind summary are here too: pavement.tally_stats (a column's distinct /
repeated / missing make-up) and pavement.proportion_stats (value counts, like
pandas value_counts).
matplotlib (pavement.matplotlib)
The static backend draws pavements as matplotlib artists on an Axes:
import pavement.matplotlib as pavement
pavement.plot([1, 2, 3, 4, 5])
It also has three things specific to matplotlib: plot2d for 2D pavements (a
grid where every cell holds an equal share of the data), margin for a single
marginal strip — a richer drop-in for a rug plot — placed just inside or outside
any edge of an existing plot, and spark for a borderless, word-sized image
that drops inline into text:
pavement.spark(values, path="spark.png") #  in your prose
Inline sparklines (pavement.svg)
For sparklines on the web, pavement.svg emits a self-contained <svg> string
you can drop straight into HTML — no plotting library, no JavaScript, no image
files. It has no dependencies, so it ships with the base install.
import pavement.svg as pavement
html = pavement.spark([1, 2, 3, 4, 5])      # an <svg>...</svg> string
The result is built for running text. Lines default to currentColor, so a
spark inherits the surrounding font color (dark mode included), and it scales
with the text (height: 1em by default) while staying crisp at any size. Every
equal-mass bin is a hover target carrying its quantile band and value range as a
native <title> tooltip — the same hover the Bokeh and Plotly backends show —
with a CSS :hover highlight, all without a line of JavaScript. The bin or value
line under the cursor also highlights, so the interactivity is discoverable. A
bins=None rug makes each value hoverable when there are few of them — along
with the spaces between them, so a wide gap is as easy to hover as a value line
is hard to hit — or shows a single whole-spark summary when there are many
(tunable with tick_hover_limit). The tooltip values format through
value_format like the other backends (e.g.
value_format=lambda v: f"${v:,.2f}"). Pass color, orientation, or
path="spark.svg" / path="spark.html" to save.
This is the web counterpart of pavement.matplotlib.spark, which renders the
same idea to a raster image for print.
Alongside spark, pavement.svg has two column-summary strips in the same
borderless form factor: tally, which shows how much of a column is distinct,
duplicate, or missing, and proportion, which shows its value counts (like
pandas value_counts) with a catch-all for a long tail. Both take a column of
any type and return an <svg> string like spark does. See
examples/svg_demo.py.
Dataframe summaries (pavement.summary)
pavement.summary turns a whole dataframe, Series, or sequence into one inline
HTML table — the thing to glance at when data first lands (pictured at the top).
Each column becomes a row pairing its tally (how much is distinct, duplicate,
or missing) with its distribution: a pavement spark for ordered columns —
numbers, decimals, and dates/datetimes (a temporal column is laid out on a time
axis) — and a proportion strip for categorical ones, so every column gets a
distribution view where a pavement alone would leave the categorical rows blank.
A dataframe is topped by a row summarizing the frame itself — its row count and a
tally that treats each whole row as the entity, so "duplicate" means a
duplicated row and "missing" a row that is entirely blank.
import pavement
pavement.summary(df)        # renders inline in a Jupyter cell
The result renders itself in Jupyter (via _repr_html_), so it
appears on its own when it's the last line of a cell. summary
accepts a pandas or polars DataFrame or Series, a plain dict of
columns (no pandas required), or any 1D sequence. A numeric column's
resolution adapts to its number of distinct values — a rug when few,
then 4, 8, or 16 equal-mass bins as it grows — so a small column reads
value-by-value and a large one as a smooth shape. It has no
dependencies; the strips are pure SVG, and the only JavaScript is the
optional drag-to-reorder (a grip handle on each row, off with
draggable=False). str() gives the HTML fragment and
path="summary.html" saves a standalone page. See
examples/summary_demo.py.
Tighter dataframe integration (pavement.pandas, pavement.polars)
For pandas or polars users, importing pavement.pandas (or pavement.polars)
registers a .pave accessor on DataFrame and Series — through each library's
own accessor/namespace API, so it's namespaced and won't clash — putting the
strips a method away:
import pavement.pandas        # registers .pave (or: import pavement.polars)

df.pave()                     # the whole-frame summary, rendered inline
df.pave.summary()             # the same, spelled out
df.pave.spark("price")        # a numeric column's pavement sparkline
df.pave.tally("plan")         # a column's distinct/duplicate/missing strip
df.pave.proportion("plan")    # a column's value-counts strip
df["price"].pave.spark()      # on a Series, the helpers take no column name
The two read identically; pavement.summary(df) itself also accepts a frame from
either library directly. The single-column helpers return the glyph's <svg>
string, but wrapped so it also renders inline in a notebook (it's a str
subclass, so it still embeds and saves like the plain string elsewhere). You can
also make the summary a frame's default notebook display — strictly opt-in, since
it replaces the usual data-table preview:
pavement.pandas.enable_repr()    # every DataFrame/Series previews as a summary
pavement.pandas.disable_repr()   # restore the library's normal display
The integration activates on import pavement.pandas / import pavement.polars
(never on a bare import pavement), in the spirit of import hvplot.pandas, so
the core package stays dependency-free.
Interactive plots (Plotly)
pavement.plotly targets Plotly directly. It builds pavements from plain
plotly.graph_objects traces (no figure-level shapes), so a pavement carries its
own hover and drops into any subplot cell:
import pavement.plotly as pavement
pavement.plot([1, 2, 3, 4, 5]).show()
Every interactive backend formats the values it shows on hover the same way:
pass value_format, a function from a value to its display string, and the hover
renders through it. The one callable works unchanged on Plotly, Bokeh,
HoloViews, and pavement.svg, so lambda v: f"${v:,.2f}" reads 1200.0 as
$1,200.00 everywhere (it defaults to three significant figures). See
examples/value_format_demo.py.
pavement.plot(prices, value_format=lambda v: f"${v:,.2f}").show()
A pavement is a drop-in for a rug plot, including as a marginal: with_marginals
adjoins pavement strips to a scatter — x on top, y on the right — in the spirit
of Plotly's own marginal plots,
keeping them aligned with the scatter and matching its per-category colors:
import plotly.express as px
import pavement.plotly as pavement

df = px.data.iris()
fig = px.scatter(df, x="sepal_width", y="sepal_length", color="species")
pavement.with_marginals(fig, x=df.sepal_width, y=df.sepal_length,
                        categories=df.species).show()
Install with pip install pavement[plotly]. See
examples/interactive_demo.py.
Interactive plots (Bokeh)
pavement.bokeh draws pavements with plain Bokeh glyphs (filled quads for the
bins, segments for the ticks and box edges), so each row carries its own hover
and drops onto any figure:
import pavement.bokeh as pavement
from bokeh.plotting import show

show(pavement.plot([1, 2, 3, 4, 5]))
It returns a plain bokeh.plotting.figure, with a hover tool over the bins and
ticks and a clickable legend for multiple rows. As with the other backends,
with_marginals arranges a scatter with pavement strips — x on top, y on the
right — with their ranges linked to the scatter and matching its per-category
colors:
from bokeh.plotting import figure
import pavement.bokeh as pavement

scatter = figure()
for g in ["A", "B"]:
    scatter.scatter(xs[g], ys[g], color=palette[g], name=g)
show(pavement.with_marginals(scatter, x=xs_all, y=ys_all, categories=groups))
Install with pip install pavement[bokeh]. See
examples/interactive_demo.py.
Interactive plots (HoloViews)
pavement.holoviews builds the same pavement geometry as HoloViews elements, so
one definition renders through any HoloViews backend (bokeh or plotly for
interactivity, matplotlib for a static image). Select the backend with
hv.extension(...) first, as usual:
import holoviews as hv
import pavement.holoviews as pavement

hv.extension("bokeh")
pavement.plot([1, 2, 3, 4, 5])
It returns a plain HoloViews object, so it composes with the framework.
with_marginals adjoins category-split pavement marginals to a scatter in one
call:
pavement.with_marginals(scatter, x=xs, y=ys, categories=groups)
Install with pip install pavement[holoviews] (plus bokeh and/or plotly).
See examples/interactive_demo.py.
Using pavement with Claude
This repo ships a Claude Code plugin that teaches
Claude to use pavement correctly — which backend to import, the three plot
input shapes, and the idioms that are easy to get wrong from memory (bins=None
rugs, the per-row show_box default, value_format).
Add this repo as a plugin marketplace and install it:
/plugin marketplace add ajschumacher/pavement
/plugin install pavement-plots@pavement
Once installed, Claude consults the skill automatically whenever you ask it to make a pavement plot or sparkline. To try it without installing — or when working in a clone of this repo — load it directly for one session:
claude --plugin-dir ./plugins/pavement-plots
The skill itself is plain Markdown at
plugins/pavement-plots/skills/pavement-plots/, so you can read or adapt it
without Claude Code.
Development
pip install -e '.[test]'              # core only
pip install -e '.[test,matplotlib]'   # + matplotlib
pip install -e '.[test,all]'          # + every backend
pytest
The images at the top of this README are regenerated by
examples/readme_assets.py (the summary screenshot
additionally needs pandas and a headless Chrome via selenium).
Project details
Verified details
These details have been verified by PyPIProject links
GitHub Statistics
Maintainers


Download files
Download the file for your platform. If you're not sure which to choose, learn more about installing packages.
Source Distribution
Built Distribution
Filter files by name, interpreter, ABI, and platform.
If you're not sure about the file name format, learn more about wheel file names.
Copy a direct link to the current filters
File details
Details for the file pavement-1.0.2.tar.gz.
File metadata
- Download URL: pavement-1.0.2.tar.gz
- Upload date:
- Size: 8.6 MB
- Tags: Source
- Uploaded using Trusted Publishing? Yes
- Uploaded via: twine/6.1.0 CPython/3.13.12
File hashes
| Algorithm | Hash digest | |
|---|---|---|
| SHA256 |
43d7e5100ecc69f410e0f05185c5c746b18879b48454ccc098457588ac62378f
|
|
| MD5 |
d97292cff7c5f511dbf175c3a334ef84
|
|
| BLAKE2b-256 |
2d9af6a7b0f752f7bff492195ea0d450cf1647a4ed236ad5fd1063a8a881de8e
|
Provenance
The following attestation bundles were made for pavement-1.0.2.tar.gz:
Publisher:
publish.yml on ajschumacher/pavement
-
Statement:
-
Statement type:
https://in-toto.io/Statement/v1 -
Predicate type:
https://docs.pypi.org/attestations/publish/v1 -
Subject name:
pavement-1.0.2.tar.gz -
Subject digest:
43d7e5100ecc69f410e0f05185c5c746b18879b48454ccc098457588ac62378f - Sigstore transparency entry: 1781339971
- Sigstore integration time:
-
Permalink:
ajschumacher/pavement@64167bafab32ca2aece08951f01deacffa0c7289 -
Branch / Tag:
refs/tags/v1.0.2 - Owner: https://github.com/ajschumacher
-
Access:
public
-
Token Issuer:
https://token.actions.githubusercontent.com -
Runner Environment:
github-hosted -
Publication workflow:
publish.yml@64167bafab32ca2aece08951f01deacffa0c7289 -
Trigger Event:
release
-
Statement type:
File details
Details for the file pavement-1.0.2-py3-none-any.whl.
File metadata
- Download URL: pavement-1.0.2-py3-none-any.whl
- Upload date:
- Size: 103.3 kB
- Tags: Python 3
- Uploaded using Trusted Publishing? Yes
- Uploaded via: twine/6.1.0 CPython/3.13.12
File hashes
| Algorithm | Hash digest | |
|---|---|---|
| SHA256 |
f1fe681a04d0c4693f6752ffd3b3cdd2d85975d7623f708ebf05294b92951639
|
|
| MD5 |
08bb26657f44e648d90f96e5f8fc8fe7
|
|
| BLAKE2b-256 |
72e67cb009faf0d269d9cf8fa96bda10111a76d7f870deb7fc636a82fec5497d
|
Provenance
The following attestation bundles were made for pavement-1.0.2-py3-none-any.whl:
Publisher:
publish.yml on ajschumacher/pavement
-
Statement:
-
Statement type:
https://in-toto.io/Statement/v1 -
Predicate type:
https://docs.pypi.org/attestations/publish/v1 -
Subject name:
pavement-1.0.2-py3-none-any.whl -
Subject digest:
f1fe681a04d0c4693f6752ffd3b3cdd2d85975d7623f708ebf05294b92951639 - Sigstore transparency entry: 1781340041
- Sigstore integration time:
-
Permalink:
ajschumacher/pavement@64167bafab32ca2aece08951f01deacffa0c7289 -
Branch / Tag:
refs/tags/v1.0.2 - Owner: https://github.com/ajschumacher
-
Access:
public
-
Token Issuer:
https://token.actions.githubusercontent.com -
Runner Environment:
github-hosted -
Publication workflow:
publish.yml@64167bafab32ca2aece08951f01deacffa0c7289 -
Trigger Event:
release
-
Statement type:


