A program for visualising diffraction data in pdCIF format.

Project description
A program for the visualisation of diffraction data in pdCIF format.
Crystallographic Information Framework (CIF; https://www.iucr.org/resources/cif) files are a way of storing crystallographic information in a standard human- and machine-readable format. This particular program is focussed on visualising powder diffraction data stored in CIF format, and, in particular, serial or in situ/operando data.
Free software: Apache Software License 2.0
Pre-installation
If you are on Windows, you must read this step. If you are on Linux, you can continue.
pdCIFplotter requires PyCifRW == 4.4.3. If you install PyCifRW from PyPI via pip, then you will also need to compile the included C modules. To do so requires Microsoft Visual C++ 14.0 or greater. If you don’t have this installed, or do not wish to install it, precompiled wheel files are available. You must download the wheel file corresponding to your Python installation.
To obtain information about your Python installation, run the command:
python -VV
An example output is Python 3.9.4 (tags/v3.9.4:1f2e308, Apr 6 2021, 13:40:21) [MSC v.1928 64 bit (AMD64)], showing that this is 64 bit Python 3.9.
Using pip version 19.2 or newer, install your downloaded wheel file as:
pip install c:\path\to\file\name_of_file.whl
This should install PyCifRW, and you can move on to the next step. If you encounter any issues in the installation, please lodge an issue.
Installation
To install the release version of pdCIFplotter from PyPI:
pip install pdCIFplotter
You can also install the in-development version from GitHub with:
pip install https://github.com/rowlesmr/pdCIFplotter/archive/master.zip
Quick usage
To run pdCIFplotter as a standalone program:
pdcifplotter
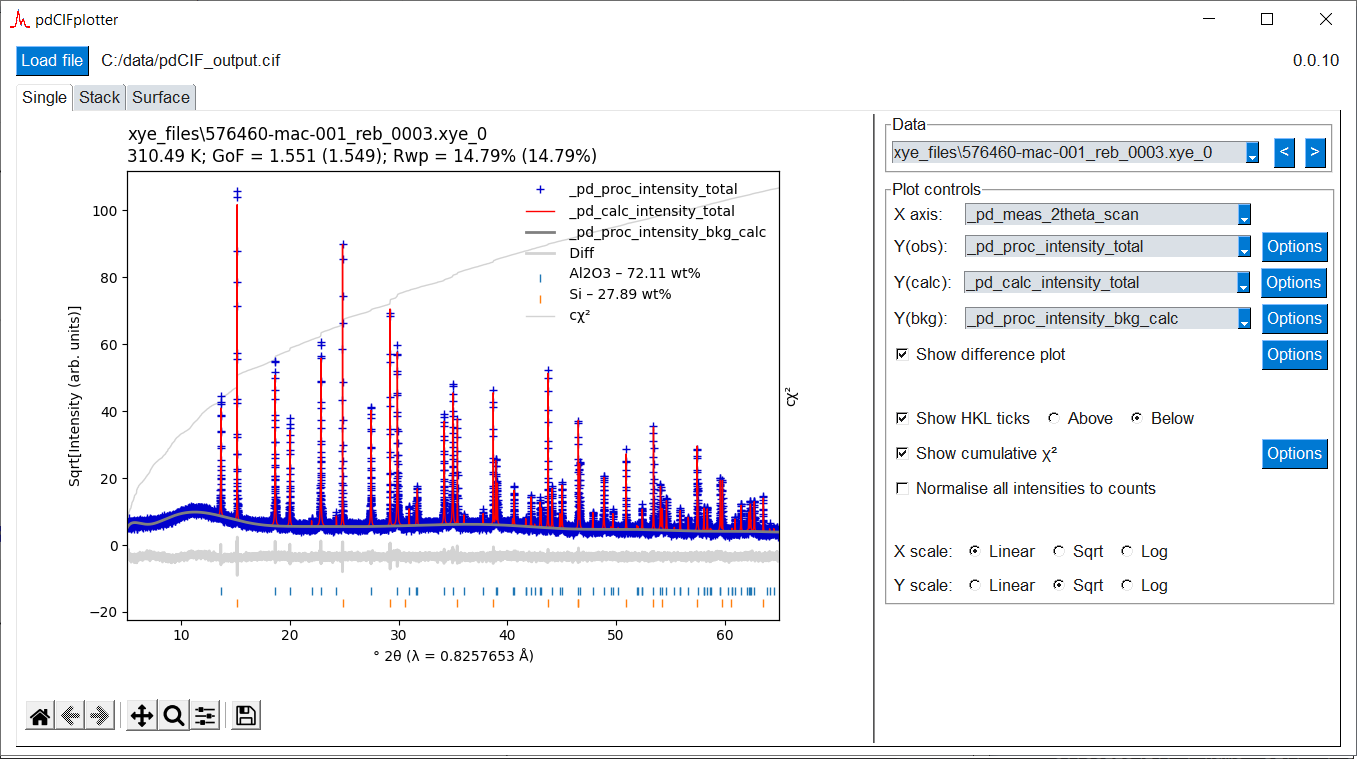
When you first open pdCIFplotter, you are met with an empty window
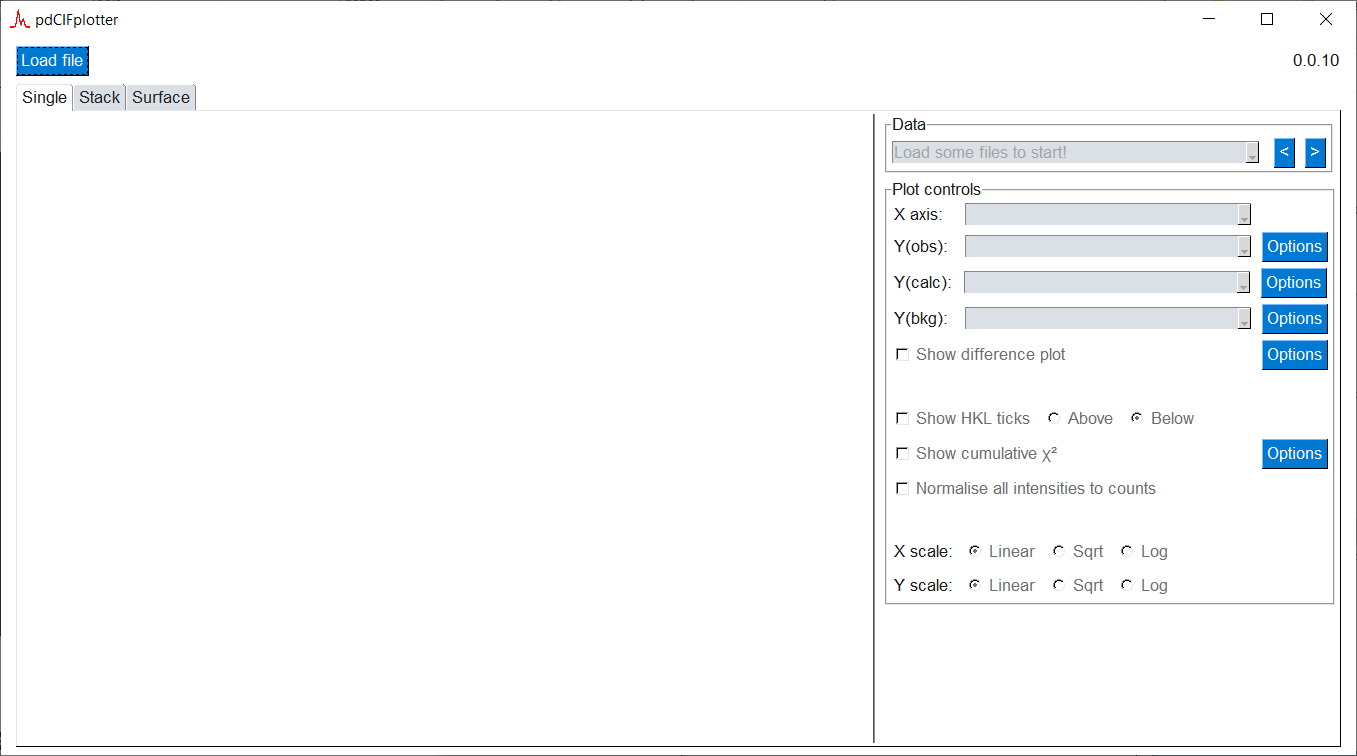
Clicking “Load file”, and choosing a CIF file to open will automatically present you with a single plot. You can then alter how that plot is presented, or visualise all diffraction data in the CIF with the Stack and Surface tabs.
Documentation
Changelog
0.1.3 (2022-09-18)
Adding package to conda-forge
0.1.2 (2022-07-14)
Misc. bug fixes
0.1.1 (2022-06-30)
More features!
Added the ability to alter font details on the plots
Added the ability to alter relative plot widths on the surface plot when showing QPA/temperatures…
0.1.0 (2022-03-14)
Submitting final version of manuscript for publication - feature freeze!
0.0.11 (2022-01-24)
Created a program icon.
Fixed bug in quantitative phase analysis parsing to enable reading of data-only CIFs.
Correctly reads an empty file.
0.0.10 (2021-12-31)
Updated type hints to maintain compatibility with Python <=v3.8.
0.0.9 (2021-12-31)
Single plot - subtitle now shows the datetime, temperature, pressure, Rwp, and GoF, if available in the CIF file. Rwp and GoF is also calculated and displayed in brackets if possible. Gof calculation uses N, and not N-P, so it is only an approximation.
Stack plot - Hovertext now shows the datetime, temperature, pressure, Rwp, and GoF, if available in the CIF file.
Surface plot - Can now plot temperature, pressure, quantitative phase analysis (QPA), Rwp, and GoF (if available in the CIF file) next to the surface plot. QPA phases are linked together by their _pd_phase_name, so it is important that the same string is used to denote the same phases in different patterns.
0.0.8 (2021-12-20)
Updated some of the zoom behaviour
Can now use arrow buttons to move between consecutive diffraction patterns in the single plot
0.0.7 (2021-12-18)
Zoom persists in single plots when changing between diffraction patterns or altering the view in some way.
0.0.6 (2021-12-09)
Can normalise intensities to counts from provided weights or errors; possible in single, stack, and surface
hkl ticks labelled by phase name, if present, else, phase id: now including surface plot.
(ongoing) Refactoring of plot_cif
0.0.5 (2021-11-16)
Better hkl checkbox checking
Doesn’t crash if CIF with no diffraction pattern is loaded
Gracefully handles NANs in data when calculating hkl tick offsets
Datablock names replaced with block_id values on single plot title and dropdown data box
hkl ticks labelled by phase name, if present, else, phase id.
Large refactoring of parse_cif
0.0.4 (2021-11-11)
Added hkl ticks to stack plot
Enabled hkl ticks to be plotted above the diffraction patterns
0.0.3 (2021-11-10)
Separated GUI and plotting code
Fixed crash on changing to surface tab before opening CIF
0.0.2 (2021-11-07)
Update install requirements - mplcursors 0.5 is now available, rather than installing from git.
Can now launch from command line with just > pdcifplotter
0.0.1 (2021-11-06)
Update install requirements and provided prompting to user on installing packages not available on PyPi.
0.0.0 (2021-11-05)
First release on PyPI.
Release history Release notifications | RSS feed


Download files
Download the file for your platform. If you're not sure which to choose, learn more about installing packages.
Source Distribution
Built Distribution
Filter files by name, interpreter, ABI, and platform.
If you're not sure about the file name format, learn more about wheel file names.
Copy a direct link to the current filters
File details
Details for the file pdcifplotter-0.1.4.tar.gz.
File metadata
- Download URL: pdcifplotter-0.1.4.tar.gz
- Upload date:
- Size: 523.8 kB
- Tags: Source
- Uploaded using Trusted Publishing? No
- Uploaded via: twine/6.1.0 CPython/3.13.2
File hashes
| Algorithm | Hash digest | |
|---|---|---|
| SHA256 |
1b82a47fd0047bd6aef1f8af64bad922ec85f1b84b89bacabe05eb0f63319a86
|
|
| MD5 |
f52637f4b1470cc6eec25149b5c96d0c
|
|
| BLAKE2b-256 |
4ab206b54e7a4207ef46f76102d6443b17ed3872fdaf2efdddbd8e9d49504147
|
File details
Details for the file pdcifplotter-0.1.4-py2.py3-none-any.whl.
File metadata
- Download URL: pdcifplotter-0.1.4-py2.py3-none-any.whl
- Upload date:
- Size: 56.4 kB
- Tags: Python 2, Python 3
- Uploaded using Trusted Publishing? No
- Uploaded via: twine/6.1.0 CPython/3.13.2
File hashes
| Algorithm | Hash digest | |
|---|---|---|
| SHA256 |
dd89add08a4c921e4e26de41b44f478b2e7dc30d966915d080ac97f855f2bd95
|
|
| MD5 |
dd9be64dde620101b1032344b1159e77
|
|
| BLAKE2b-256 |
2826da5c75d3a9db16b2e688c34aea06938143b614d5af08e9767247e0d138f9
|


