peaky fits a single peak to a lorentian, gaussian or voigt profile

Project description
The package peaky allows the user to fit a single peak to a Gaussian, Lorentian or Voigt profile.
Basic Example
Here is a basic way to fit your data to a Voigt profile:
import peaky
peaky.fit_voigt(x, y)
here x and y are respectively the independent and dependent variable. The data should contain a single peak, not larger then the data set.
If instead you would like to specifically fit the data to a gaussian or a lorentian profile, use one of these two functions instead:
peaky.fit_gaussian(x, y)
peaky.fit_lorentian(x, y)
Parameters
These are all other parameters of the fit_voigt function:
-
background It sets the order of the polynomial to helps the fit adapt to a possible background signal. A value of 0 means constant background, a value of 1 means linear background etc. If None is provided, no background is added. The dafault value is 1.
-
a It sets the amplitude of the voigt peak to the value provided. In this context, amplitude means literally the amplitude of the signal at peak position. If None is provided (as by default) the best amplitude is found by the fit.
-
p It sets the peak position to the value provided. If None is provided (as by default) the best peak position is found by the fit.
-
g It sets the voigt gaussian width to the value provided. If None is provided (as by default) the best gaussian width is found by the fit.
-
l It sets the voigt lorentian width to the value provided. If None is provided (as by default) the best lorentian width is found by the fit.
-
peak_ratio This parameters helps the process find the best initial values for the fit. For example, a value of 0.3 means then the peak occupies roughly 1 / 3 of the data set width (estimated by eye). If a lower value is provided, the noise may ruin the peak detection, while a higher value may average away the signal.
-
log When
True(as by default), all measured parameters are printed directly on terminal together with their error bars and guessed initial values. A color coded fit signal to noise ratio may help decide if a fit is reliable. Red means unreliable, orange means not optimal, while green means reliable.
Output
These are the outputs of the fit functions:
-
fit The optimal values of the fit parameters in this order: amplitude, peak position, gaussian and lorentian width and the full width at half maximum (fwhm). To these, it follows the list of polynomial coefficients used for the background signal from lower to higher order. Note that each background coefficient (being very small for higher orders) is multiplied by the n ** i where n is the length of the signal and i the order of the coefficient.
-
err The error correspondent to each parameters obtained from the fit.
-
snr The fit signal to noise measured as the ratio between the signal amplitude (obtained from fit) and the fit data noise (signal - fit standard deviation). This parameter may help decide whatever or not a fit is reliable.
-
fit functions A list of three functions: the first corresponding to the overall fitted signal, the second only to the Voigt component (without background) and the third to the background signal alone.
-
fit data The correspondent data values (three lists) correspondent to the three previous functions evaluated in x, which could be easily used in a plot.
Gaussian and Lorentian Fit
Note that the fit_gaussian function is equivalent to fit_voigt with the Lorentzian width parameter l fixed to 0, while fit_lorentian is equivalent to the fit_voigt with Gaussian width parameter g fixed to 0.
Example
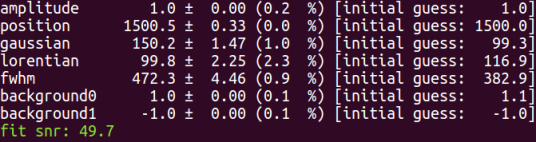
Here is the plot of a simulated data set (a = 1, p = 1500, g = 150, l = 100 with linear background) and of the correspondent fit performed by peaky:
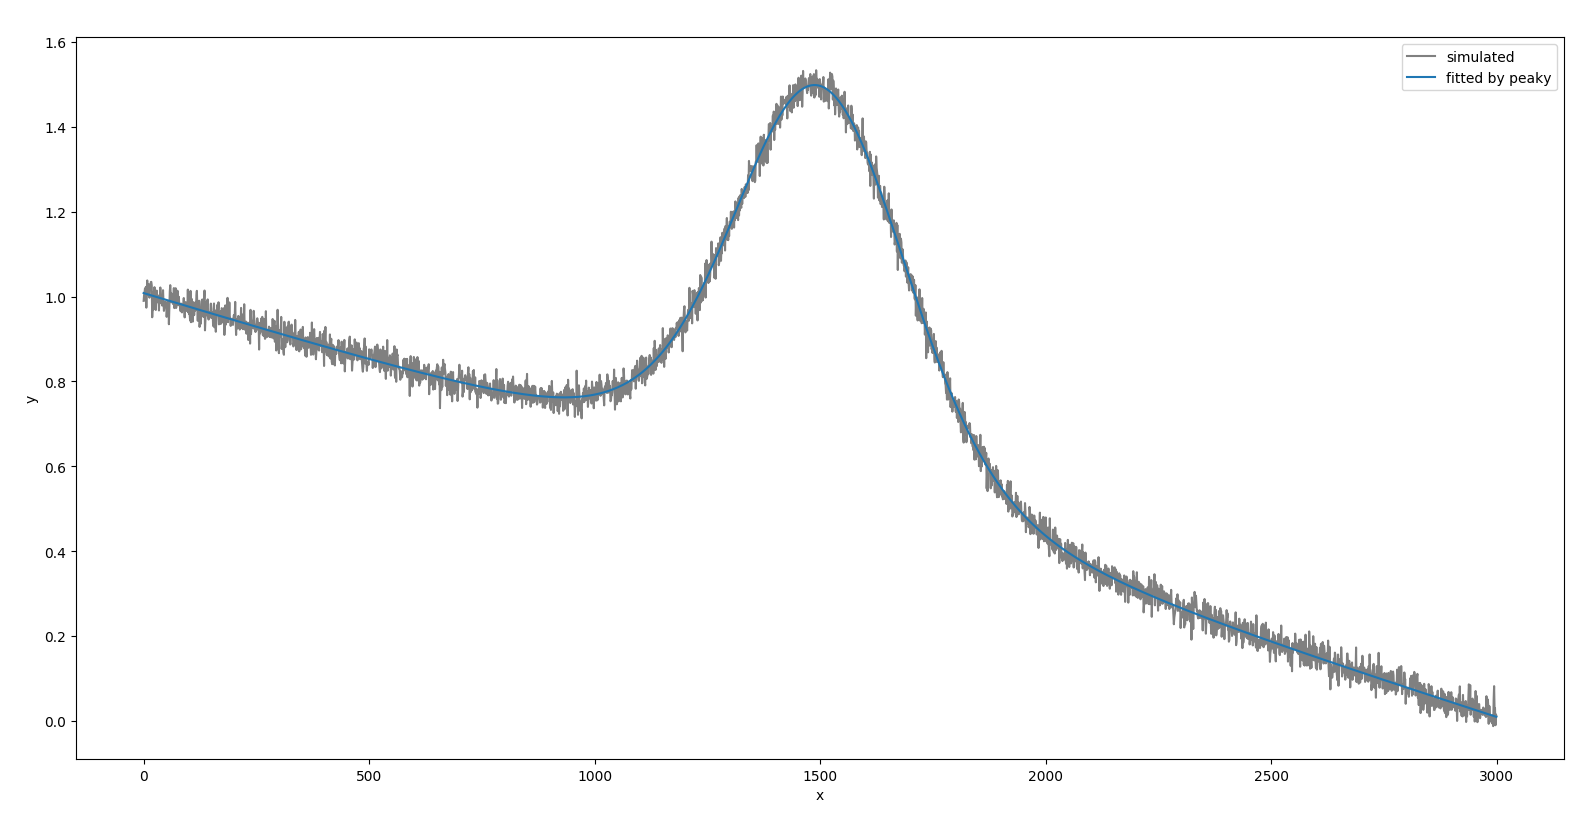
And here is the printed output:
Test
You can run a simple test of the newly installed package, to check that peaky works well in your machine. Just use peaky.run_test()
Other Documentation
The documentation of the functions shown above could be accessed using the following commands:
print(peaky.fit_voigt.__doc__)
print(peaky.fit_gaussian.__doc__)
print(peaky.fit_lorentian.__doc__)
Installation
To install the latest version of the peaky package use the following command:
sudo -H pip3 install peaky
Credits
- Author: Savino Piccolomo
- Inpired during a research visit at the Laboratory of Nano Optics in Siegen
- e-mail: piccolomo@gmail.com
Release history Release notifications | RSS feed


Download files
Download the file for your platform. If you're not sure which to choose, learn more about installing packages.
Source Distribution
Built Distribution
Filter files by name, interpreter, ABI, and platform.
If you're not sure about the file name format, learn more about wheel file names.
Copy a direct link to the current filters
File details
Details for the file peaky-1.1.tar.gz.
File metadata
- Download URL: peaky-1.1.tar.gz
- Upload date:
- Size: 9.7 kB
- Tags: Source
- Uploaded using Trusted Publishing? No
- Uploaded via: twine/5.1.1 CPython/3.12.3
File hashes
| Algorithm | Hash digest | |
|---|---|---|
| SHA256 |
a3a499e0dcf5bc60ec8d9dfbbf6b9d49c8fd25c04391dfeeb6d4e1ca314c18cc
|
|
| MD5 |
27c612087de28a8ba54f639db5bb6c63
|
|
| BLAKE2b-256 |
f31c0897a1e18740817a30bbc8c4e6859f307e3fe3e474d98b5692385160d479
|
File details
Details for the file peaky-1.1-py3-none-any.whl.
File metadata
- Download URL: peaky-1.1-py3-none-any.whl
- Upload date:
- Size: 9.9 kB
- Tags: Python 3
- Uploaded using Trusted Publishing? No
- Uploaded via: twine/5.1.1 CPython/3.12.3
File hashes
| Algorithm | Hash digest | |
|---|---|---|
| SHA256 |
71961b2183213f12c83e3e5f63d85e9bd523510ae851e2f93f6738c881619879
|
|
| MD5 |
6dcdaa876793e830e23365734f37605f
|
|
| BLAKE2b-256 |
a28f7f4936d5b89356b31cc13a51dc17f4bd12d60e1cc67b51b687b78fe4a431
|


