

Pengumon



Find out where your internet actually breaks: your Wi-Fi, your modem, your provider, or the internet beyond.
A self-hosted network monitor that pings every hop once a second, explains each outage, and keeps the evidence.
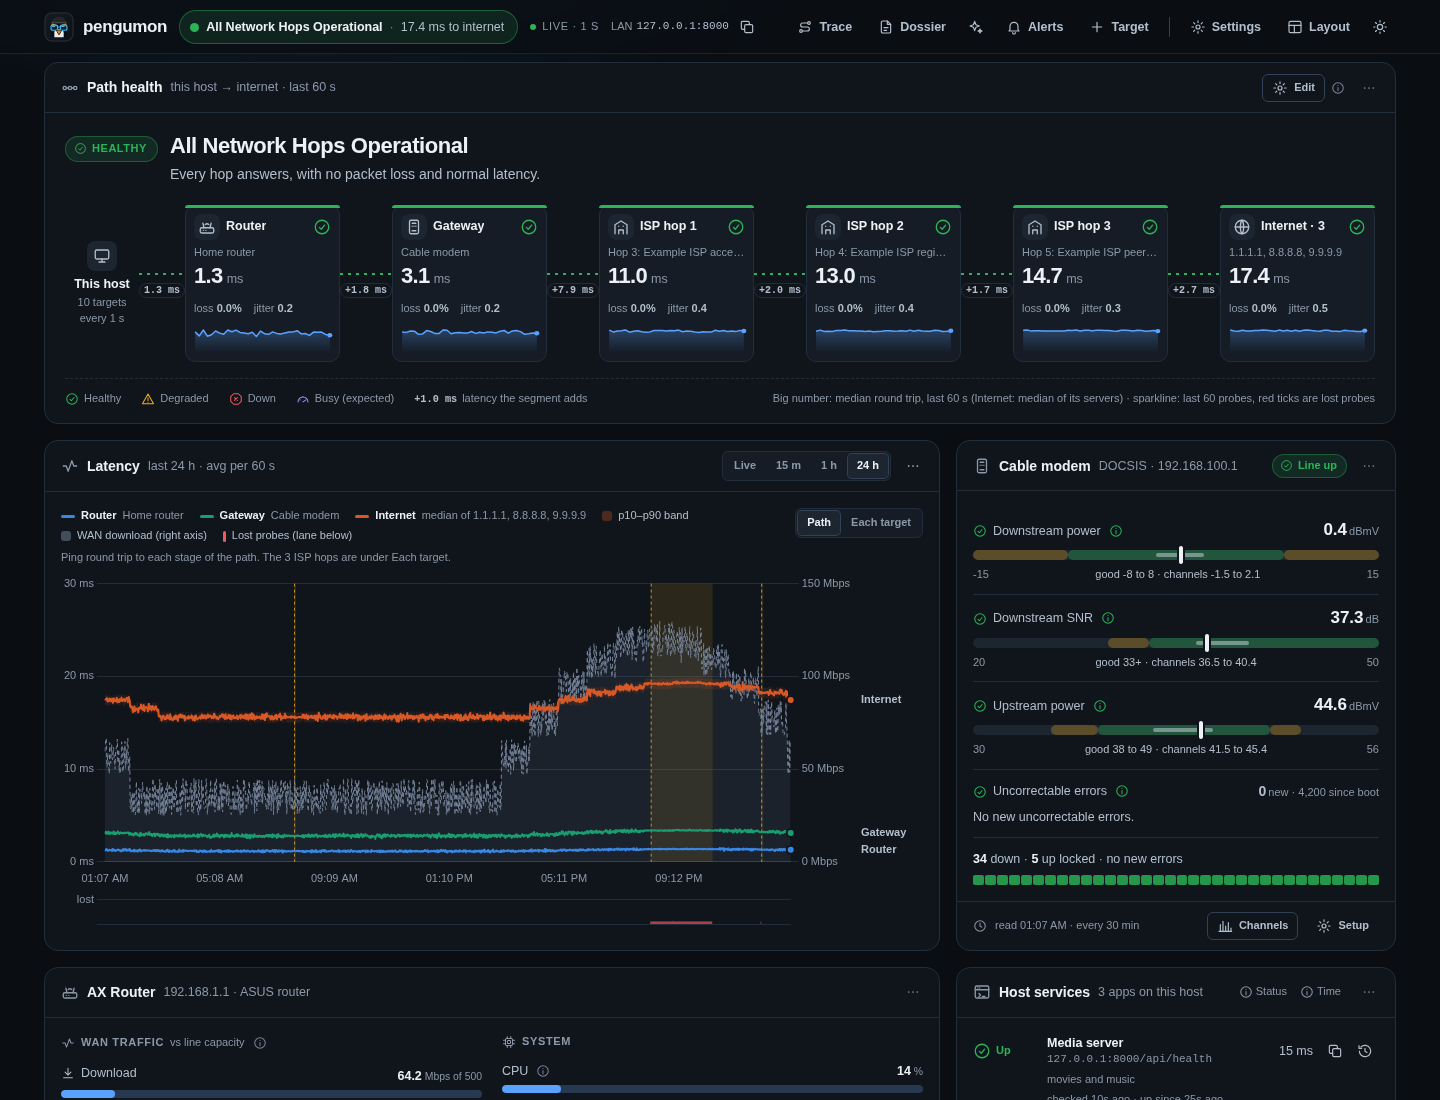
Why
"The internet is slow again" is hard to act on. Was it the Wi-Fi, the cable to the modem, a congested node at the provider, or one far-away server? Pengumon watches each stage of the path all the time, so when something goes wrong you can see where it started, how long it lasted and what the modem and router were doing at that moment, and hand your provider a report instead of a hunch.
Features
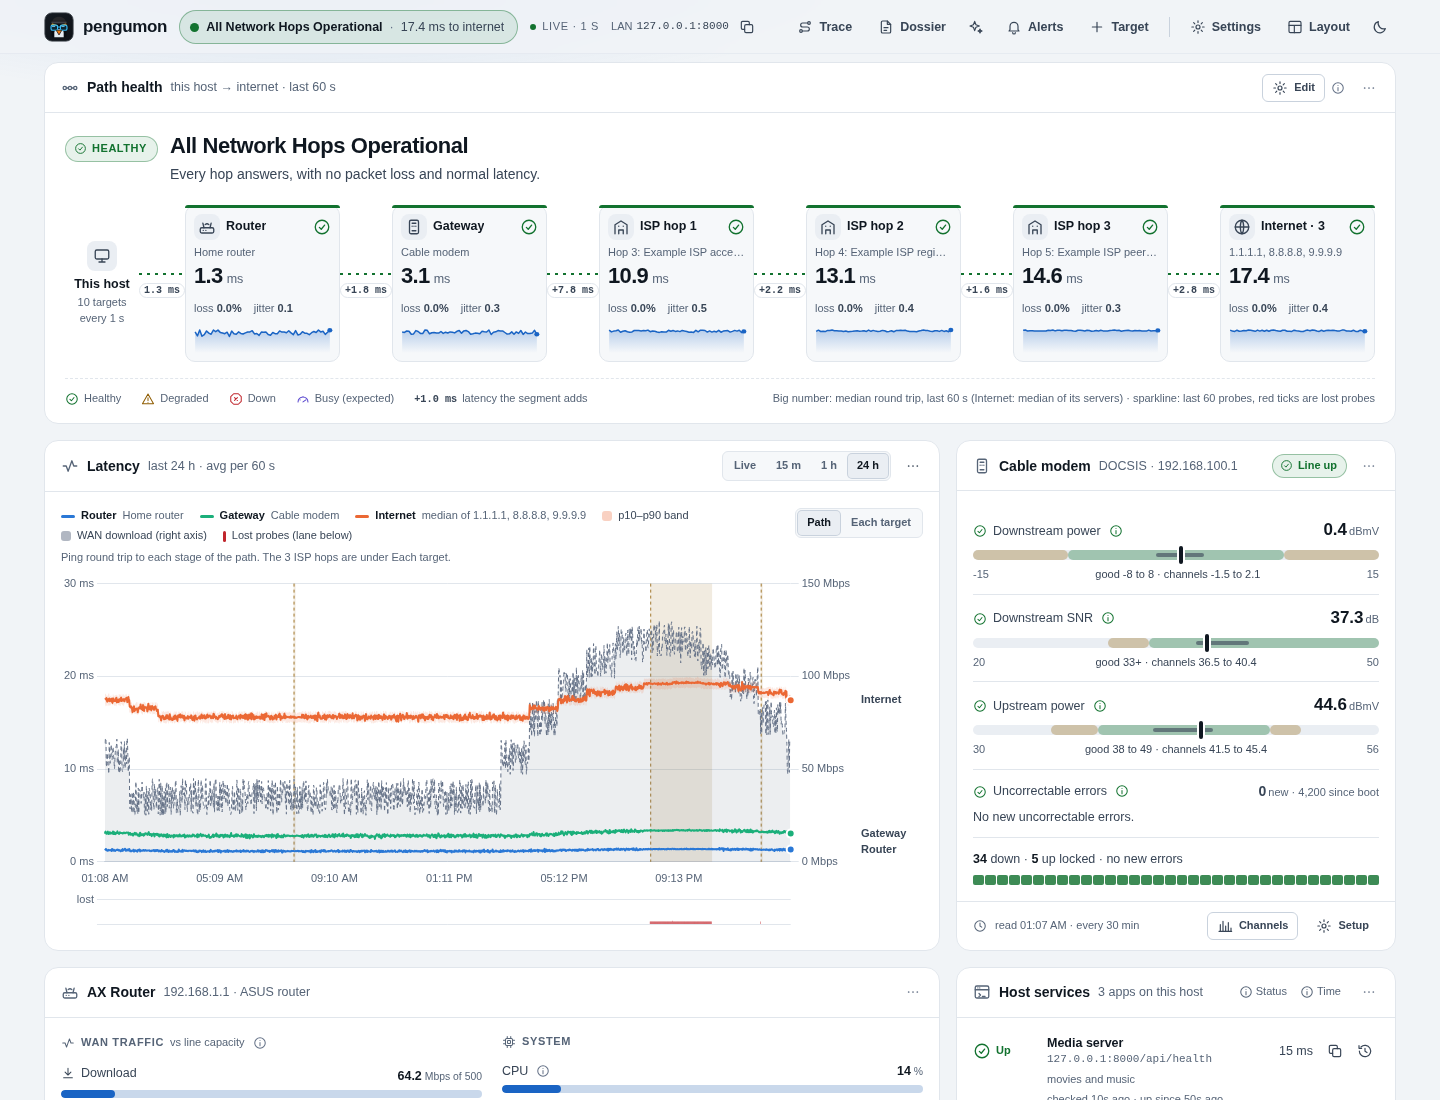
- The whole path, live. This host → router → modem → each provider hop → the internet, with the median latency, loss and jitter of every stage and how much each link adds.
- Every outage explained. A classifier places each problem in your home network, the line, the provider or beyond, and records an incident with per-hop evidence, the modem's signal and the line load at the time.
- Busy is not broken. Router WAN traffic is taken into account, so lag while someone is downloading is marked as expected rather than reported as a fault.
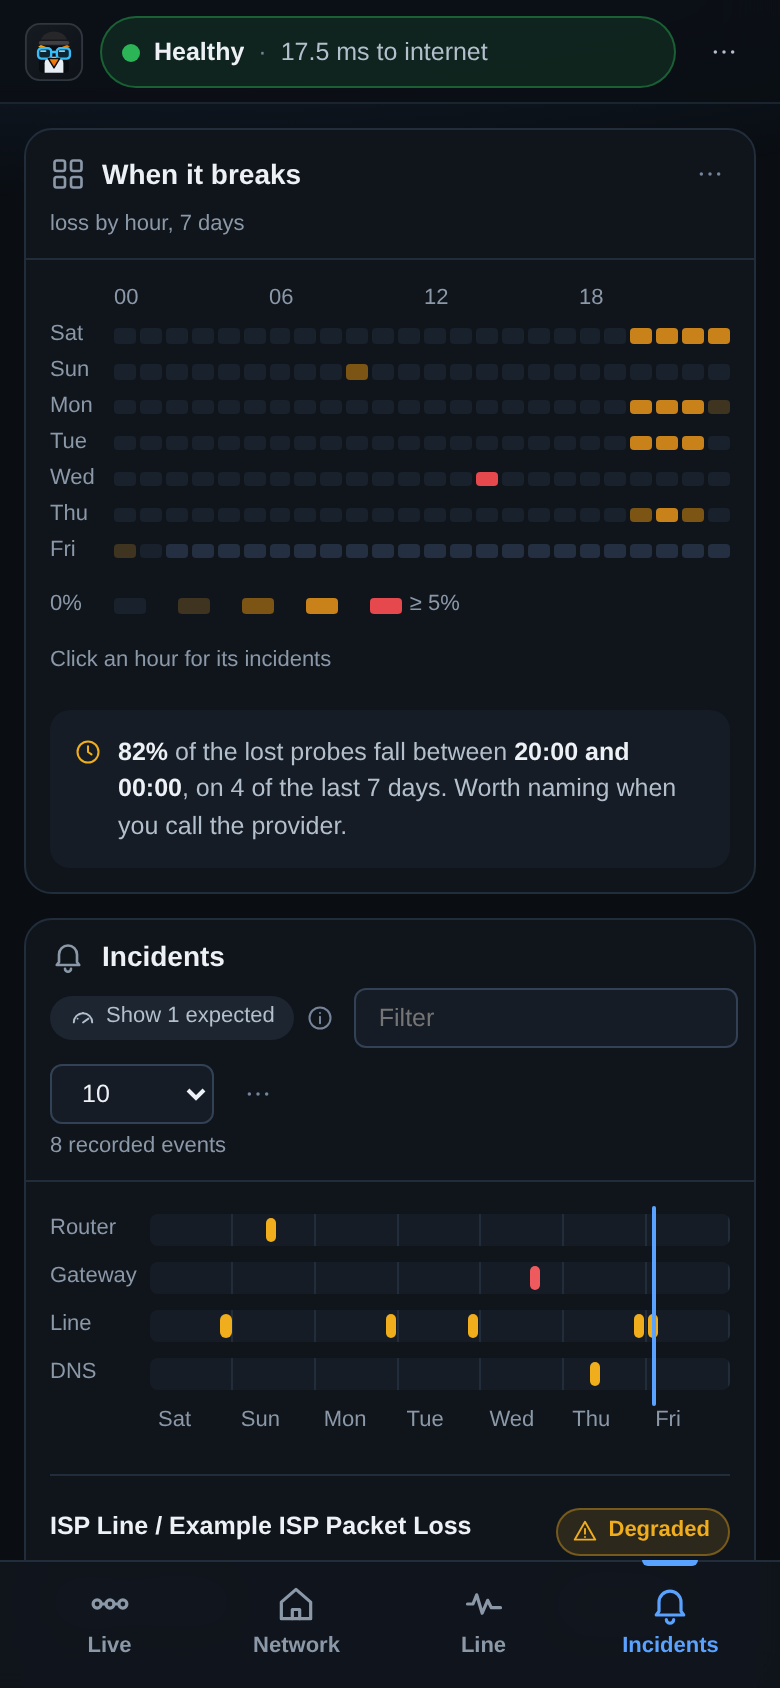
- Patterns over time. Loss by hour of the week, per-target uptime, a reliability report, and an ISP dossier to send to support. Click any hour or uptime block to see the incidents in it.
- Ask an AI. One Markdown document of Pengumon's own findings (where problems start, what is normal, what coincided,
what it cannot see) with instructions, to paste into any chat model; nothing is sent anywhere by Pengumon. Full,
Vague or Anonymized, from the dashboard (or
GET /api/ai-pack): the guide. - Your modem and router. DOCSIS channel levels and codeword errors; router CPU, memory, WAN traffic, connected clients and mesh nodes. Drivers are pluggable.
- Your own apps too. HTTP health checks for self-hosted services, with incidents and alerts by ntfy or webhook.
- Small and private. One process (installed natively or in a container) and one SQLite file. Nothing leaves your network unless you turn on notifications or the optional OpenTelemetry export. Works on a phone.
Install
Pengumon runs natively on Windows, macOS and Linux, or in a container. One command per system; each link goes to that system's section in docs/install.md, with what it needs, what it sets up and how to remove it.
Windows 10/11 (no administrator rights), in PowerShell (details):
irm https://github.com/pengupowered/pengumon/releases/latest/download/install.ps1 | iex
macOS (Apple silicon or Intel) (details), Linux (systemd, x86-64 or arm64) (details) and Raspberry Pi (64-bit OS only) (details) use the same line:
curl -fsSL https://github.com/pengupowered/pengumon/releases/latest/download/install.sh | sh
Container (Docker or Podman on Linux): docker compose up -d with the published image, as below
(details).
The scripts download the release, check every file against its hash, set up Pengumon's own Python, start it in the
background so it survives reboots, and open http://127.0.0.1:8000 (this computer only until you allow more, with an
access token). On Linux and macOS the script asks for sudo once, says why, and has a --user option to avoid it. Run
the same command again to upgrade (your data is backed up first). Not tested yet on real Windows, macOS or Raspberry Pi
hardware: see what has been tested where.
Already use uv? uv tool install pengumon: no dependency hash check and no background service; see the uv section.
Important: Anyone who can reach port 8000 can read the data and change settings until you set
PENGUMON_ACCESS_TOKEN. The default listens on this computer only. See docs/security.md.
Container, the short version (Linux host with Docker or Podman, x86-64 or arm64; host networking so the probes measure the host's own path):
mkdir pengumon && cd pengumon
curl -fsSL https://raw.githubusercontent.com/pengupowered/pengumon/main/compose.release.yaml -o compose.yaml
curl -fsSL https://raw.githubusercontent.com/pengupowered/pengumon/main/config.example.yaml -o config.yaml
                                      # no targets in it: Pengumon finds your network path itself
docker compose up -d                  # or: podman compose up -d
Open http://<host>:8000. Rootless Podman needs unprivileged ping allowed once, and Docker Desktop (macOS, Windows) is
not supported for this: both are explained in docs/install.md, as is building from source.
pengumon doctor says whether probing works here and, if not, what fixes it.
First run
Nothing to configure. When you open the dashboard for the first time, Pengumon traces the path from this computer to the internet by itself (it takes a few seconds; nothing about your path leaves your computer at this point) and Path health shows a banner, "Pengumon found your network path". Press Review to see each hop it found, with a role (your network, the line, your provider, the internet), how sure it is (Sure, Likely or Unsure) and why, then Apply. Until you apply, the default targets keep being probed.
Later, Path health > Edit opens the same editor: rename, re-role, reorder, add, remove, or press Rediscover to trace again and see what changed. Details: docs/path-editor.md and docs/discovery.md, which lists exactly what discovery sends where.
Telling it about your network
The probe path is edited in the dashboard, not in config.yaml: Path health > Edit shows the hops as cards in path
order (see First run and docs/path-editor.md). Export and Import move a
path between installs as YAML.
Everything else is set on the Settings page of the dashboard: devices, service checks, alerts, thresholds, your
line's capacity. config.yaml is only for the listen address, the port, the database path, the probe interval and the
one-time import described next. It is read once, on the first start after an install or an upgrade to 0.21, and copied
into the Settings page; after that, edits to config.yaml are ignored (the startup log says so). Change settings on the
page instead.
Upgrading from 0.17 or older: the first start also imports config.yaml's targets: and the targets added from the
dashboard into the database once, with their ids, so all history stays attached. From then on targets: in the file is
ignored; a fresh install leaves it out and discovers its path.
Each hop has a role (category) that places it on the path. Any number of each works, and none is required:
local: shown as Router; your router or mesh nodes.gateway: shown as Gateway; the cable/fiber modem or the provider's box, probed on its home-side address (those pings never use the line, so loss there is the gateway's, not the line's).isp: shown as ISP hop 1, 2…; your provider's routers, in path order.public: shown as Internet; public resolvers, the figure is their median.custom: shown under its own name; anything else worth watching: a NAS, a VPN, a server.
The dashboard adapts to the shape of your network. A long path folds its provider hops into one node when space runs out. A provider router that ignores ping while traffic passes through it is shown as such, not as down. Custom targets are listed under the path. Hops can be IPv4 or IPv6 addresses, or host names probed over either; the IPv6 servers discovery finds are their own node, "Internet (IPv6)", and on a host without IPv6 they say "IPv6 unavailable on this host" instead of counting as down. Everything is in docs/configuration.md.
Supported devices
xfinity_xb: Xfinity / Comcast XB6, XB7, XB8 gateways. Reads DOCSIS downstream and upstream levels, SNR and codeword errors.asuswrt: AsusWRT routers (RT-AX, ZenWiFi, …). Reads WAN traffic, CPU, memory, clients by band and mesh nodes.openwrt: OpenWrt routers (with LuCI, or rpcd and uhttpd-mod-ubus). Reads WAN traffic, CPU, memory, model and clients (DHCP leases, Wi-Fi stations by band).snmp: anything with an SNMPv2c agent: routers, switches, NAS boxes. Reads WAN (or uplink) traffic, CPU, memory and model.
Probing works with any equipment; devices are an optional extra. Setting up each one, and adding a driver, is described in docs/devices.md.
Alerts
Pengumon can tell you when an incident starts and ends, and when one of your own apps stops answering. Expected conditions (busy line) never alert, a cause is not repeated within a set time (when alerts go out), and a slow receiver cannot delay the probes. Two channels, either or both:
- ntfy. Enter the topic address (and the token for a protected server) on the Settings page, Alerts. The
variables
PENGUMON_NOTIFY_URLandPENGUMON_NOTIFY_TOKENstill win when set (for a container, put them in.env). - Webhooks. Add them on the Settings page: Discord, Slack, or JSON for Home Assistant and your own scripts.
Tokens go in headers, which may name a secret instead of holding it. The URL is kept out of the settings, in
secrets.json.
The Alerts dialog lists the configured channels and has a Send test button. The payload, the three formats and the Home Assistant recipe are in docs/webhooks.md.
A closer look
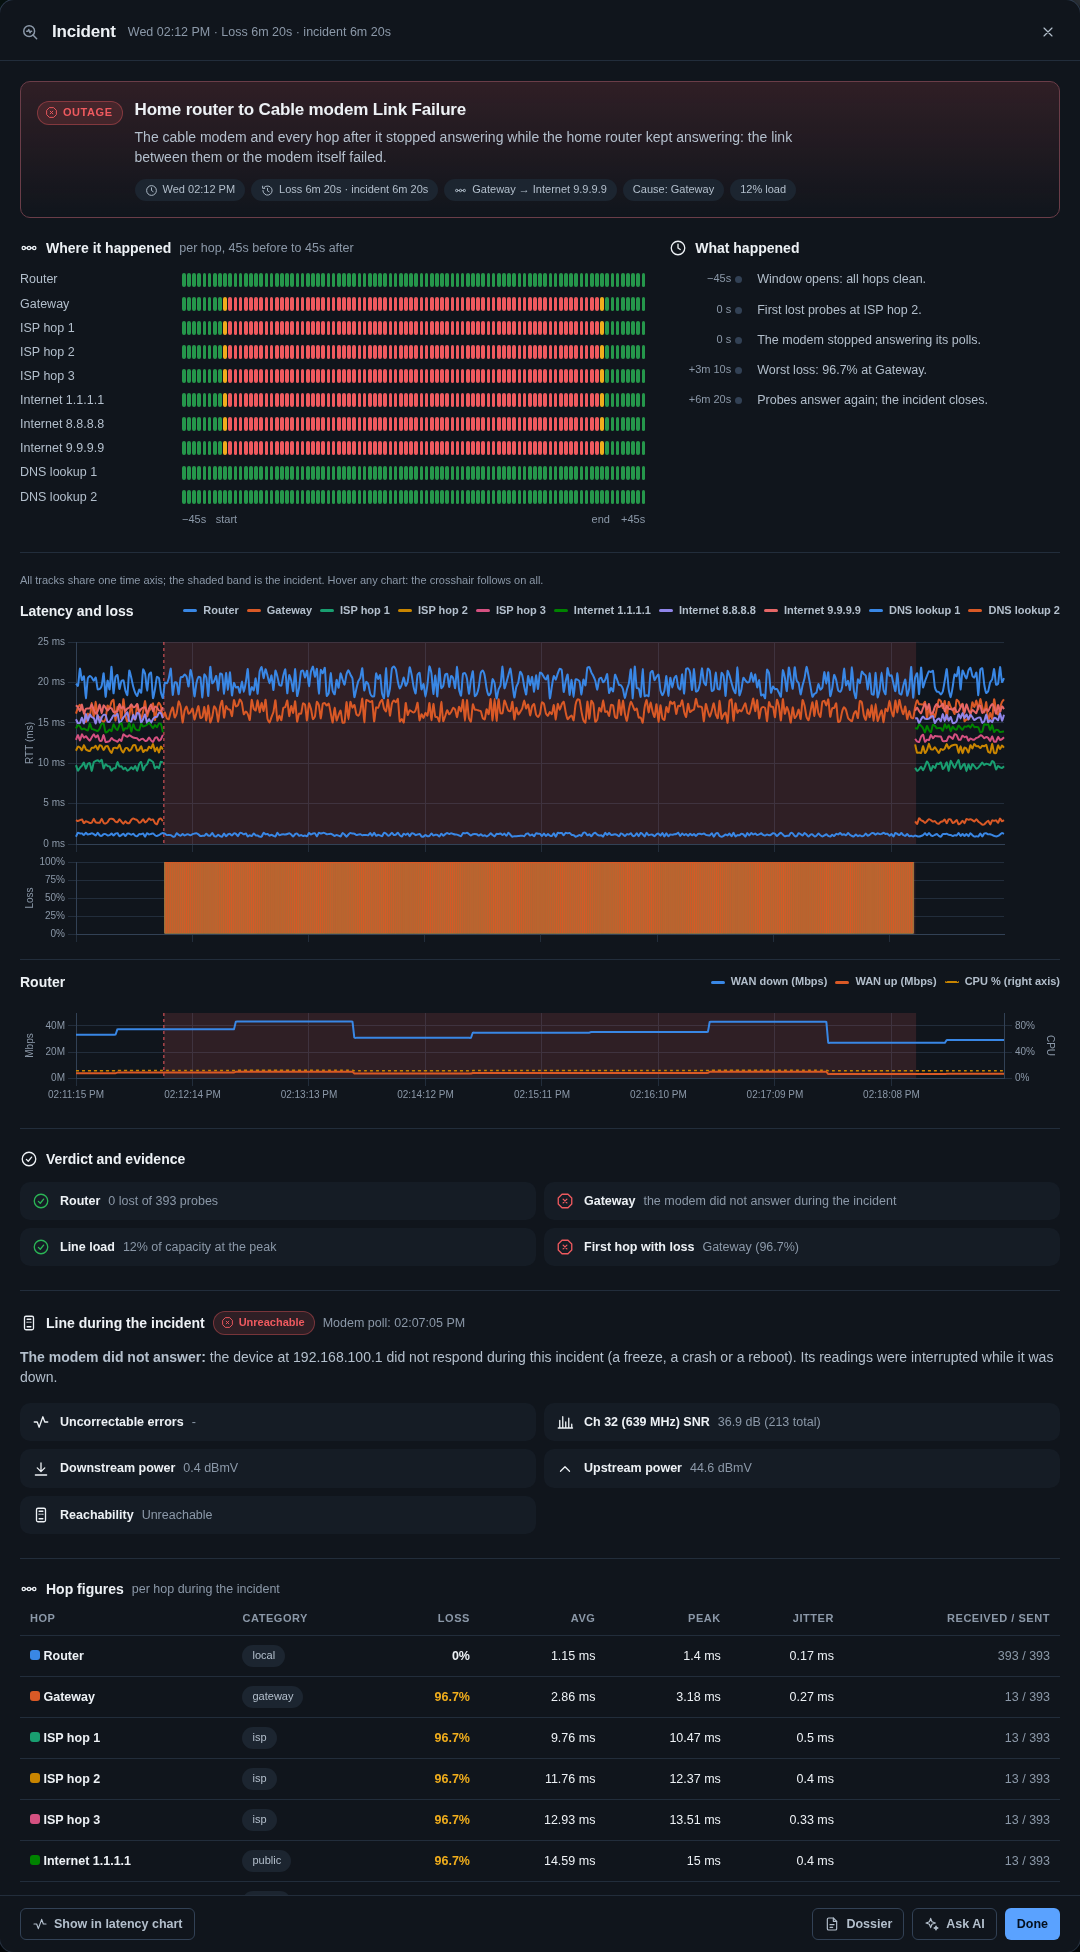
Incident inspector. Where loss first appeared, every hop before, during and after, the modem's signal and the line load.
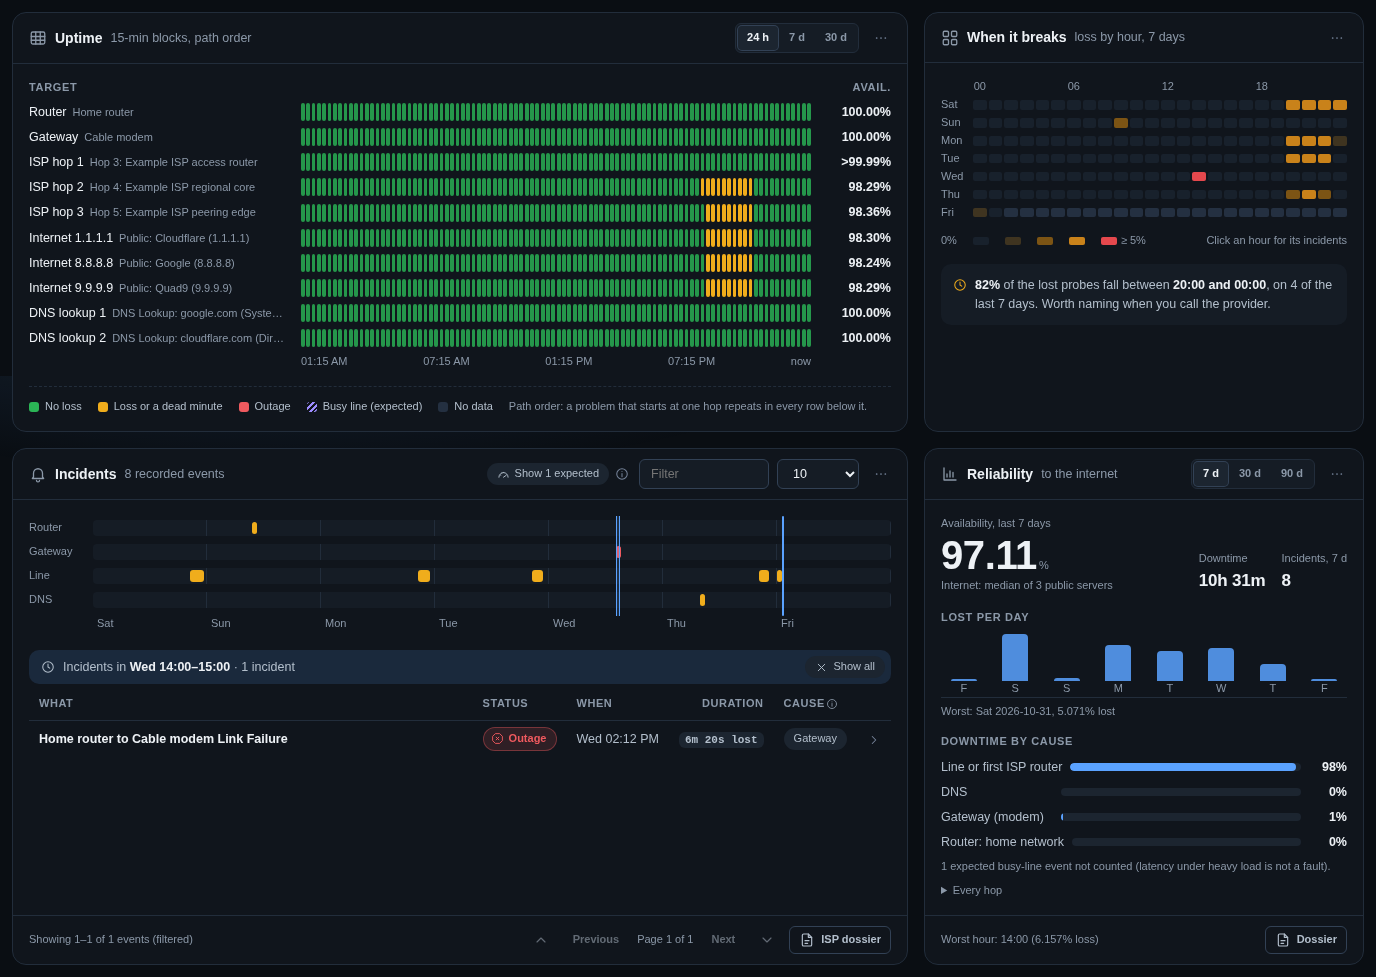
When it breaks. Loss by hour of the week; click an hour to see its incidents.
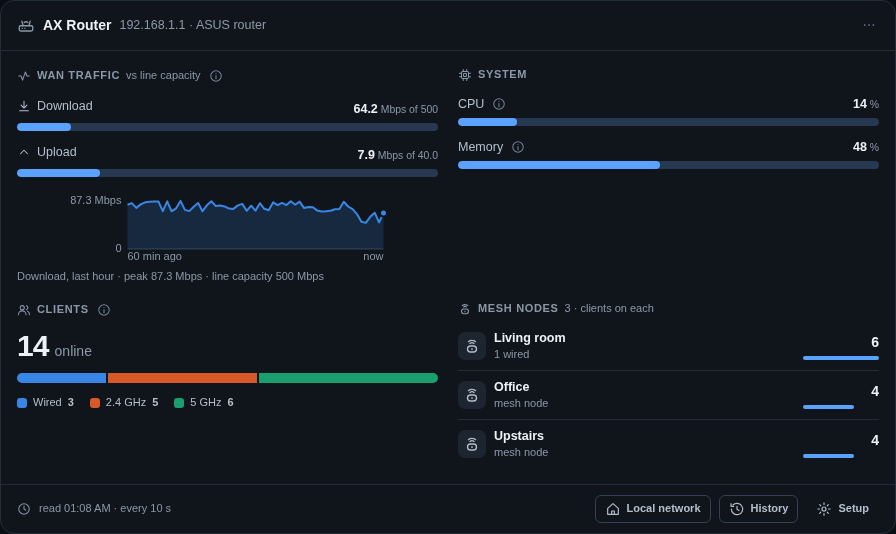
Router. WAN traffic against the line's capacity, CPU and memory, clients by band and per mesh node.
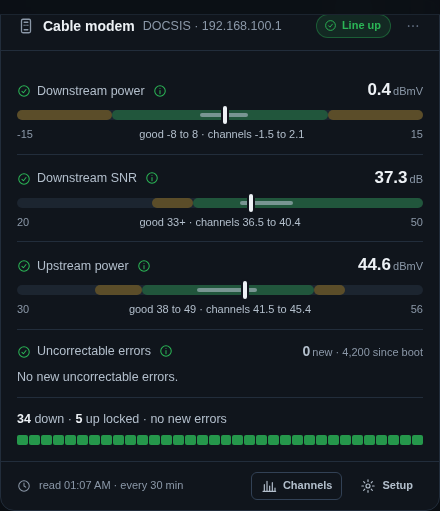
Cable modem. Signal levels against their good ranges, codeword errors and channel lock, with history.
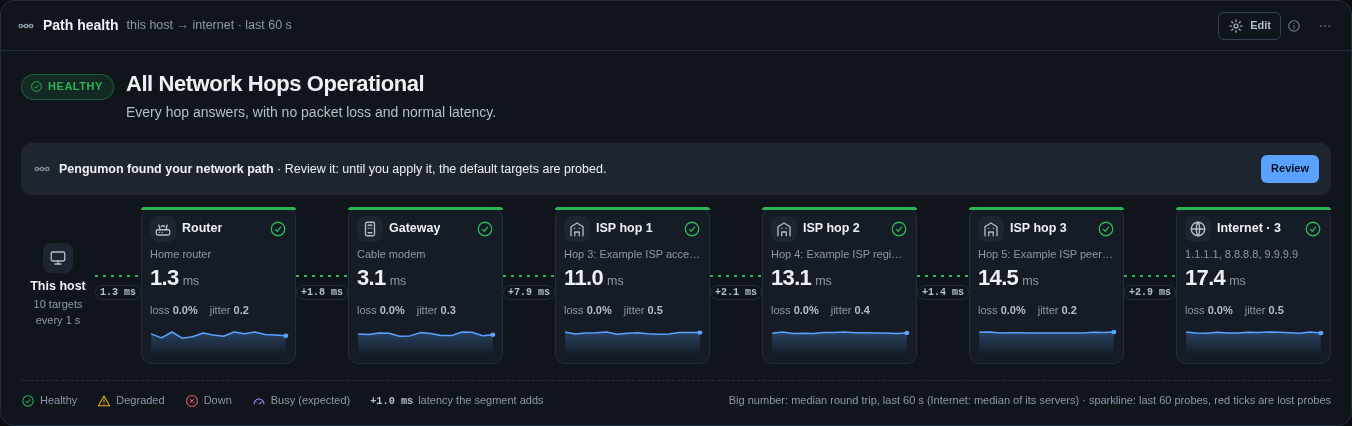
First run. Discovery runs by itself and offers the path it found; the defaults are probed until you apply it.
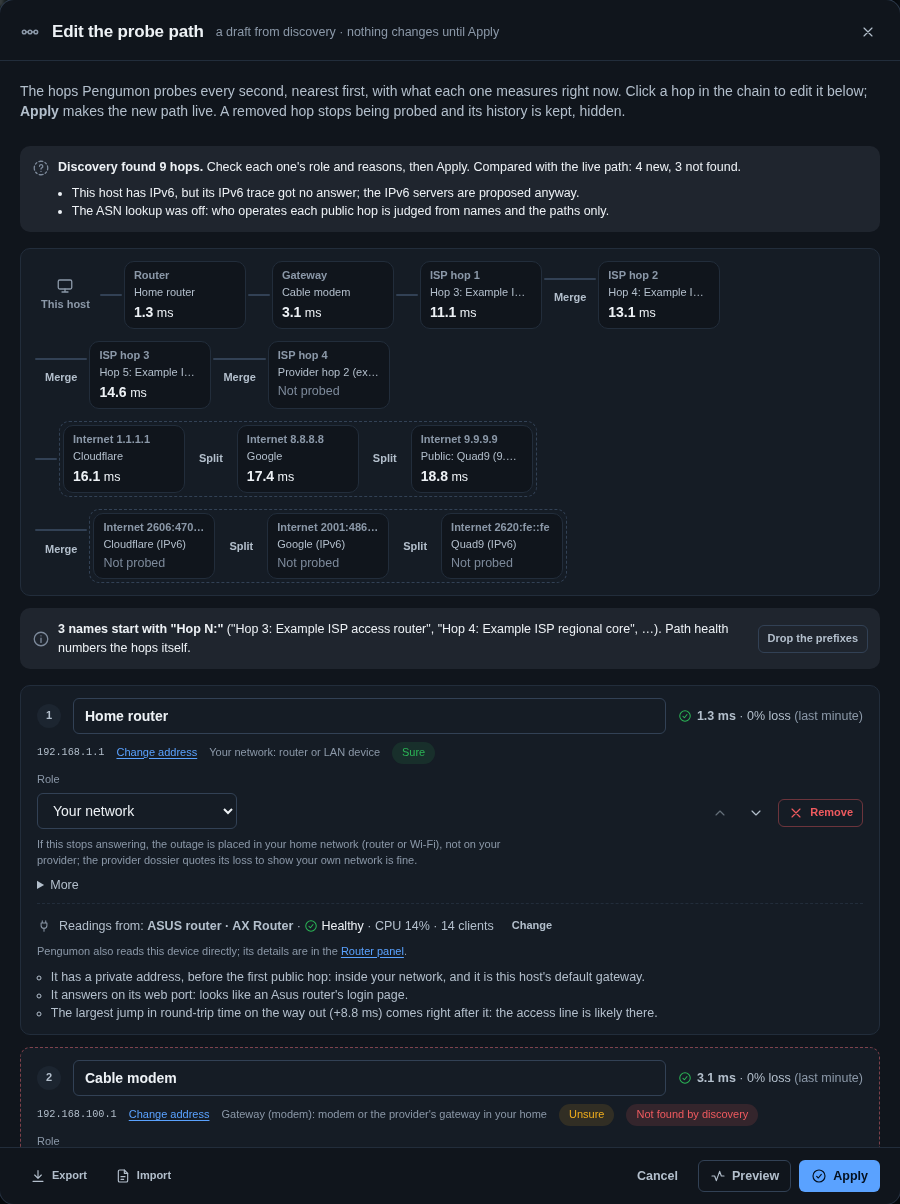
Path editor. Discovery's draft: every hop with a role, how sure it is and why. Edit, then Apply.
Documentation
- Install: Windows, macOS, Linux, Raspberry Pi and container: the install scripts, the background service, upgrading, removing, verifying a download
- Configuration: Where the files live, the listen address, the first-start import, environment variables; the settings themselves are on the Settings page
- Probing: Ping and traceroute over IPv4 and IPv6 on Linux, macOS and Windows,
pengumon doctor, the Linux sysctl step - Path editor: Edit the probe path in the dashboard: hops, roles, groups, Test, Apply, Rediscover, Export and Import, upgrading from 0.17
- Discovery: Finding the path and who operates each hop: what is sent where, how roles are judged
- Devices: Modems and routers on the Settings page: drivers, capabilities, TLS, credentials, writing a driver
- Diagnosis: How outages are classified: load-aware rules, incident kinds and causes
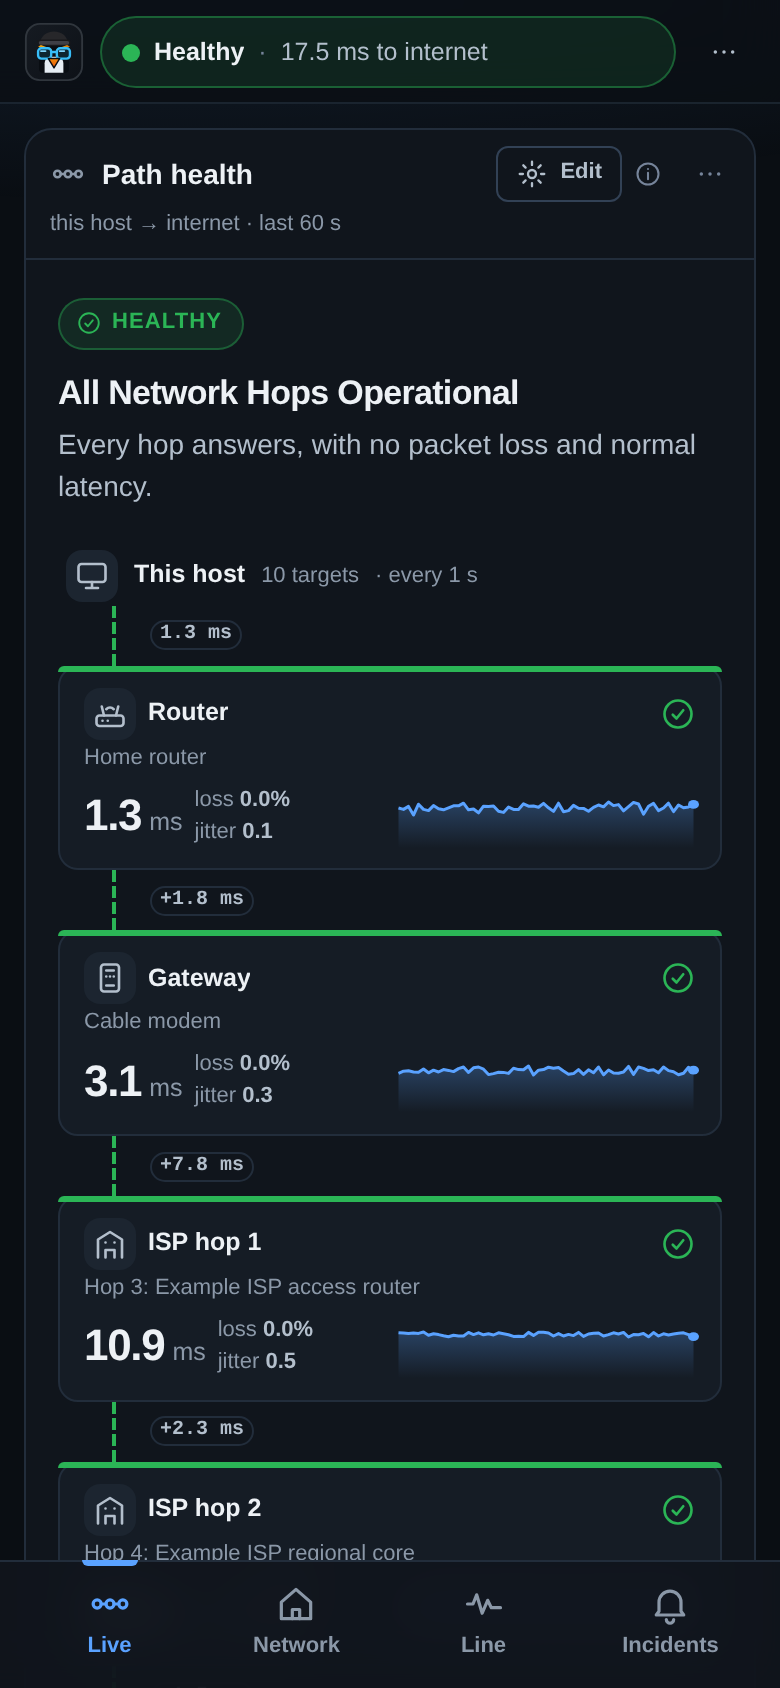
- Dashboard: The panels, the path chain, layout, themes, the phone view
- Ask AI: The troubleshooting pack for a chat assistant: what it holds, the three detail levels, device modules
- Clients: Connected clients and mesh nodes, privacy settings, what is stored
- Services: Health checks for your own apps and their notifications
- Webhooks: Alerts to Discord, Slack, Home Assistant or any URL: config, payload, secrets
- Telemetry: What is stored and sent, logging, OpenTelemetry, ntfy
- Security: Access token, request guard, environment variables
- Storage: Database layout, migrations, upgrade notes
- API: Data and operations endpoints
- Architecture: Components, start-up order, the live message
- Testing: Unit tests, browser tests and lint
- Supply chain: Dependency policy, hash-locked requirements, vendored code
Development
pip install -e ".[dev]"
PENGUMON_CONFIG=config.yaml PENGUMON_DATA=data python -m pengumon.main   # :8000 on 127.0.0.1, ./config.yaml
pytest                             # unit tests
scripts/test.sh                    # the same, in a container
tests/ui/runner/build.sh           # once: the browser test image
scripts/test-ui.sh                 # browser tests in headless Chromium, no network
Dependencies are hash-locked (requirements*.txt, generated from the .in files) and installed with
--require-hashes. scripts/deploy.sh is the maintainer's deploy: it adds a dependency audit (the separate depguard
tool, run when it is installed), a rollback image and a database backup before rebuilding. docker compose is all you need to run Pengumon. Releases are cut as described in docs/releasing.md.
How accurate is it?
Pengumon sends its own ICMP (no ping or traceroute program). On Linux and macOS the probes use kernel receive
timestamps (SO_TIMESTAMPNS / SO_TIMESTAMP, as ping does) over one shared socket, started 25 ms apart; against a
continuous ping they agree within about 0.2 ms. Windows reports round trips in whole milliseconds, and the dashboard
says so. DNS timings are measured in Python and can read a few tenths of a millisecond high. Details per OS:
docs/probing.md.
License
MIT. Chart.js, bundled in src/pengumon/web/static/vendor/, is also MIT-licensed.
1 maintainer

Metadata
1 maintainer
Release files for pengumon 0.23.0
For a detailed explanation of source distributions (sdists) and built distributions (wheels), please see the package formats documentation.
Source distribution (sdist)
| File | Size | Uploaded | Provenance | Actions |
|---|---|---|---|---|
| pengumon-0.23.0.tar.gz | 1.2 MB | With provenance | Details for pengumon-0.23.0.tar.gz |
Built distribution (wheel)
| File | Interpreter | ABI | Platform | Actions Reset |
|---|---|---|---|---|
| pengumon-0.23.0-py3-none-any.whl | Python 3 | none | any | Details for pengumon-0.23.0-py3-none-any.whl |
Total release size: 2.6 MB
Release files / pengumon-0.23.0.tar.gz
| Download URL | pengumon-0.23.0.tar.gz |
|---|---|
| Size | 1.2 MB |
| Tags | Source |
|
SHA-256 checksum How to use checksums |
39bfebea544dcd19a367732bd2146a76a4bbd0d0981623a1ee517060ce185f7b
|
|
BLAKE2b-256 checksum How to use checksums |
0315e32128c8aa4f0cc1d5110c1562dea894647a4f95d56ef643c0443de5c96a
|
| Upload date | |
|
Uploaded using Trusted Publishing? What is trusted publishing? |
Yes |
| Uploaded via |
twine/7.0.0 CPython/3.13.14
|
Provenance
Provenance describes where a file came from. On PyPI, provenance is shared via attestations, which provide a verifiable record of the build or publishing details. View details, limitations and caveats.


PyPI Publish Attestation
PyPI verified that this artifact, at this checksum, originated from the publisher listed below.
Signed by GitHub Actions, verified by PyPI on Nov 5, 2026.
Transparency logRelease files / pengumon-0.23.0-py3-none-any.whl
| Download URL | pengumon-0.23.0-py3-none-any.whl |
|---|---|
| Size | 1.4 MB |
| Tags | Python 3 |
|
SHA-256 checksum How to use checksums |
9deff15b4239c6e176c0f7c5b49f30e6fe545f986642efdd8b3c66eb1037cdec
|
|
BLAKE2b-256 checksum How to use checksums |
20414213147e0cd1ee70663e7d4bb9ef88052d7b3e6ab93345b45522b1e3b340
|
| Upload date | |
|
Uploaded using Trusted Publishing? What is trusted publishing? |
Yes |
| Uploaded via |
twine/7.0.0 CPython/3.13.14
|
Provenance
Provenance describes where a file came from. On PyPI, provenance is shared via attestations, which provide a verifiable record of the build or publishing details. View details, limitations and caveats.
PyPI Publish Attestation
PyPI verified that this artifact, at this checksum, originated from the publisher listed below.
Signed by GitHub Actions, verified by PyPI on Nov 5, 2026.
Transparency logSecurity for pengumon 0.23.0
Provenance
Provenance describes where a file came from. On PyPI, provenance is shared via attestations, which provide a verifiable record of the build or publishing details. View details, limitations and caveats.
Full provenance
Both files in this release have been uploaded with provenance metadata.
Attestation for pengumon-0.23.0.tar.gz
PyPI Publish Attestation
PyPI verified that this artifact, at this checksum, originated from the publisher listed below.
Signed by GitHub Actions, verified by PyPI on Nov 5, 2026.
Transparency logA note on package security
PyPI is a repository for distributing packages, not a service for auditing them. While third-party security researchers and our staff do their best to detect and remove malicious packages, PyPI cannot guarantee the quality, security or suitability of any given package.
To learn more about protecting yourself from malicious actors, visit our package security documentation.














