
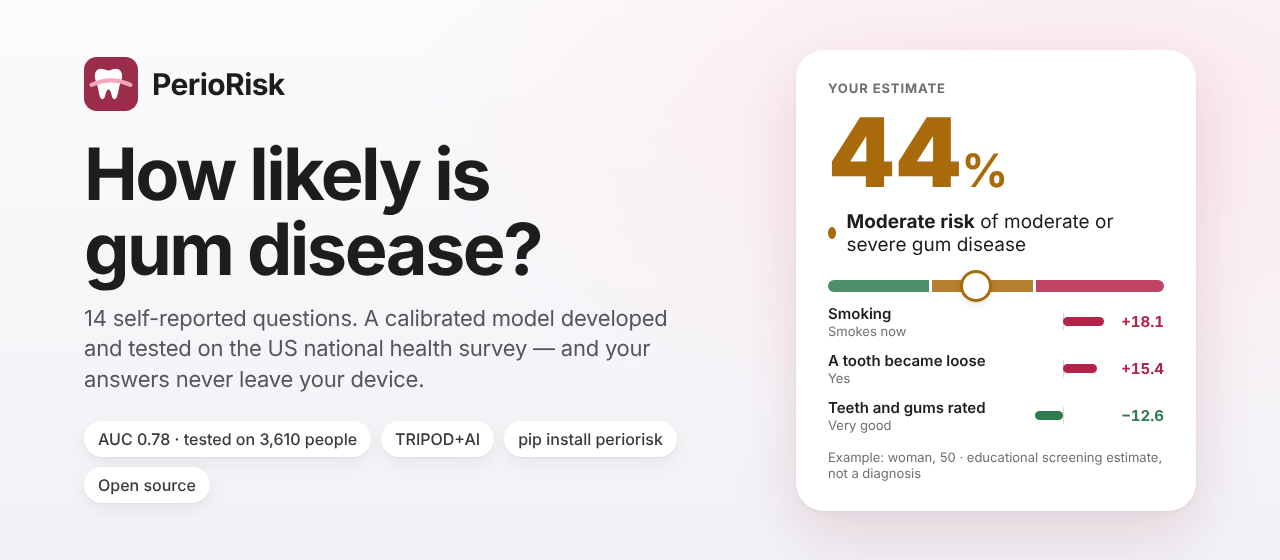
PerioRisk
Periodontitis risk screening from 14 self-reported questions. PerioRisk estimates a person's probability of moderate or severe periodontitis (CDC/AAP surveillance case definition) from questions anyone can answer without a dental examination. It was developed on NHANES 2009–2012, tested once on the later NHANES 2013–2014 cycle, calibrated, checked for fairness and reported following TRIPOD+AI — and it ships as a private in-browser app, a dependency-free Python package and a one-command reproducible pipeline.





⚠️ Educational and research tool — not a diagnosis and not a medical device. Only a periodontal examination with a probe can confirm gum disease. Anyone whose gums bleed, are swollen or whose teeth feel loose should see a dentist, whatever the estimate says.
Why this exists
About 42% of US adults aged 30+ with teeth have periodontitis and 7.8% have the severe form (NHANES 2009–2014, Eke et al. 2018), yet it is often painless until late. The reference standard — a full-mouth probing examination — needs a dental visit. Validated self-report questions can prompt people to have that examination and let researchers estimate periodontitis in surveys that have no examination (Eke et al. 2013, 2016, 2025).
Self-report models of periodontitis already exist — including the CDC's own scoring algorithm (Eke et al. 2025) — and machine-learning models built on NHANES are common, although many are evaluated on a random split of the same survey, include laboratory variables, report discrimination only, or are not released in a usable form. PerioRisk does not claim better discrimination than published self-report models (its AUC of 0.78 is in the same range). It is built to be checked, used and reused:
- Self-report only — 14 questions that follow the NHANES wording; no blood tests, no exam.
- Temporal validation — developed on 2009–2012, tested once on the untouched 2013–2014 cycle.
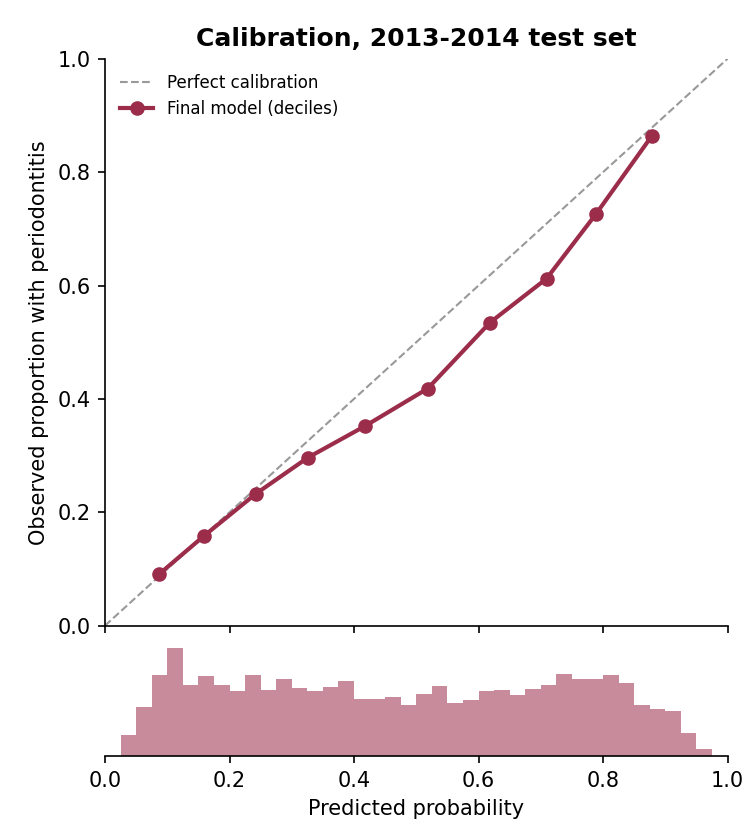
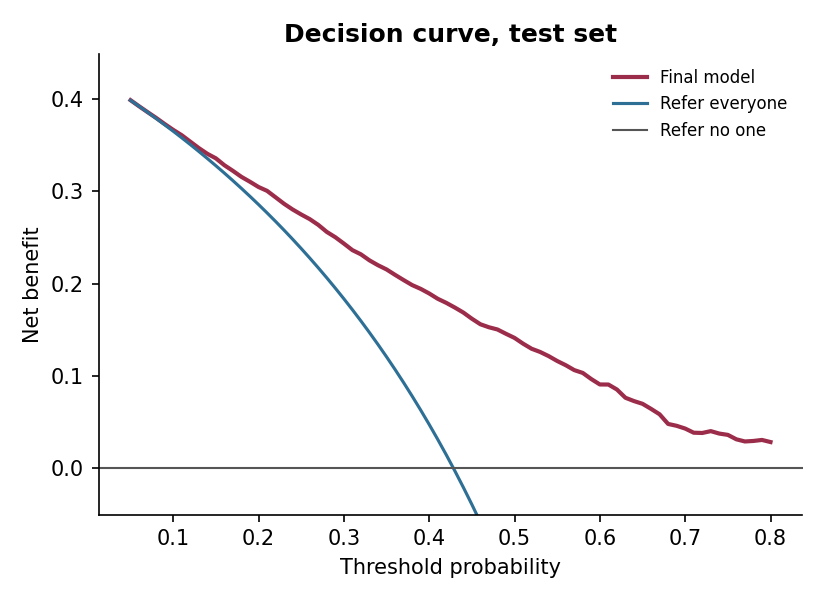
- Calibration, not just AUC — calibration slope, calibration-in-the-large and observed/expected ratio with 95% CIs, decision-curve analysis and subgroup calibration.
- Population-representative performance — survey-weighted estimates with design-based confidence intervals (Rao–Wu bootstrap over the NHANES strata and PSUs).
- Transportability, honestly — a documented prevalence (prior-shift) adjustment for populations with a known prevalence, with its limits shown.
- Exactly portable — the fitted model is exported to plain JSON and re-implemented in pure Python and in JavaScript; both reproduce scikit-learn's probabilities for all 10,660 participants to within 1e-12, tested on every commit.
- Private by design — the web app runs entirely in the browser; answers never leave the device.
- Bit-for-bit reproducible — one command downloads the public data and rebuilds the same model.
Three ways to use it
1. In your browser — for anyone
hezarani.github.io/periorisk — answer the 14 questions (about two minutes) and see your estimate, what it means, which answers shaped it and what to do next, with a one-page summary you can print for your dentist. Nothing is uploaded, stored or tracked. The questions use the NHANES wording (two NHANES smoking questions are combined into one, and education answers are grouped).
2. In Python — for researchers, apps and batch scoring
pip install periorisk # Python 3.10+, no dependencies
import periorisk

r = periorisk.predict(
    age=58, sex="male", height_cm=178, weight_kg=85,
    education="high_school", smoking="current", diabetes="no",
    gum_health="fair", gum_treatment="no", loose_teeth="yes", bone_loss="not_sure",
    tooth_doesnt_look_right="no", floss_days=0, mouthwash_days=0,
)
print(r.percent, r.band)          # e.g. 91 high
print(r.summary())                # plain-language result with the answers that moved it most

# research use: adjust to a population with a different prevalence (prior-shift adjustment)
periorisk.recalibrate(r.probability, target_prevalence=0.30)
Unanswered questions (or "not_sure") are filled with a typical answer from the training data (the
most common answer, or the median for numbers). r.contributions lists how much each answer moved
the estimate compared with that typical answer — a description of the model, not of cause and effect.
periorisk.questionnaire() lists every question with its NHANES source variable and allowed answers.
3. On the command line
periorisk predict --age 58 --sex male --smoking current --gum-health fair --loose-teeth yes --floss-days 0
periorisk batch answers.csv results.csv        # one row per person, columns named like the questions
periorisk questions                            # the questionnaire
periorisk info                                 # model version, population and performance
Results (NHANES 2013–2014 temporal test set, n = 3,610)
95% CIs from 1,000 participant-level bootstrap resamples, except the survey-weighted rows, whose design-based CIs (Rao–Wu bootstrap over strata and PSUs) are wider and more realistic.
| Measure | Estimate (95% CI) |
|---|---|
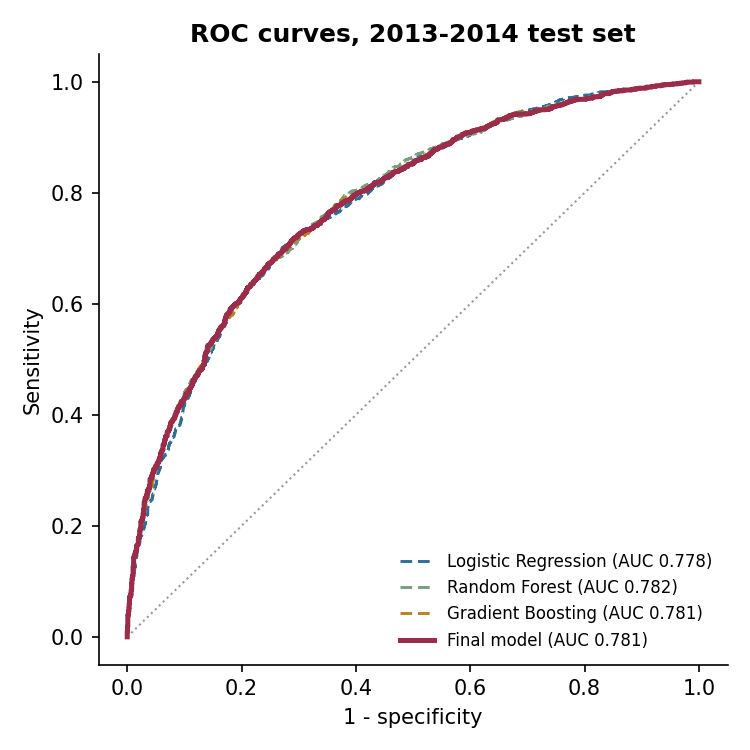
| AUC | 0.781 (0.766–0.796) |
| Sensitivity / specificity at the pre-specified threshold (0.47) | 0.734 (0.712–0.755) / 0.680 (0.658–0.702) |
| Positive / negative predictive value | 0.633 / 0.773 |
| Brier score | 0.190 (0.184–0.198) |
| Calibration slope (ideal 1) | 0.909 (0.839–0.979) |
| Observed / expected ratio (ideal 1) | 0.903 (0.874–0.935) |
| Survey-weighted AUC (US population 30+ with teeth) | 0.785 (0.760–0.807) |
| Survey-weighted observed / expected ratio | 0.799 (0.723–0.882) |
Model comparison. Logistic regression (AUC 0.778), random forest (0.782) and gradient boosting (0.781) performed almost identically — consistent with the systematic finding that machine learning rarely beats logistic regression on tabular clinical data (Christodoulou et al. 2019). Gradient boosting was selected by the pre-specified rule (highest cross-validated AUC on the training data) and calibrated with 5-fold sigmoid scaling.
Risk bands used in the app. Among test participants with an estimate below 30%, 16.9% had moderate or severe periodontitis; 30–60%: 37.4%; 60% or more: 69.8%. Used as screening rules, an estimate of 30% or more flagged 87% of people with the disease (specificity 47%), and 60% or more flagged 60% (specificity 80%).
Calibration and transportability. Prevalence fell from 48.7% (2009–2012 sample) to 42.9%
(2013–2014), so the model over-estimates slightly in the test cycle (O/E 0.90), and more for the
US population as a whole once the survey weights undo NHANES's over-sampling (O/E 0.80).
periorisk.recalibrate re-weights the predicted odds to a known prevalence. Using the test cycle's
own prevalence it brings O/E to 0.99 — guaranteed by construction, so this only demonstrates the
mechanism — and it never changes discrimination. It is not a cure-all: adjusting to the
survey-weighted US prevalence (34.3%) over-corrects (weighted O/E 0.80 → 1.06), because that
miscalibration comes from who NHANES samples rather than from prevalence alone.
Fairness. Race/ethnicity is not an input. Test AUC by subgroup ranged 0.71–0.80 across sex, age group, race/ethnicity, education and diabetes; it was lowest in people aged 65+ (0.73), with less than high-school education (0.71) and with diabetes (0.72). Observed/expected ratios per group are in the report.
Everything — cohort flow with exclusion reasons, participant characteristics, missing data, per-model metrics, bootstrap and survey-weighted CIs, decision-curve table, subgroup calibration, a sensitivity analysis and permutation importance — is in reports/results.md, written automatically by the pipeline.
| Calibration | ROC curves | Decision curve |
|---|---|---|
 |
 |
 |
Data, outcome and predictors
- Data: NHANES 2009–2010, 2011–2012 and 2013–2014 (CDC/NCHS, public domain) — the three cycles with a full-mouth periodontal examination (six sites per tooth, all teeth except third molars).
- Population: adults aged 30+ with a complete periodontal examination and at least two teeth measured (n = 10,660; training 7,050, test 3,610).
- Outcome: moderate or severe periodontitis by the CDC/AAP case definition (Page & Eke 2007; Eke et al. 2012), from interproximal clinical attachment loss and probing depth. The labelling code reproduces the CDC's published survey-weighted prevalence (42.3% vs 42.2% any periodontitis; 7.8% vs 7.8% severe; Eke et al. 2018).
- Predictors (13 model inputs from 14 questions): age, sex, body-mass index (from height and weight), education, cigarette smoking, diabetes, self-rated health of teeth and gums, past gum treatment, loose teeth, told of bone loss, a tooth that "doesn't look right", and days of interdental cleaning and of mouthwash use in the past week — the CDC/AAP self-report items (Eke & Dye 2009) plus standard risk factors. Race/ethnicity is used only to check fairness. The eighth CDC/AAP item ("Do you think you might have gum disease?") was not pre-specified; adding it raised cross-validated AUC slightly (0.803 → 0.807) and is a candidate for a future version.
The model card covers intended use, limits and fairness; the TRIPOD+AI checklist maps every reporting item to where it is answered.
Reproduce everything
git clone https://github.com/Hezarani/periorisk && cd periorisk
pip install -r requirements-training.txt     # exact versions used (Python 3.12)
python -m training                           # ~3 minutes on a laptop, no GPU
python -m pytest                             # 97 checks
python -m training downloads the 18 NHANES files (~95 MB) from the CDC, stores every step in a
local SQLite database (data/perio.db, see sql/views.sql), trains and evaluates the models,
rewrites models/, reports/ and data/processed/, and exports the portable model to
periorisk/data/model.json and docs/model.js — refusing to write it unless it reproduces
scikit-learn's predictions for every participant. Re-running it gives byte-identical results.
Repository structure
docs/                    web app (GitHub Pages): index.html, app.js, periorisk.js (engine), model.js
periorisk/               Python package: predict(), recalibrate(), CLI; data/model.json
training/                pipeline: download, clean (case definition), train, evaluate, export, run
sql/views.sql            summary views over the pipeline database
data/processed/          analytic dataset (CSV, one row per participant)
models/                  fitted scikit-learn model + metadata
reports/                 results.md, metrics.json, figures
tests/                   pytest suite (Python ⇄ scikit-learn ⇄ JavaScript parity, API, case definition)
MODEL_CARD.md · TRIPOD-AI.md · paper.md · CITATION.cff
Limitations
- Developed and tested in the US population; performance in other countries is unknown and needs external validation (and, if prevalence differs, recalibration).
- Cross-sectional: it estimates current disease, not future risk.
- Self-reported answers can be wrong; body-mass index was measured in NHANES but is self-reported in the app.
- Model development did not use the survey weights; weighted results are reported for evaluation.
- Participants with a partial periodontal examination (210) were excluded.
- Not evaluated prospectively, in dental clinics, or with translated questionnaires.
References & prior work
Case definition, self-report measures and US prevalence (what PerioRisk builds on)
- Page RC, Eke PI. Case definitions for use in population-based surveillance of periodontitis. J Periodontol 2007;78(7 Suppl):1387–1399. doi:10.1902/jop.2007.060264
- Eke PI, Page RC, Wei L, Thornton-Evans G, Genco RJ. Update of the case definitions for population-based surveillance of periodontitis. J Periodontol 2012;83(12):1449–1454. doi:10.1902/jop.2012.110664
- Eke PI, Dye B. Assessment of self-report measures for predicting population prevalence of periodontitis. J Periodontol 2009;80(9):1371–1379. doi:10.1902/jop.2009.080607
- Eke PI, Dye BA, Wei L, et al. Self-reported measures for surveillance of periodontitis. J Dent Res 2013;92(11):1041–1047. doi:10.1177/0022034513505621
- Eke PI, Zhang X, Lu H, et al. Predicting periodontitis at state and local levels in the United States. J Dent Res 2016;95(5):515–522. doi:10.1177/0022034516629112
- Eke PI, Thornton-Evans GO, Wei L, Borgnakke WS, Dye BA, Genco RJ. Periodontitis in US adults: National Health and Nutrition Examination Survey 2009–2014. J Am Dent Assoc 2018;149(7):576–588.e6. doi:10.1016/j.adaj.2018.04.023
- Centers for Disease Control and Prevention, National Center for Health Statistics. National Health and Nutrition Examination Survey data, 2009–2014. wwwn.cdc.gov/nchs/nhanes
Closest prior and related work
- Eke PI, Wei L, Thornton-Evans G, Borgnakke WS. Scoring algorithm for predicting periodontitis in dentate adults using self-report measures — NHANES 2009–2012. Periodontol 2000 2025;98(1):7–19. doi:10.1111/prd.12624
- Montero E, Herrera D, Sanz M, Dhir S, Van Dyke T, Sima C. Development and validation of a predictive model for periodontitis using NHANES 2011–2012 data. J Clin Periodontol 2019;46(4):420–429. doi:10.1111/jcpe.13098
- Bashir NZ, Rahman Z, Chen SL. Systematic comparison of machine learning algorithms to develop and validate predictive models for periodontitis. J Clin Periodontol 2022;49(10):958–969. doi:10.1111/jcpe.13692
- Vu GT, Mayya V, Mandhidi B, et al. Application of machine learning to predict periodontal disease in US adults: a cross-sectional analysis of NHANES 2009–2014. Health Informatics J 2025;31(4). doi:10.1177/14604582251394617
- Verhulst MJL, Teeuw WJ, Bizzarro S, et al. A rapid, non-invasive tool for periodontitis screening in a medical care setting. BMC Oral Health 2019;19:87. doi:10.1186/s12903-019-0784-7
- Viana J, Machado V, Lyra P, et al. External validation of periodontal screening using self-reports in dental settings. Diagnostics 2025;15(23):3015. doi:10.3390/diagnostics15233015
- Bi M, Xie Y, Yu X, et al. Diagnostic accuracy of self-reported questionnaires for detecting periodontitis across multiple cultures and geographic locations: a systematic review and meta-analysis. J Clin Periodontol 2025;52(11):1510–1528. doi:10.1111/jcpe.70002
Methods used
- Collins GS, Moons KGM, Dhiman P, et al. TRIPOD+AI statement: updated guidance for reporting clinical prediction models that use regression or machine learning methods. BMJ 2024;385:e078378. doi:10.1136/bmj-2023-078378
- Van Calster B, McLernon DJ, van Smeden M, Wynants L, Steyerberg EW. Calibration: the Achilles heel of predictive analytics. BMC Med 2019;17:230. doi:10.1186/s12916-019-1466-7
- Vickers AJ, Elkin EB. Decision curve analysis: a novel method for evaluating prediction models. Med Decis Making 2006;26(6):565–574. doi:10.1177/0272989X06295361
- Christodoulou E, Ma J, Collins GS, Steyerberg EW, Verbakel JY, Van Calster B. A systematic review shows no performance benefit of machine learning over logistic regression for clinical prediction models. J Clin Epidemiol 2019;110:12–22. doi:10.1016/j.jclinepi.2019.02.004
- Saerens M, Latinne P, Decaestecker C. Adjusting the outputs of a classifier to new a priori probabilities: a simple procedure. Neural Comput 2002;14(1):21–41. doi:10.1162/089976602753284446
- Rao JNK, Wu CFJ, Yue K. Some recent work on resampling methods for complex surveys. Survey Methodology 1992;18(2):209–217.
- Friedman JH. Greedy function approximation: a gradient boosting machine. Ann Stat 2001;29(5):1189–1232. doi:10.1214/aos/1013203451
- Breiman L. Random forests. Mach Learn 2001;45(1):5–32. doi:10.1023/A:1010933404324
- Youden WJ. Index for rating diagnostic tests. Cancer 1950;3(1):32–35. doi:10.1002/1097-0142(1950)3:1<32::AID-CNCR2820030106>3.0.CO;2-3
- Pedregosa F, Varoquaux G, Gramfort A, et al. Scikit-learn: machine learning in Python. J Mach Learn Res 2011;12:2825–2830.
Citation and licence
If you use PerioRisk, please cite it with GitHub's "Cite this repository" button (from
CITATION.cff).
Code: MIT License © 2026 Hossein Boustani Hezarani, DDS (ORCID 0009-0007-8481-0498). NHANES data: public domain (CDC/NCHS). Part of the open DentGit dental tools: ToothNotation, OraCalm, DentRx, OdontoAge, DentDeID.
1 maintainer

Metadata
1 maintainer
Release files for periorisk 1.0.0
For a detailed explanation of source distributions (sdists) and built distributions (wheels), please see the package formats documentation.
Source distribution (sdist)
| File | Size | Uploaded | Provenance | Actions |
|---|---|---|---|---|
| periorisk-1.0.0.tar.gz | 179.3 kB | With provenance | Details for periorisk-1.0.0.tar.gz |
Built distribution (wheel)
| File | Interpreter | ABI | Platform | Actions Reset |
|---|---|---|---|---|
| periorisk-1.0.0-py3-none-any.whl | Python 3 | none | any | Details for periorisk-1.0.0-py3-none-any.whl |
Total release size: 351.1 kB
Release files / periorisk-1.0.0.tar.gz
| Download URL | periorisk-1.0.0.tar.gz |
|---|---|
| Size | 179.3 kB |
| Tags | Source |
|
SHA-256 checksum How to use checksums |
0624675d743d971b3243394e884a407c040a45214d9af1451180d9ceb55a9918
|
|
BLAKE2b-256 checksum How to use checksums |
a8b1e67a13c063443caaf9e5ec1295612828c67af086aa27c8e73b83b1a6c42f
|
| Upload date | |
|
Uploaded using Trusted Publishing? What is trusted publishing? |
Yes |
| Uploaded via |
twine/7.0.0 CPython/3.13.16
|
Provenance
Provenance describes where a file came from. On PyPI, provenance is shared via attestations, which provide a verifiable record of the build or publishing details. View details, limitations and caveats.


PyPI Publish Attestation
PyPI verified that this artifact, at this checksum, originated from the publisher listed below.
Signed by GitHub Actions, verified by PyPI on Oct 30, 2026.
Transparency logRelease files / periorisk-1.0.0-py3-none-any.whl
| Download URL | periorisk-1.0.0-py3-none-any.whl |
|---|---|
| Size | 171.9 kB |
| Tags | Python 3 |
|
SHA-256 checksum How to use checksums |
443f41acae493db345a8f516d05879ad231748267ad06d4c00cd5f33fb8c5cf0
|
|
BLAKE2b-256 checksum How to use checksums |
33156624cdd88589dac2a036d8d996273a2ffa32a5537c9fa491de1da53ae073
|
| Upload date | |
|
Uploaded using Trusted Publishing? What is trusted publishing? |
Yes |
| Uploaded via |
twine/7.0.0 CPython/3.13.16
|
Provenance
Provenance describes where a file came from. On PyPI, provenance is shared via attestations, which provide a verifiable record of the build or publishing details. View details, limitations and caveats.
PyPI Publish Attestation
PyPI verified that this artifact, at this checksum, originated from the publisher listed below.
Signed by GitHub Actions, verified by PyPI on Oct 30, 2026.
Transparency logSecurity for periorisk 1.0.0
Provenance
Provenance describes where a file came from. On PyPI, provenance is shared via attestations, which provide a verifiable record of the build or publishing details. View details, limitations and caveats.
Full provenance
All 2 files in this release have been uploaded with provenance metadata.
Attestation for periorisk-1.0.0.tar.gz
PyPI Publish Attestation
PyPI verified that this artifact, at this checksum, originated from the publisher listed below.
Signed by GitHub Actions, verified by PyPI on Oct 30, 2026.
Transparency logA note on package security
PyPI is a repository for distributing packages, not a service for auditing them. While third-party security researchers and our staff do their best to detect and remove malicious packages, PyPI cannot guarantee the quality, security or suitability of any given package.
To learn more about protecting yourself from malicious actors, visit our package security documentation.













